Over the weekend, the Bitcoin price retreated to the area of average prices and consolidated in a sideways range. At firstthis week, the bears may break through the nearest support and continue the pullback.
BTC / USD
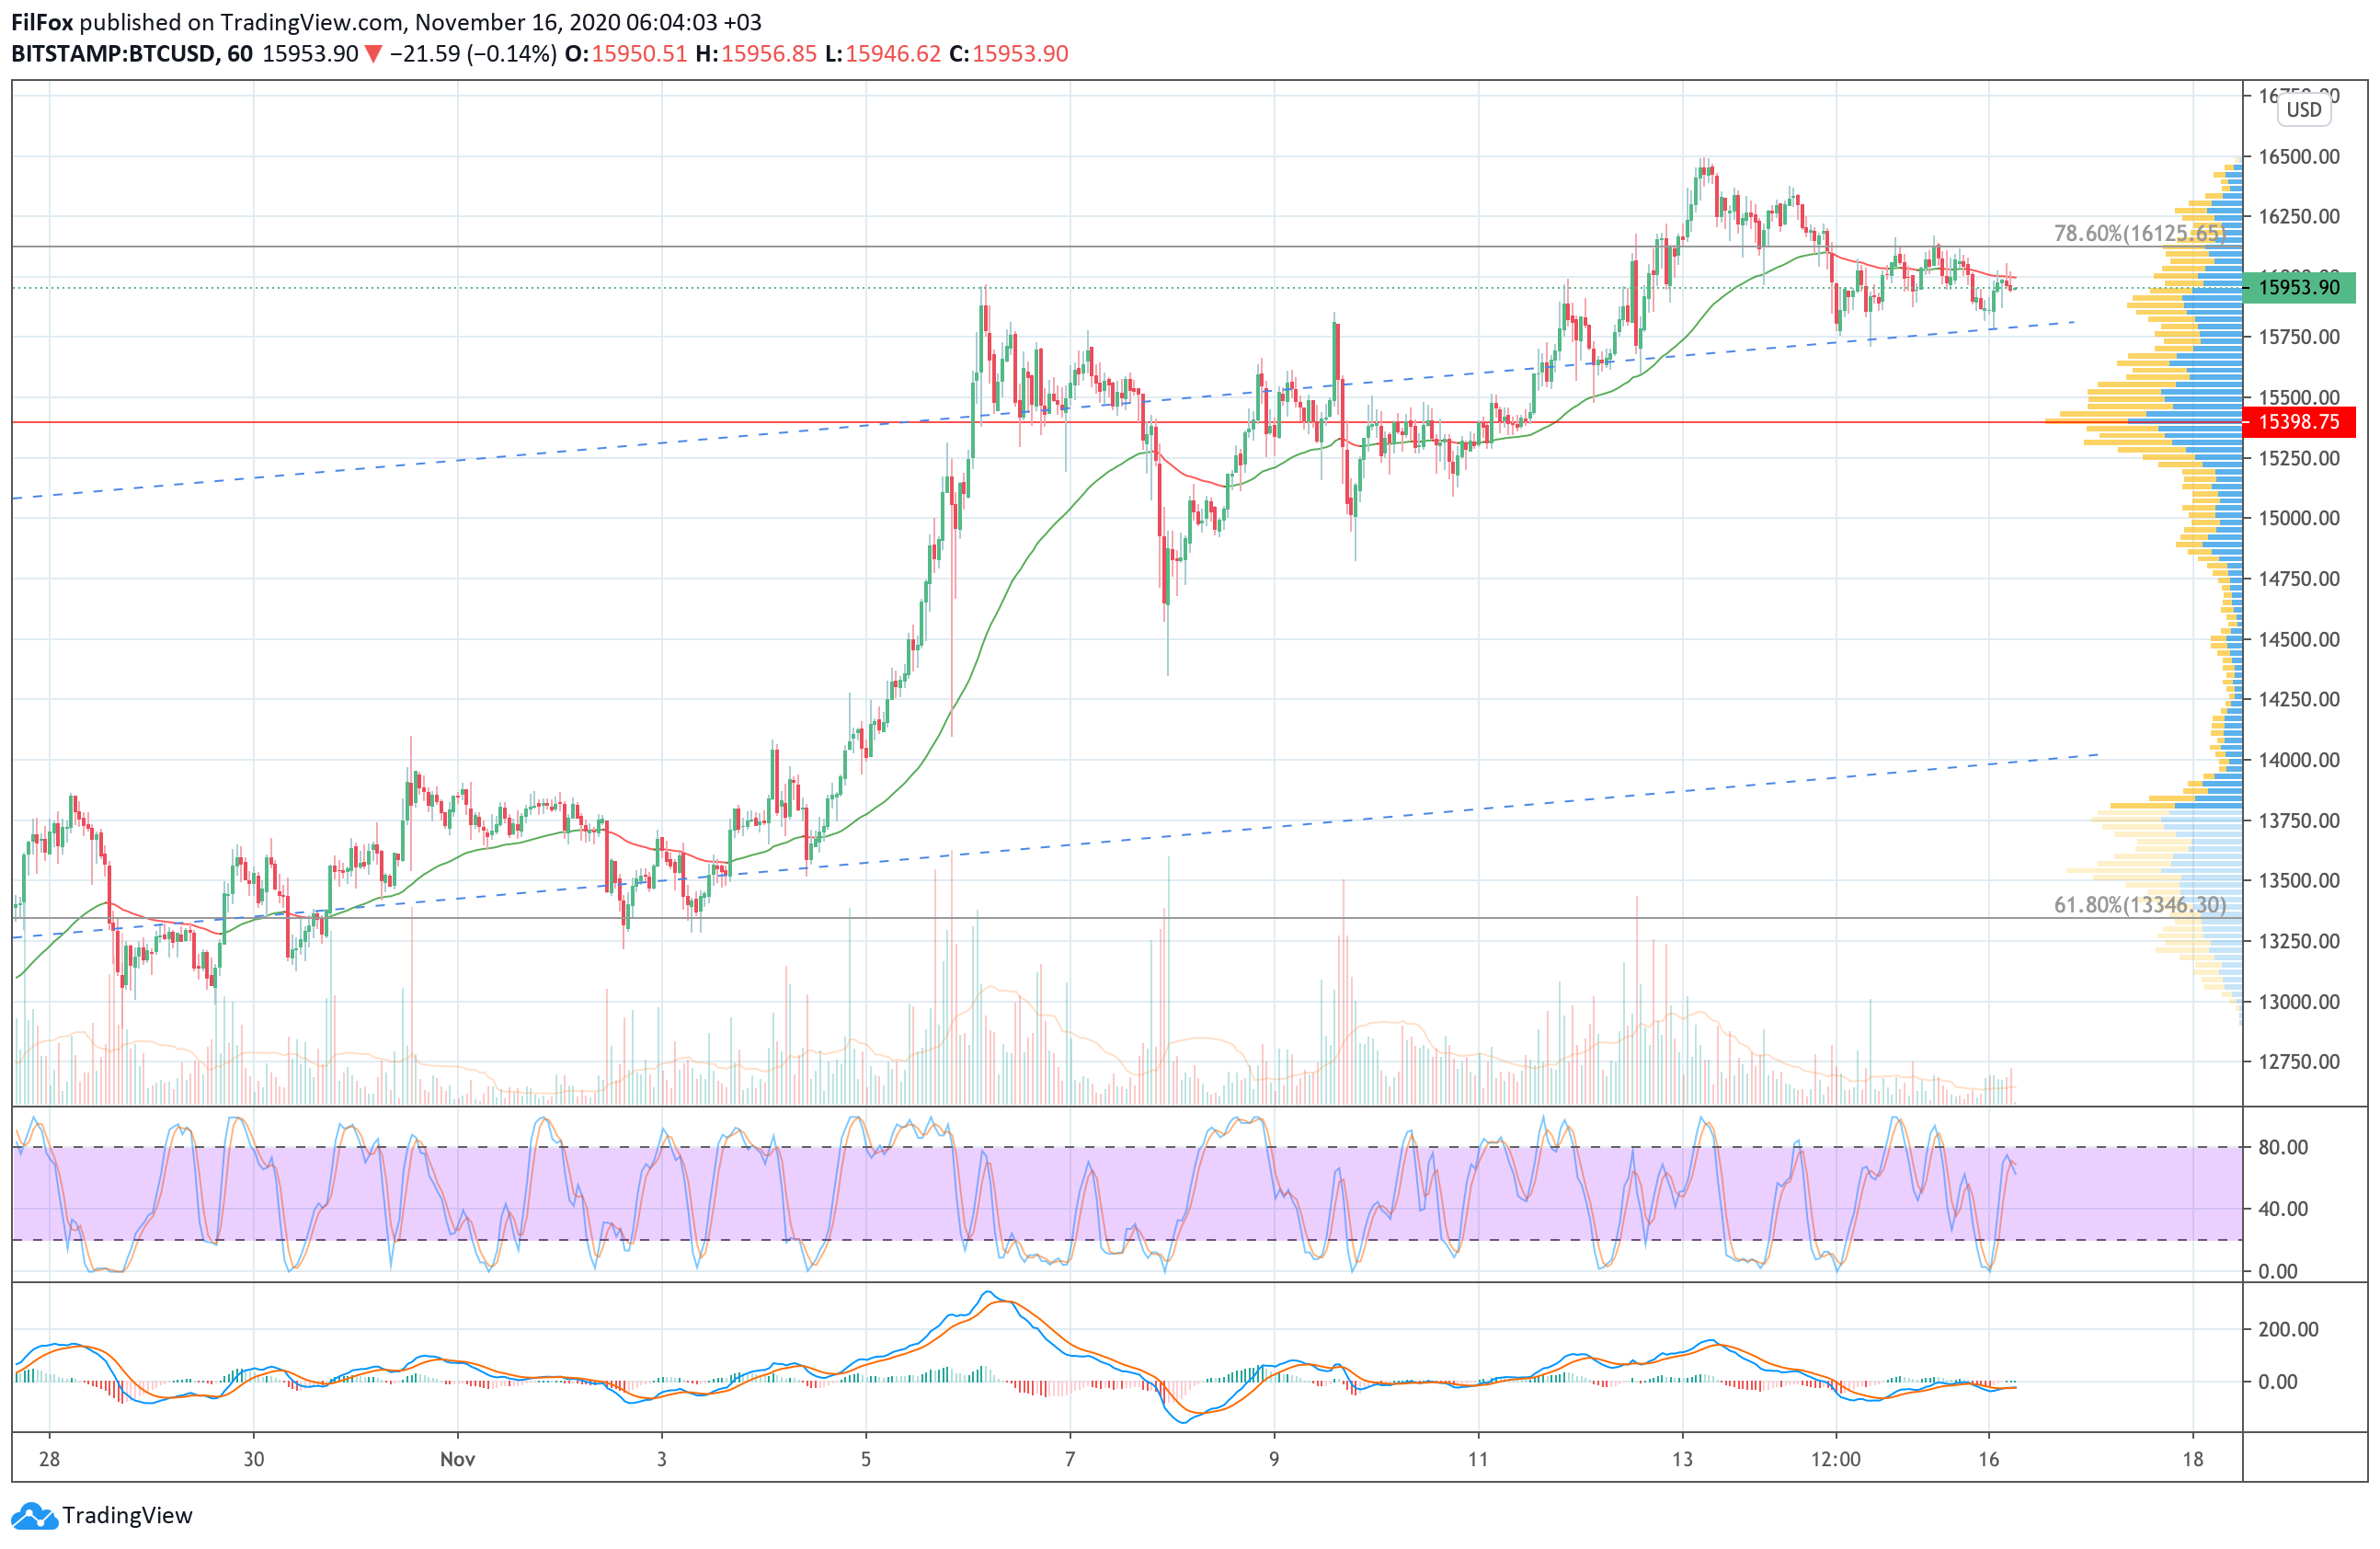
Last Saturday, the bears pushed through the hourly EMA55 and the price of Bitcoin rolled back to the upper border of the ascending blue channel.
On Sunday, buyers tried to restorea couple, but all attempts to return the price above the 78.6% fib level (16125.65 USD) were unsuccessful – By the end of the week, the price again tested the upper border of the blue corridor. This rising trend line has kept the pair from falling further for now, but tonight buyers were unable to restore the pair above the hourly moving average EMA55.
If the bears break through the support of the blue linetrend, then the price will roll back, at least, to the POC line (15398.75 USD). In case of a strong bearish impulse, a retest of the lower border of the ascending channel is possible, and this is already the level of 14000.00 USD.
ETH / USD
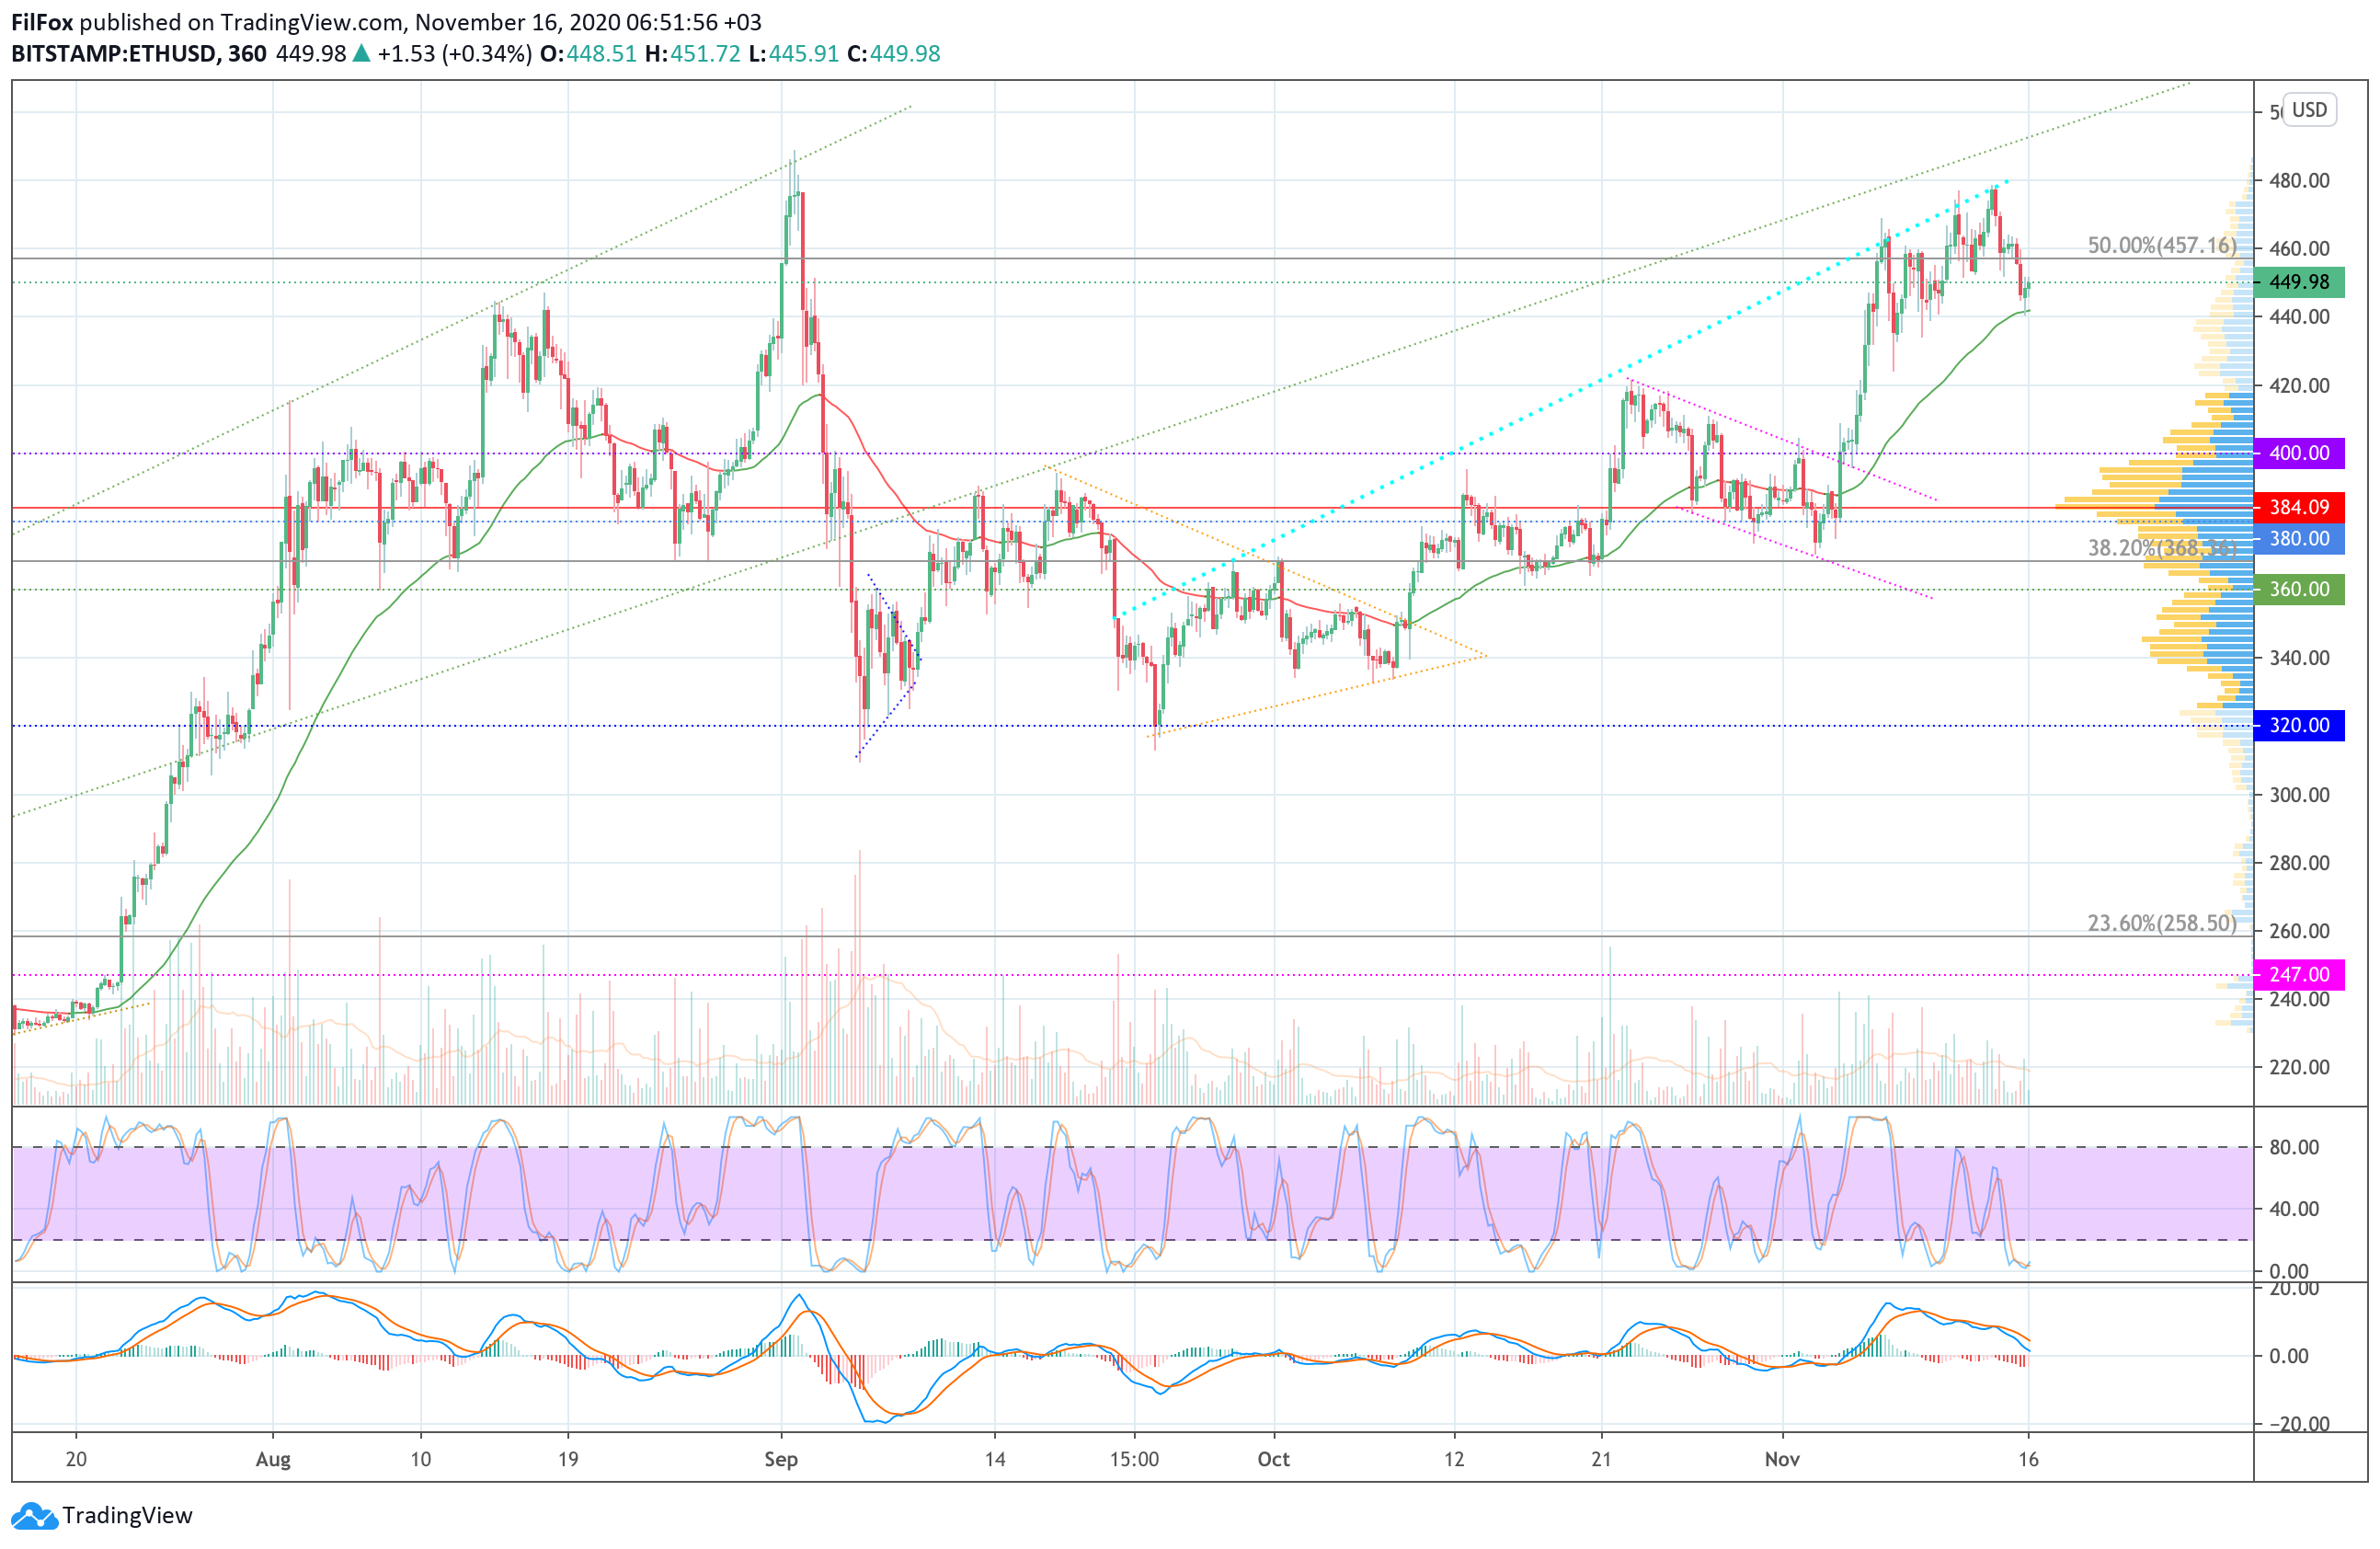
On Saturday, the price of Ethereum fell back to 50%fibo (457.16 USD) and until Sunday remained in a narrow consolidation above it. Yesterday, sellers were able to break through the support of the fifty percent Fibonacci level, and the decline continued to the area of the six-hour EMA55 (440.00 USD).
If the bears increase their pressure, the pair will roll back to the psychological level of 400.00 USD.
XRP / USD
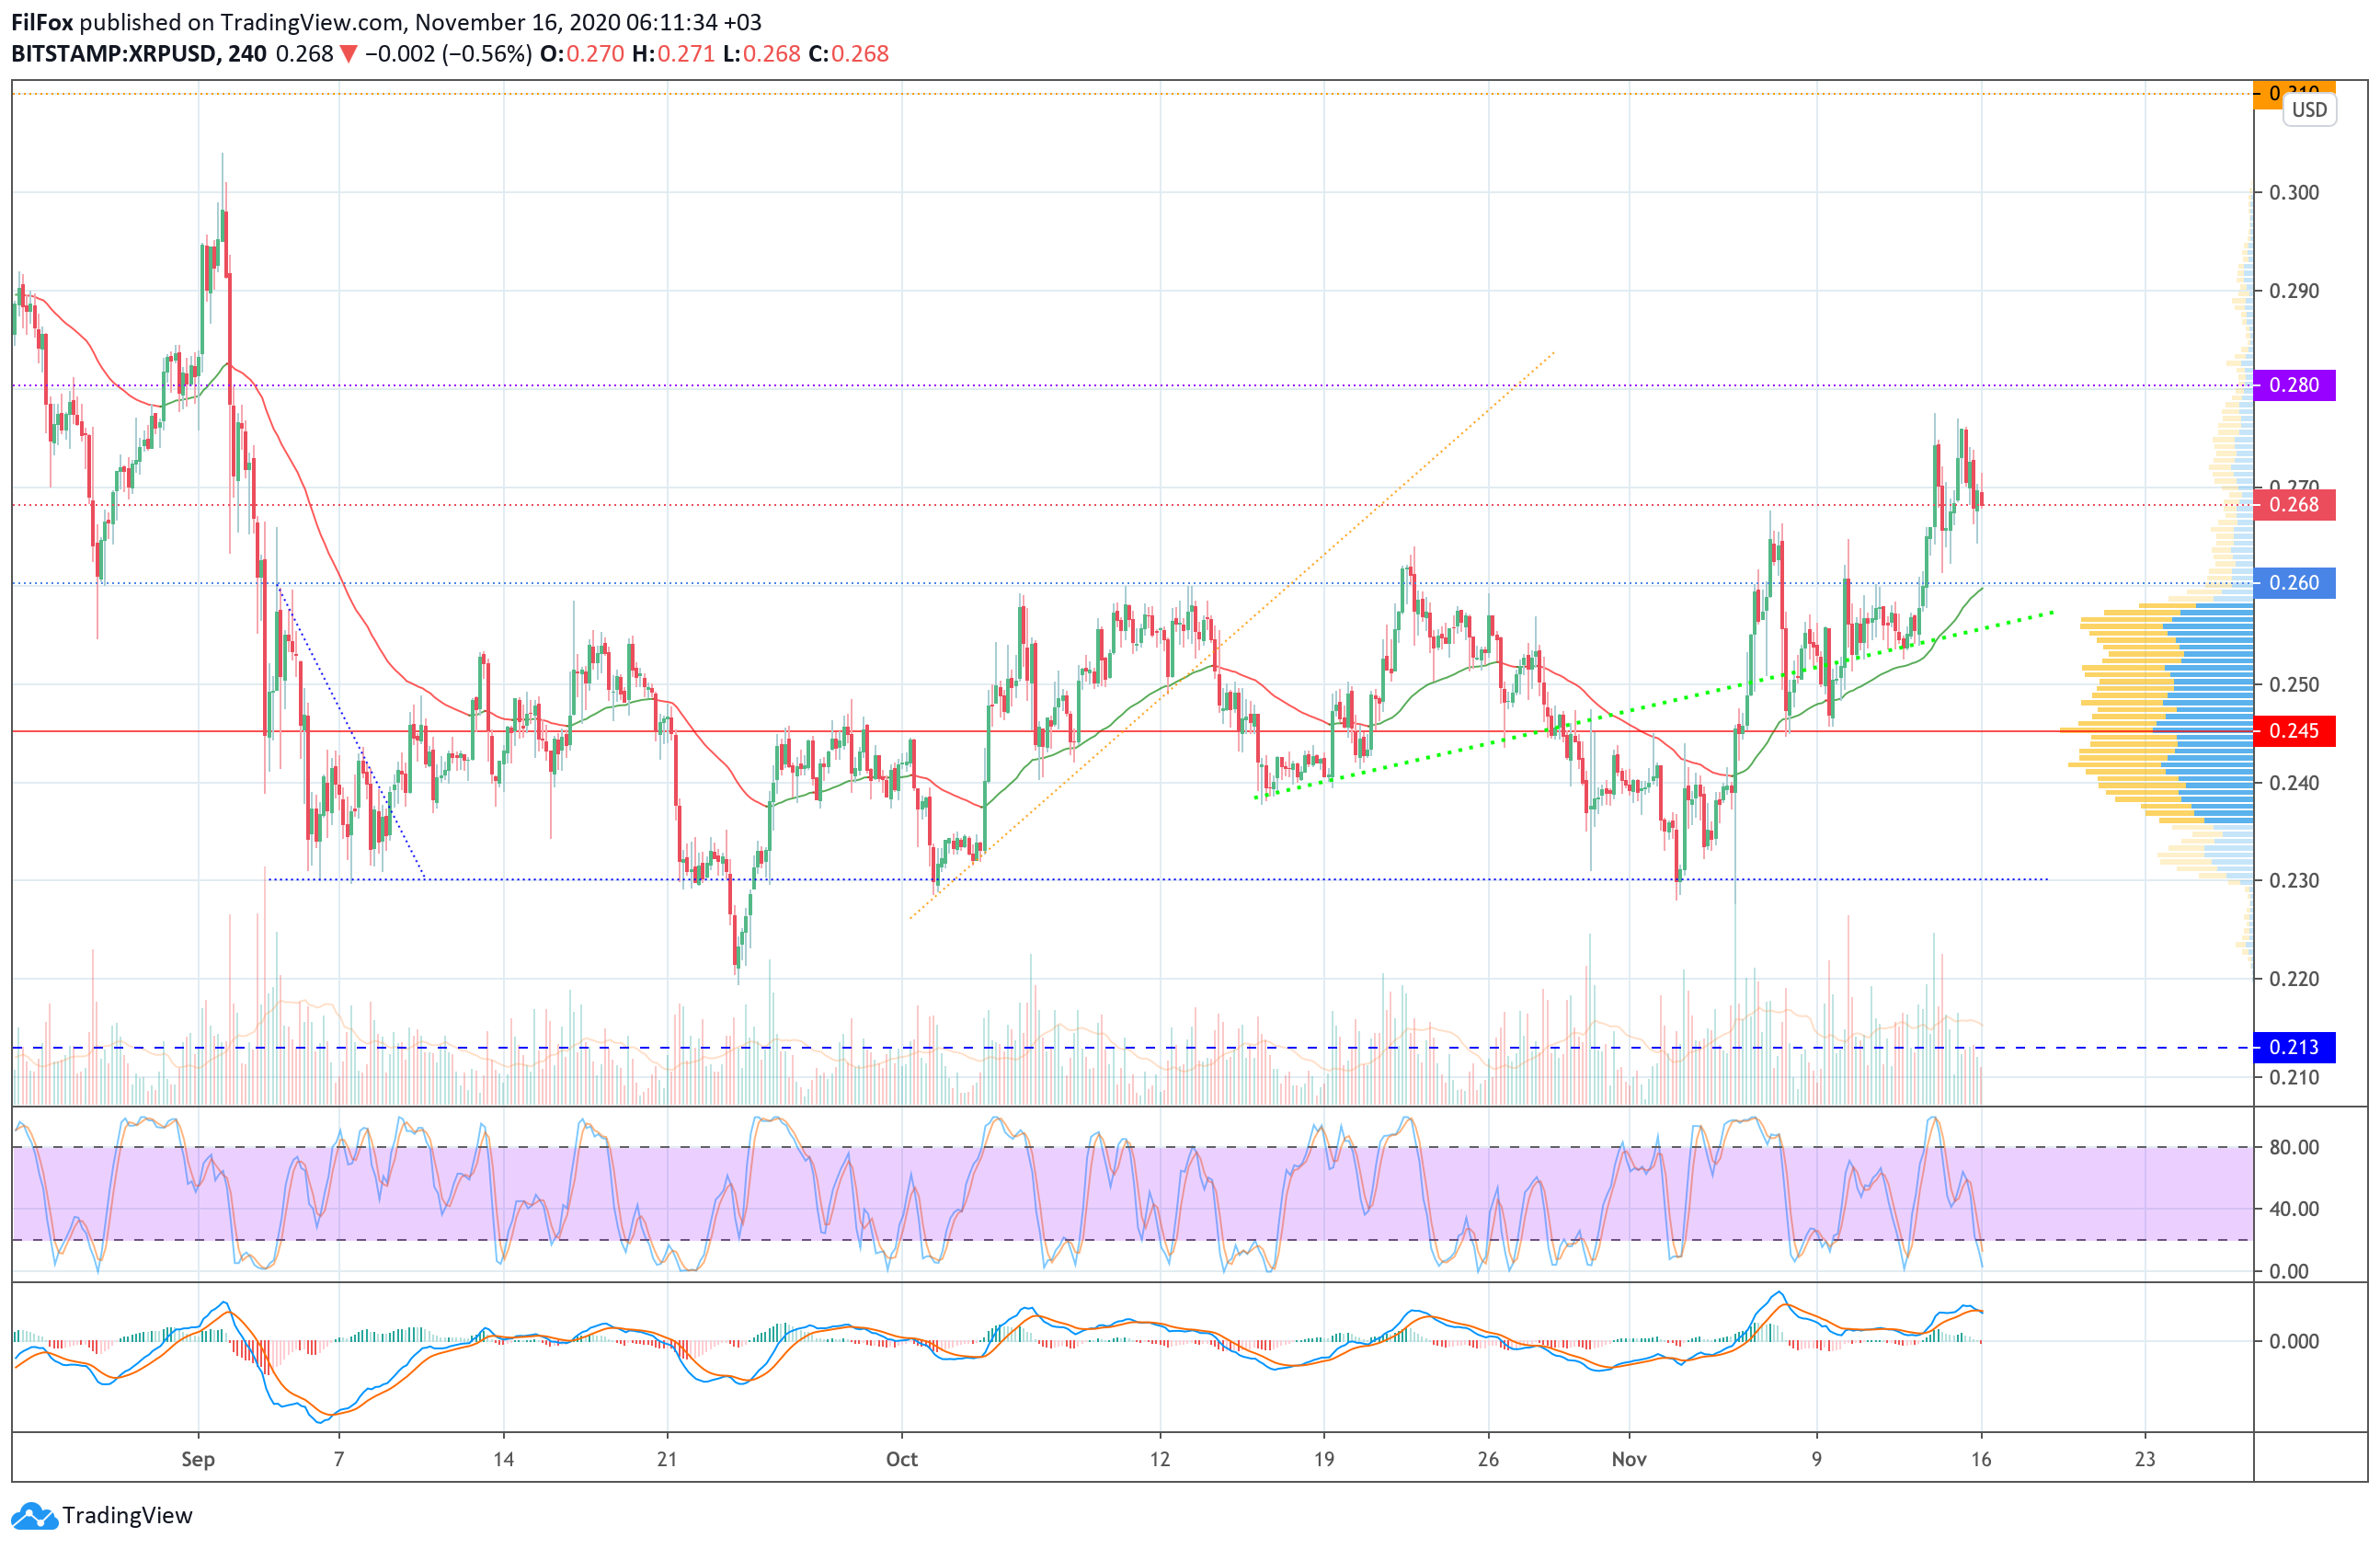
Last weekend, Ripple price failedcontinue to grow above the local maximum of 0.278 USD. On Saturday, the bears tried to return the price to a wide two-month sideways corridor, but buyers were able to hold the pair above its upper limit of 0.260 USD.
On the daily time frame, the Stoch RSI indicatorgoes off scale at around 100 in the overbought zone. The pair will be able to continue growing to the resistance area of 0.280 USD only with the support of large buyers.
A return to the sideways range and a re-test of the support of the green trend line looks more likely.
* All price values are based on data from the BitStamp exchange
Subscribe to ForkNews on Telegram


