Posted by Nick Bhatia from The Bitcoin Layer.Bitcoin's volatility never ceases to cause fear and awe among those whoThis is my first time encountering this market.Recent weeks have been no exception. Some new entrants to the market are understandably shaken, while veterans are probably excited to be able to buy BTC for under $30k, and quickly, as it may not last long.
Today I want to calm the prospectivenew investors, based on two metrics that I used to rely on both in crashes and when the market is euphoric: the 200-week moving average of the BTC price and bitcoin’s market value to realized value (MVRV ratio).
Let's start with 200 weeks. MA (frommoving average), which today is at a level slightly lower$22K This moving average has never fallen in the history of Bitcoin and the price rarely goes below it either. As can be seen in the graph, one such episode occurred, for example, at the beginning of the pandemic. From this alone, it can be understood that the move to $22 thousand is not something completely unexpected or out of the ordinary. It also suggests that this area should serve as a limit to the decline and reliable support for price.

Realized price is less intuitiveunderstandable to the uninitiated. This is the name of the average cost basis for all bitcoin investors, that is, it is the average price at which all existing UTXOs were last moved on-chain. This is another form of moving average, but instead of the average market price, it takes into account the price at the time each bitcoin moved on the blockchain, rather than the exchange rate. This stable indicator has also historically acted as a reliable support, which is rarely broken. The ratio between the market price and the realized price is also known as the MVRV ratio (green curve in the chart below). As you can see, MVRV is close to 1, which means that the market price and the realized price are almost on the same level.
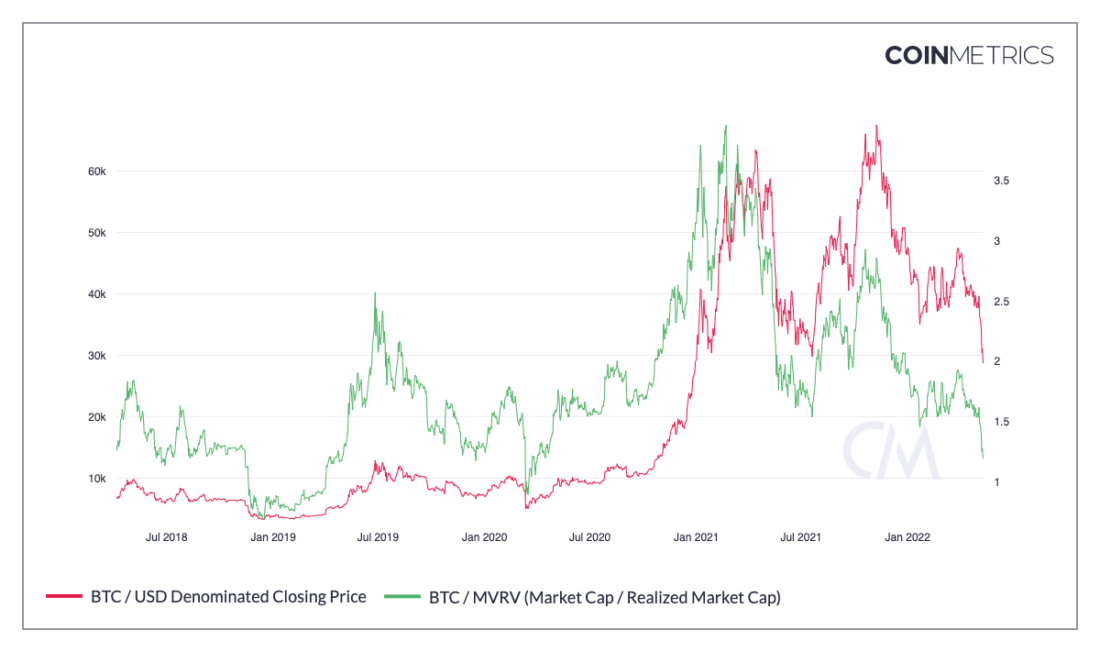
When there is a big difference between them,we get big price swings. Many, myself included, have predicted a softening or contraction of bitcoin's cyclicality stemming from halvings that occur every four years. Unfortunately, we can only confirm this thesis after the fact, so we are waiting for the next halving in 2024. Until then, you can use MVRV to determine the likely bottom when you can no longer be afraid.
I don't think finding the realized price(~$24 thousand) and 200-week. MA (~$22 thousand) is approximately at the same level - this is a coincidence. Somewhere around here, presumably, is the “fair value” of Bitcoin today. This is also why this area is so important from the point of view of the limit of price reduction.
The narrative must be derived from the price, and the currentThe narrative around Bitcoin is largely based on the fact that it is an asset that shows exponential growth over the long term. But if Bitcoin falls below $20K for an extended period of time, below 200-wk. moving average, realized price and the 2017 market peak - this will mean that something is broken. That's why these levels are so important: If $20k doesn't rebound, the narrative of an exponentially growing asset will be called into question. That is why panic begins around these areas.
And one last thing about BTC price:trend lines matter. The reason everyone pays so much attention to the big lows is to identify the level at which the uptrend breaks and ceases to exist. And I'm far from the only one who attaches importance to such parameters. Technical analysis works much like a self-fulfilling prophecy because all traders behaviorally react to each other.
ETHBTC Chart
This week we saw an altcoin withThe $40 billion capitalization (LUNA) literally evaporated, but crypto investors with a conservative allocation of 100% BTC would not have noticed. Some of the readers who have some amount of ETH in their portfolio may have wondered: what if Ethereum also dies, evaporates in a couple of days like LUNA? Let's take a look at the chart.
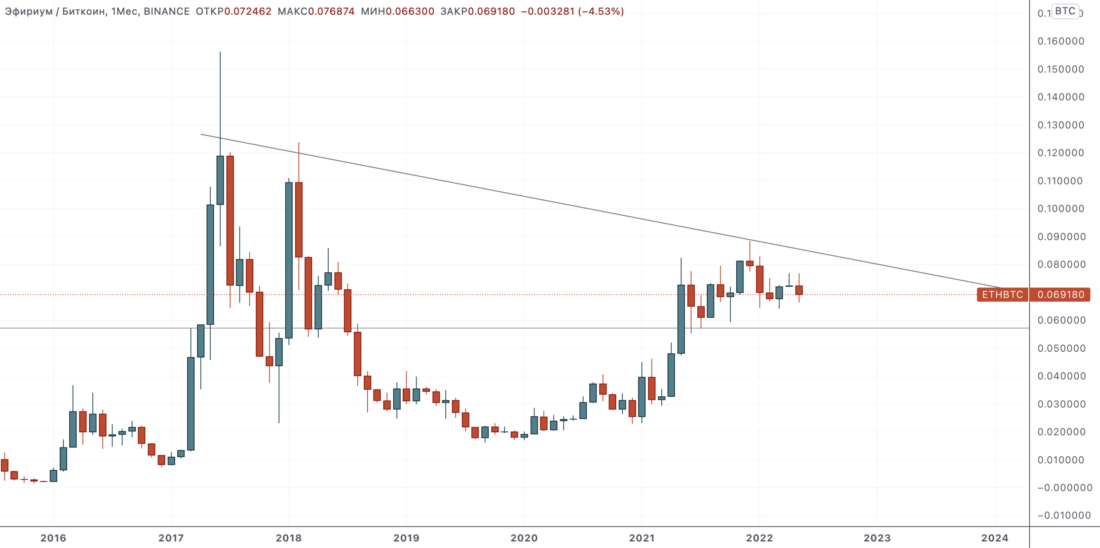
After an initial increase in relation tobitcoin in 2017, ETH/BTC failed to break that high in 2018 and then again failed to break the peak of 2018 in 2021. I don’t see a clear trend here despite the smaller highs: the price could stay in this range for many years, or the chart could break out, and bitcoin will face another challenge in terms of dominance in the crypto market. Or ETH/BTC could start to decline and return to deeper bearish territory. This chart matters for bitcoin because the narratives around Ethereum at least drew off a significant amount of capital that could otherwise have been directed to BTC. This is not to say that the future rise in the price of bitcoin depends in part on the relative decline in the price of ETH, but I cannot guarantee that this is not the case. On a closer look, the movement of the ETH / BTC price this week looked extremely weak and prompted me to even think about the likelihood of the death of Ethereum and how it could look like.
In Conclusion: About the Fed
With a 2-year yield of 2.6% and a rateWith federal funds still below 1%, the Fed should rush to raise rates before it faces pressure to pause due to the slowing economy. Stock market weakness doesn't seem to be stopping them, but the contraction in GDP could shift the focus and prompt the Fed to change its priority. The Fed is currently set to hike rates by another 50-75 bps on June 15th. To get an idea of how much room the Fed still has to raise, I watch the 2-year yield: if it falls significantly below the Fed's target rate hike, then the rate hike will stop. Now that the difference between the Fed rate and the 2-year yield is 175bps, the Fed still has quite a lot of room for further rate hikes. This should put pressure on risk assets, which as we all already know has a big impact on the price of BTC.
BitNews disclaim responsibility for anyinvestment recommendations that may be contained in this article. All the opinions expressed express exclusively the personal opinions of the author and the respondents. Any actions related to investments and trading on crypto markets involve the risk of losing the invested funds. Based on the data provided, you make investment decisions in a balanced, responsible manner and at your own risk.
</p>
Read this:
 Why is the rate of cryptocurrencies constantly changing?
 Bitcoin price returns to above $40,000
 Bitcoin Price Falls Below $ 7,500
Kraken CEO thinks bitcoin price could go up to $ 1 million in next 10 years
Bitcoin Price Falls Below $ 7,500
Kraken CEO thinks bitcoin price could go up to $ 1 million in next 10 years
 Bitcoin price crashes below $ 9,000 ahead of halving