Amazing chart from Morgan Stanley published by Financial Times sheds new light on Bitcoin and cryptocurrencyphenomenon. As usual, good data and good stories reinforce each other. The graph itself does not tell us why this or that happens, or does not fully tell what exactly is happening. Instead, it helps to understand which events in the real world were significant, and provides facts to support hypotheses, whether about the past or the future. The graph practically does not contain new data, however, their image in one place is very informative.
</p>Four Era of Bitcoin
In a relatively short history of cryptocurrencyfour distinct eras. The early amateur days lasted from the launch of Bitcoin in 2009 until the appearance of two iconic platforms: the Mt.Gox exchange and the Silk Road black market. In late 2013 and early 2014, when both platforms crashed, confusion was observed. Bitcoin's price has fallen from more than $ 1,000 to less than $ 300, where it mainly remained for two years.
In 2014-16. activity went beyond Bitcoin in two ways. Firstly, Ethereum and other platforms have generalized the digital currency of Bitcoin into a mechanism for decentralized applications and services. Secondly, enterprises and governments became interested in distributed registry systems, which added a permission level to the Bitcoin open network. These were the days of the “blockchain without Bitcoin”.
In 2017The pendulum swung again, and the price of Bitcoin and other cryptocurrencies suddenly began to skyrocket. Initial coin offerings (ICOs) and crypto asset trading have become increasingly popular. In December 2017, the price of Bitcoin briefly approached $20,000, and the total value of cryptocurrencies in circulation exceeded $800 billion. Millions of retail investors around the world invested, hoping for huge profits. The mobile client of the Coinbase exchange topped the download rankings in the Apple app store for some time.
Then in early 2018 there was a market correction.Bitcoin quickly fell to around $8,000. Regulators such as the US Securities and Exchange Commission began cracking down on fraudulent and illegal ICOs, while China and South Korea banned them altogether. The surprising thing here is not that the Bitcoin bubble burst. Unlike 2013, it did not burst. It deflated relatively evenly. The simple explanation is that cryptocurrency holders, convinced of the fundamental superiority of this form of money, will not stop holding them (or “hodling” in the jargon), while ordinary investors run for the exits, causing panic.
Now let's look at the chart.
What are Bitcoin trading against?
Asian markets still prevail, but pairs with other fiat currencies are also gaining momentum.
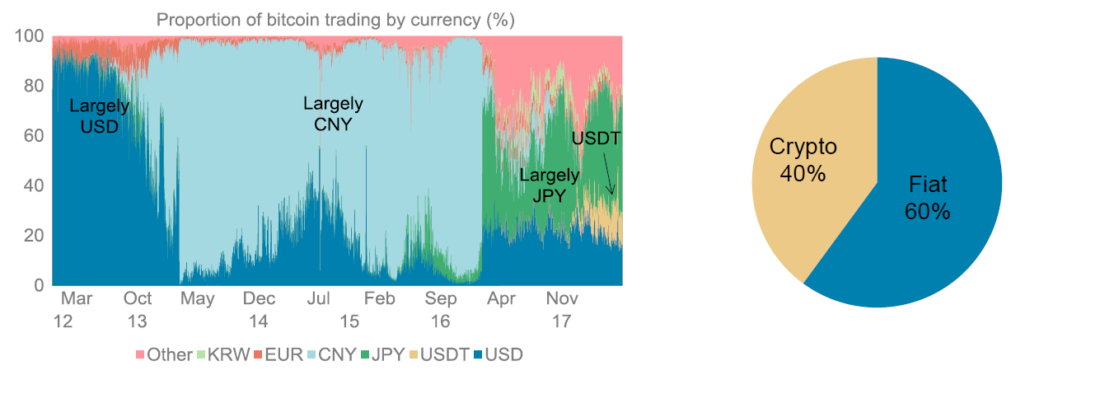
: Morgan Stanley
Remember, this is not a bitcoin price chart. It shows what Bitcoin sellers are exchanging for it. Nevertheless, all market shifts are visible here. In early 2014, with the death of Silk Road and especially Mt.Gox, which at the peak accounted for about 80% of the Bitcoin exchange market, the market flew down a cliff. This we know. But the Morgan Stanley graph clearly shows where all the activity has gone: to China (CNY is the Chinese currency, the yuan). From mid-2013 to mid-2014, China grew rapidly from a negligible share of bitcoin trading to almost the entire market. There are several possible explanations for this. Perhaps the volume of bitcoin / yuan jumped up as a percentage when the volume of bitcoin / dollar collapsed, while in absolute terms it did not change. Perhaps this is due to the dominance of China in mining Bitcoin, which increased during this period. Miners earn newly mined bitcoins, which they often sell. Or, perhaps, something provoked the intensification of trading activity with bitcoin in China. More data is needed to answer this question.
Thus, the period 2014-16.when the price of bitcoin was depressed and new blockchains and distributed ledger technology (DLT) platforms appeared, at the same time was the era of Chinese hegemony in Bitcoin. The strange thing is that the Chinese authorities during this period did not particularly welcome the spread of cryptocurrency. They tightened nuts, forbidding banks to conduct transactions with bitcoin. Publications of that period noted this paradox, but could not explain it. There are two possible explanations. Either the Chinese authorities did not realize or did not attach importance to the fact that now there is a zero mark for Bitcoin at a critical period of its development, because activity was small and not related to the official financial system, or they wanted everything to be so, if only too much currency did not leave the country or was not used for fraud.
Then in the spring of 2016. there was another significant shift displayed on the chart. In one night, the Bitcoin market jumped over the Sea of Japan. The Japanese yen has turned from a secondary one into the largest trading pair of bitcoin - and, apparently, it retains this status to this day. In this case, the event that triggered this is not difficult to determine. In March 2016, the Japanese cabinet approved bills declaring bitcoin and other cryptocurrencies legal forms of money and recognizing cryptocurrency exchanges as subjects of regulation. The prospects for the unequivocal resolution of cryptocurrency transactions by the neighboring global financial center in comparison with their quasi-illegal status in China were clearly convincing. In mid-2017, China banned exchanges from trading bitcoin / yuan, but, as can be seen from the chart, the market had completely shifted by that time.
Oddly enough, the greatest bull market in historyBitcoin looks relatively stable on Morgan Stanley's chart, with the yen still as the dominant trading pair. And when a reversal occurred on the Bitcoin market in 2018, there was no sudden phase transition, as in 2014 or 2016. Instead, there are two less dramatic, but very visible, trends. The first is the growth of “other” currencies, which sometimes account for no less market share than the yen. This is not indicated on the chart, but it is almost certainly other cryptocurrencies, not fiat currencies issued by governments. The graph on the right shows that today this category accounts for 40% of all cryptocurrency transactions. In 2017, this represented an increase in ICOs that predominantly accepted bitcoins or ethers in exchange for their newly created tokens. The percentage of ICO transactions fell at the beginning of 2018, according to the schedule, but then stabilized, which is consistent with ICO activity data. It seems that the big mover of the bull market in bitcoin was not Bitcoin itself, but people who bought bitcoins and ethers to access other tokens.
Here we come to the last one for nowmarket stages. One question is why the price of Bitcoin fell. The second is why she didn’t fall even more. To answer the first question, we need to look at another chart recently published by the Financial Times based on data from cryptanalytic firm Chainalysis.
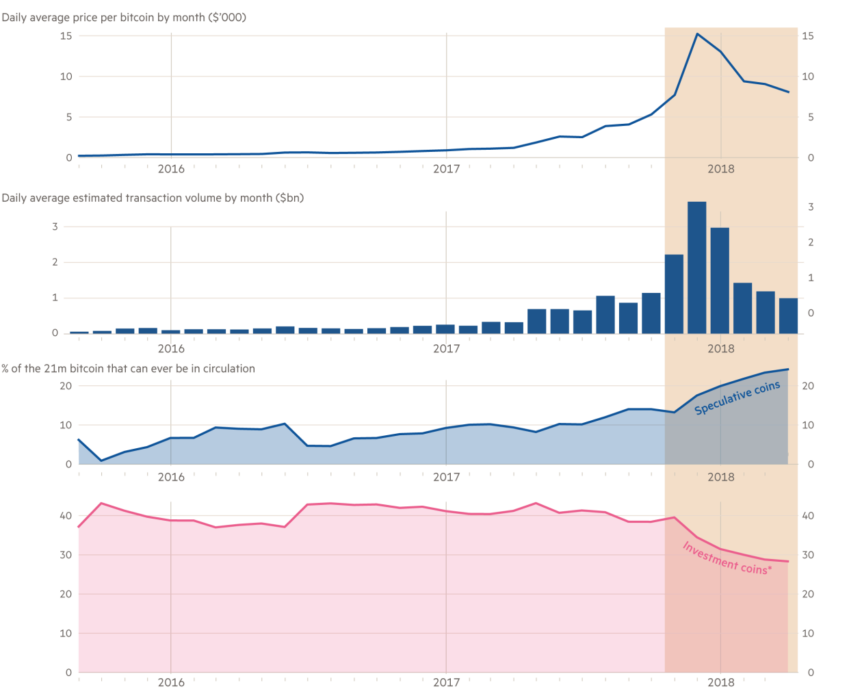
Bitcoin fever attracted new speculators and allowed early investors to cash out profits. : Chainalysis
In December 2017, long-term Bitcoin HODLers(indicated on the chart as “investment coins”)together they sold approximately $30 billion worth of Bitcoin to speculators. Such large sales in such a still small market by financial standards were bound to cause the price to collapse.
So why the price has not fallen even more? Partly due to the factor "go". Long-term investors sold a lot, but also left a lot for themselves, as shown in the lowest chart from Chainalysis. This is partly due to residual optimism regarding cryptocurrencies, the influx of institutional money into the crypto asset trade, and the conquest of bitcoin from gold as a basic “means of saving”, invulnerable to the state. But partly the case is in the last detail of the earlier chart from Morgan Stanley.

At the very end of 2017, the Tether cryptocurrency appeared on the Bitcoin trading scene.Tether is a stablecoin theoretically tied to the value of the American dollar.It is not entirely clear how currency is related tomajor cryptocurrency exchange Bitfinex. More than $2.5 billion worth of tethers were issued, supposedly backed 1:1 by US dollar reserves, although no one really believes this. Nevertheless, all these tethers have become a significant direction for the flow of Bitcoin. In effect, Tether is creating new buying pressure for Bitcoin. The money remains in cryptocurrency, since tethers are not actually convertible into dollars. Therefore, the impact of Bitcoin sales on the price is smoothed out.
Cryptocurrency stablecoin has valuable applications.Circle, a major cryptocurrency firm that is meticulous about compliance, has announced its intention to create something that looks suspiciously like Tether, only without all the shady elements.
However, for now, the fate of the Bitcoin market is determined byTether. Critics have identified numerous extremely questionable aspects of Tether that its proponents have never fully addressed. The announcement at the end of May 2018 that the US Department of Justice and the Commodity Futures Trading Commission were going to conduct a criminal investigation into cryptocurrency market manipulation could be a foreshadowing of a crackdown on Tether. Regardless of whether this happens, the next stage of development will likely be defined by the transition from a crypto-to-fiat market to a crypto-to-crypto market.
What will happen next?
It’s too early to say, and this analysis has noaim to give investment advice. But one lesson from Morgan Stanley’s schedule is that Bitcoin itself hasn’t changed too much over a decade in technical terms, while there have been tremendous shifts in its market. There is no reason to believe that in 2020 the situation will resemble the current one. The cryptocurrency industry is becoming more mature and, at certain points, is moving closer to the mature ecosystem of financial service companies. But not one way to read the Morgan Stanley chart points to a prevailing trend instead of sharp reversals. It is hard to imagine that volatility, one of the prevailing characteristics, disappear in the near future. And the graph also confirms that the main factor in the movement of the Bitcoin market is one that it should have avoided: political decisions of governments.
</p>Read this:
 Bitcoin hash growth ensured by the launch of 500,000 new ASIC miners
 Livermore's expanding wedge of accumulation
 Bitcoin's Way to a Means of Payment
Bitcoin Social Contract
graphical trading signals. lesson 2. task to determine 15 signals on the chart
Bitcoin's Way to a Means of Payment
Bitcoin Social Contract
graphical trading signals. lesson 2. task to determine 15 signals on the chart
 Privacy and Cryptocurrencies Part II: Bitcoin Wallets