Bitcoin failed to break $52K, making another downside move possible.
In the last few weeksBitcoin rally has slowed down, pricecorrected from a record high of $58 thousand to $43 thousand. Several arguments were found for such a short-term price rollback, including the sale of savings by miners and whales. Another important reason for the correction is the sudden increase in government yields. bonds.
The downward trend from $58 thousand is still in force
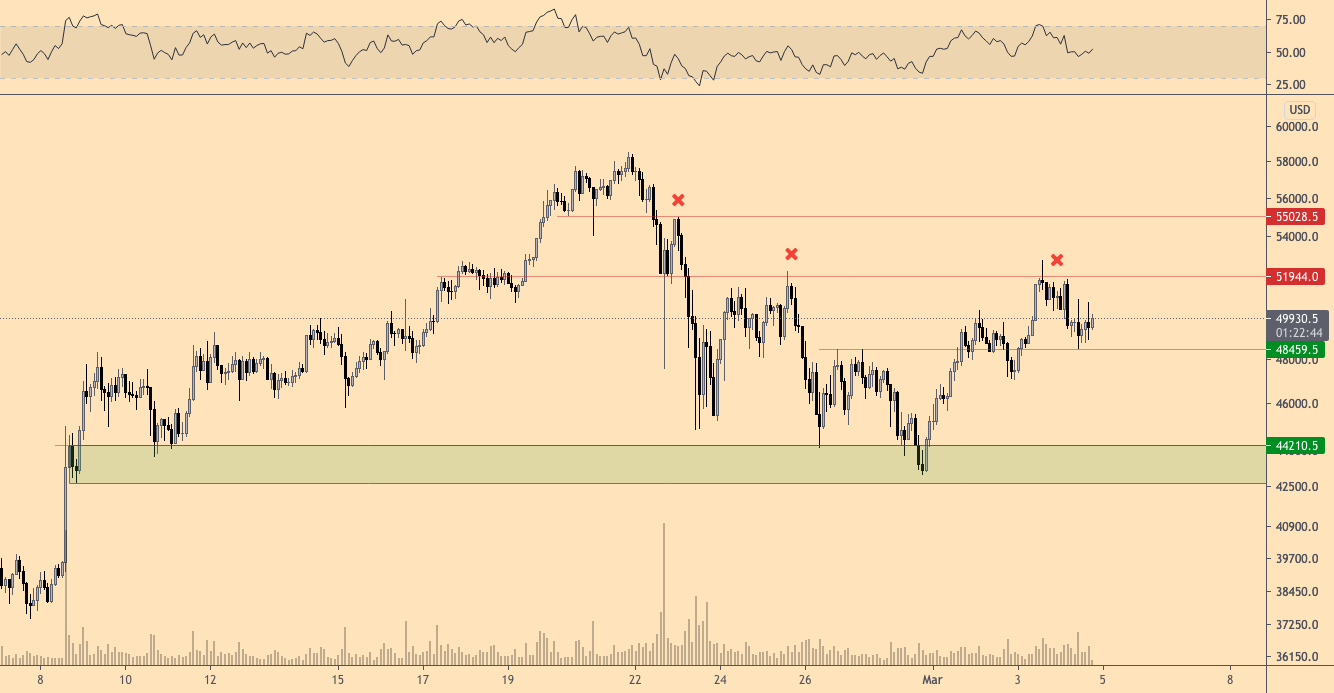
BTC/USD, 2-hour chart. :TradingView
Bitcoin's two-hour chart shows a cleardowntrend from the February high of $58K. Since then, bearish support/resistance flips continue to signal short-term market weakness.
This change from support to resistance occurred at the levels of $55 thousand and $52 thousand; the latter is also the closest resistance at the moment.
In recent days, the BTC price has tried to break through this resistance, but to no avail. After such an unsuccessful attempt, retesting the lower levels seems almost inevitable.
From this perspective, the critical support zone for Bitcoin is the $48.3-48.8K area. As long as this holds, it leaves room for a new test of the $52K resistance.
If it turns out to be broken, most likely, speechwill go about retesting the lower border of the range (green area on the chart). That is, it does not seem that the BTC correction is over yet. Also, historically March is not the best month for BTC, so much so that the current downturn shouldn't come as a surprise to anyone.
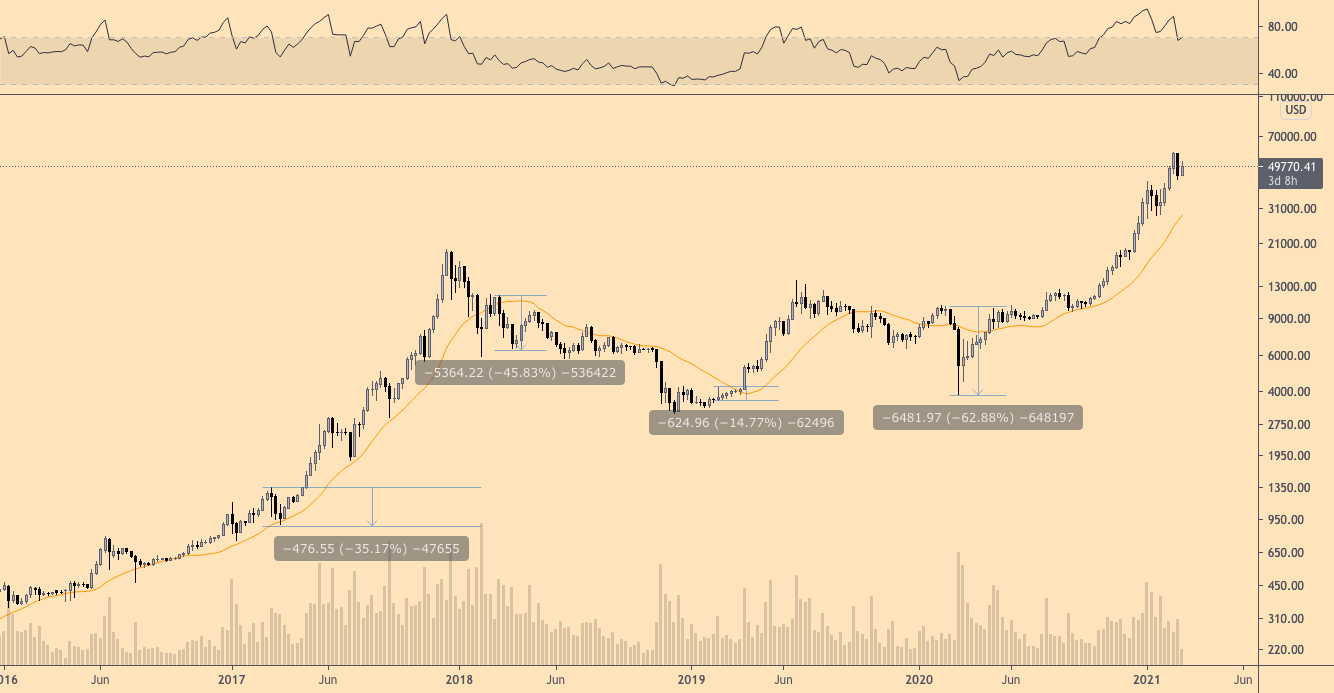
Historically March is a bad month for the crypto market
BTC/USD, 1-week chart. :TradingView
Bitcoin price weekly chart shows a clearupward trend. Therefore, short-term corrections should not be regarded as a signal of a reversal of the general trend. In every bull market, there are periods of consolidation and retracement needed to generate more strength for the next wave of growth.
Also, in Bitcoin bull cycles, 30-40% retracements occur frequently, and this should be borne in mind with the current decline.
Historically March is a terrible month for the crypto market.all recent years showing weakness during this period. For BTC, these corrections often end when the 21-week [simple] moving average (MA) is reached, which acts as a solid support. This is an important indicator for the bitcoin market.
As long as the price remains above the level21-week MA, continuation of the bullish trend is very likely. Today the 21-week MA is at ~$29K, but in a few weeks it will be at $33-35K. As long as Bitcoin remains above this ~$30K area and the 21-week MA, investors need not worry about the bull trend continuing.
Bond Yields Rise, Provoking Weakness in Markets
10-year Treasury yield, 1-week chart. :TradingView
The main reason for Bitcoin's current weakness andgold is shown on this chart. The 10-year Treasury yield reached its highest point in over a year. This circumstance is driving some investors out of assets such as Bitcoin and gold.
In addition to the steady growth in government yields. bonds, the dollar is also showing signs of recovery.
However, when the focus shifts tosome specific factor, often this means the end of the corresponding trend. In this case, the yield on Treasury bonds is testing the most important level, as a result of which a flip of support to resistance can be confirmed, and then the yield on bonds can again go down to the 1% level.
Any news from the Federal Reserve System may serve as a reason for this, but the drop in government yields. bonds will be a bullish signal for bitcoin and gold.
Important price levels for bitcoin
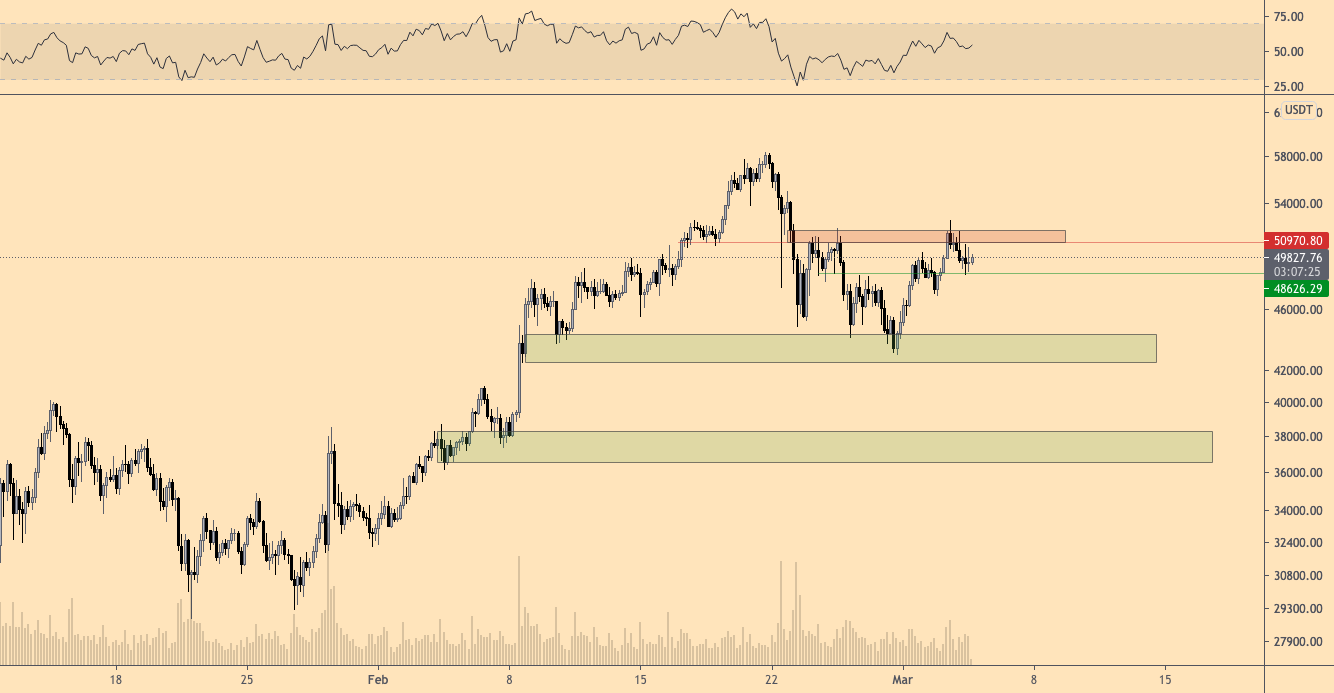
BTC/USDT, 4-hour chart. :TradingView
The most important, in my opinion, levels behind behaviorThe prices to watch are shown in the chart above. As long as the support of $48.3-48.8k remains, another retest of the $52k area remains likely. This is a critical level for further bullish momentum. A breakout of $52k would put the $55k resistance on the agenda and potentially set new highs.
If the $52k area holds as resistance, then a break below $48.5k seems likely. In this case, the next important support level is the $42-44k area.
Finally, the 21-week MA is the most important indicator that confirms the direction of the trend on the higher timeframes. As long as it works out as support, the bull market remains in effect.
The article does not contain investment recommendations,all the opinions expressed express exclusively the personal opinions of the author and the respondents. Any activity related to investing and trading in the markets carries risks. Make your own decisions responsibly and independently.
</p>
Read this:
 Factom project announces liquidation after unsuccessful attempt to raise funding
Unsuccessful attempt to break through $ 11,000 increases the likelihood of a pullback to the CME trading gap
Continuation of the sideways trend, combined with dwindling volumes, increases the likelihood of a pullback to $ 9100
Factom project announces liquidation after unsuccessful attempt to raise funding
Unsuccessful attempt to break through $ 11,000 increases the likelihood of a pullback to the CME trading gap
Continuation of the sideways trend, combined with dwindling volumes, increases the likelihood of a pullback to $ 9100
 A trader spoke about scenarios for the price of bitcoin after an attempt to storm $ 10,000
 Bitcoin exchange rate fell by $ 300 after a failed attempt to storm the level of $ 10 500
 A worrying look at the chart while waiting for the tuzemun: meme review of the week