Final review for August 2021 - on the state and prospects of the Bitcoin market and defining macroeconomicfactors.
Content
- Bitcoin's Founding "Technology of Continuous Growth"
- On-chain analytics
- Illiquid Supply and Exchange Balances
- Change in net position of Hodlers and HODL waves
- Bitcoin derivatives market
- Crypto Margin Futures
- Funding Rate for Perpetual Futures
- Bitcoin mining hashrate and difficulty
- Hash Ribbons indicator
- Macroeconomic background
- Consumer price inflation
- Asset inflation as a national security issue
- Triffin's paradox
- Fiat's latest hype
Onchain
The trend in on-chain data over the summer was clear: aggressive accumulation. We've covered this in detail over the past months, but this topic deserves further study.
Back to Basics: Supply and Demand
I decided to start this big report from the very basics.Bitcoin is unlike any asset or commodity the world has ever seen. Its supply is absolutely limited and new units are produced according to a predetermined schedule, with output being halved every four years (on average, but more precisely: every 210,000 blocks) until the subsidy per block is reduced to zero.
The chart below shows the emission graph and inflation rate of bitcoin:
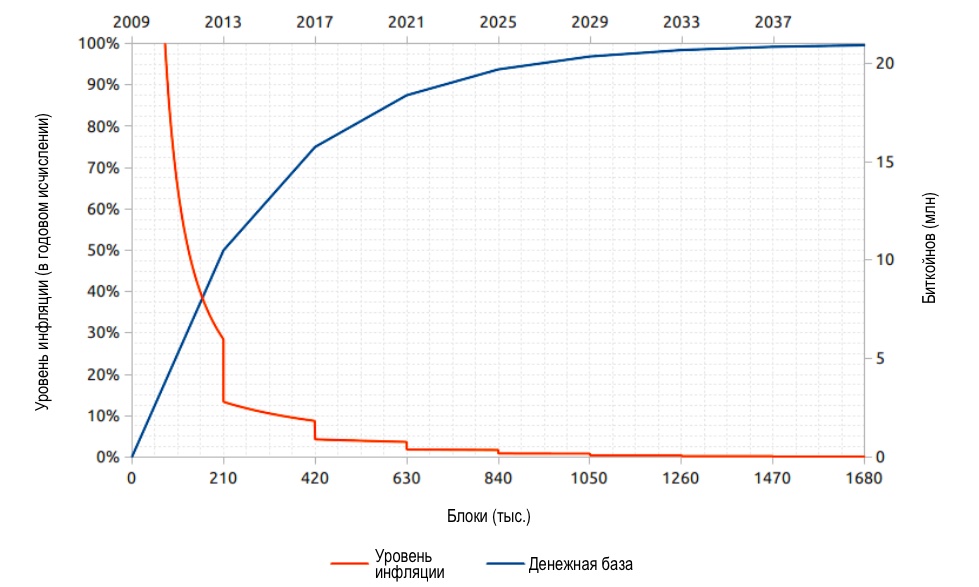
:bitcoinblockhalf.com
Above is the programmed emission schedulenew BTC and bitcoin inflation rate, and below is a historical graph of these indicators. Fluctuations in the inflation rate are caused by fluctuations and changes in the hash rate, depending on which the hashing complexity is automatically adjusted with an interval of about two weeks (technically, every 2016 blocks).
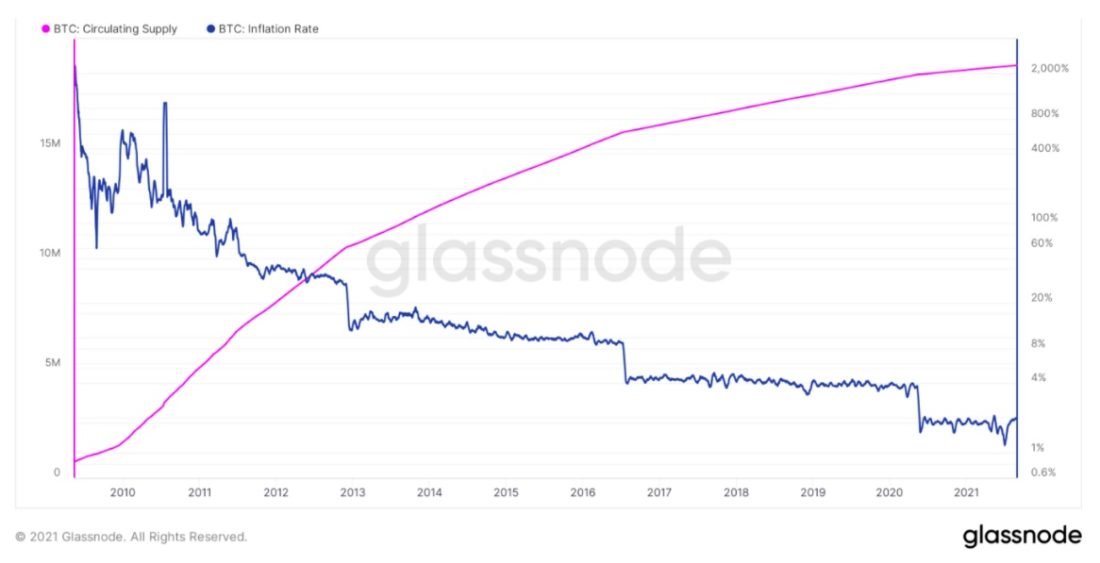
Bitcoin's circulating supply (pink curve) and annual inflation (blue curve)
Although most readers seem to be aware ofthat Bitcoin's supply is limited to 21 million units, I want to start today's big report with this because the value of a monetary asset with a completely inelastic supply, regardless of even demand, is enormous, and most people in the world have yet to realize it. Below is a simple diagram to help you understand the underlying technology of Bitcoin (Number-Go-Up), as many call it.
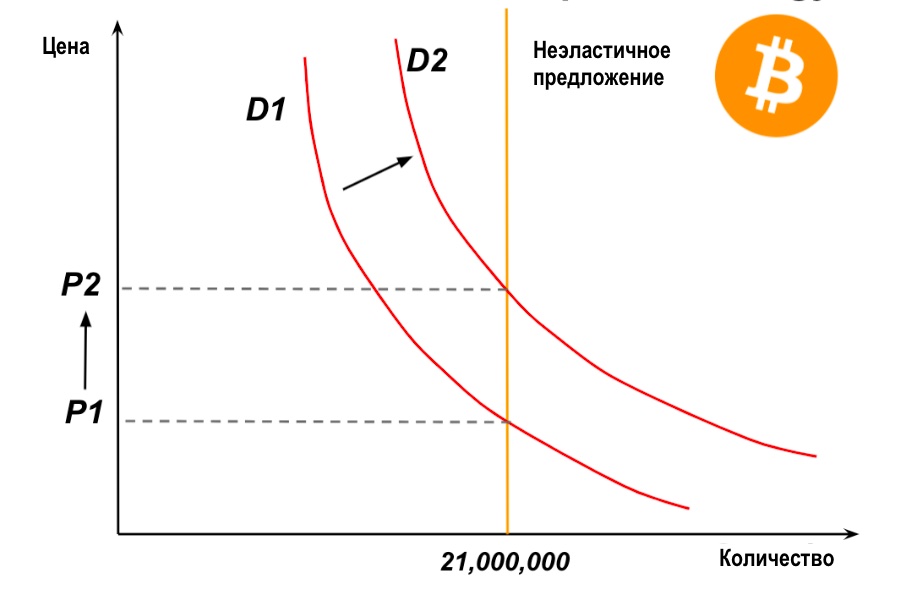
Bitcoin's "technology of constant growth"
“In this respect, the closest analogy isspend with precious metals. Instead of changing the issue volume in order to keep the price at the same level, the issue volume is set in advance, and the price changes freely.
As the number of users grows, so doesthe cost of BTC. This has the potential for a positive feedback loop: as the user base grows, the price of bitcoin rises, which could attract new users who want to capitalize on the rise in its price. "
— Satoshi NakamotoBitcoinTalk forum.
Surprisingly, Satoshi understood the built-inthe protocol went viral even before bitcoin first got its market price in February 2009. With absolutely inelastic supply, price is a function of demand, and the final inflation rate of an asset is 0%. This empirical economic reality has prompted individuals and companies around the world to feverishly stockpile the asset, eventually withdrawing more units from active circulation and reducing the supply available in the market.
Many are familiar with the short squeezes that occur periodically in the stock market, and the dynamics of supply and demand for bitcoin can be represented in a similar vein.
Every person in the world is in a race toto purchase as much of the 21,000,000 bitcoins (or 2.1 quadrillion satoshis) as possible, and the “short” or selling side in this analogy are the people who have yet to understand or accept these dynamics.
Illiquid offer
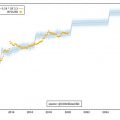
Over time, the volume of illiquid Bitcoin supply continues to grow, with occasional slight deviations from this trend (the latest happened today in May 2021).
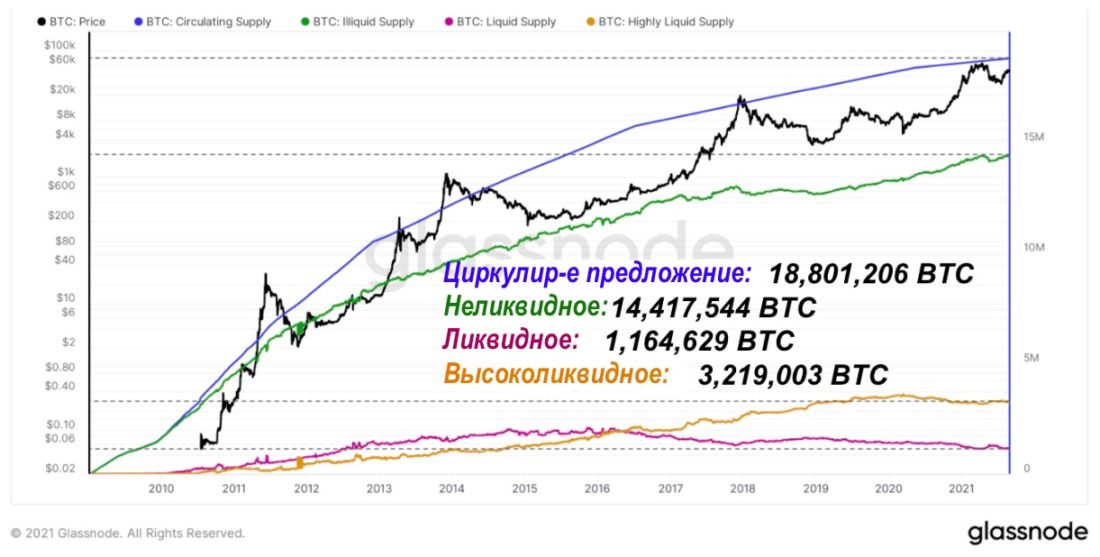
Bitcoin supply by liquidity cohorts
At the time of writing the report, the volume of circulatingBitcoin supply is ₿18,801,206, and ₿14,417,544 is classified as illiquid. The trend is clear, but also the relative relationship between illiquid supply and circulating supply has changed structurally over the last two years, and I think that makes a huge difference.
After the pandemic caused the collapse of world marketsin March 2020 and the consequent reaction to the event by governments and central banks around the world, the global financial and monetary landscape changed dramatically, with Bitcoin being the biggest beneficiary of these changes.
With a letter written a few days beforeLast Halving, legendary Wall Street investor Paul Tudor Jones published a report titled "The Great Monetary Inflation" (PDF), which outlined the growing case for investing in Bitcoin.
“We are witnessing the Great Monetary Inflation—an unprecedented expansion in the volume of all forms of money, the likes of which developed countries have never seen before.”
I have also made the case for investing inBitcoin as the quintessence of the scarcity premium. It is literally the only large tradable asset in the world to have a known fixed supply cap. The Bitcoin Protocol stipulates that the total supply of BTC cannot exceed 21 million. "
- Paul Tudor Jones.
The global macroeconomic landscape is constantlyis changing, and now a big structural shift has begun to take place in the illiquidity of the bitcoin market. Throughout the network's history, more and more supply has become illiquid, but the share of illiquid supply as a percentage of circulating supply has continued to decline over time as a result of the issuance of new "coins" paid to miners in the form of a block subsidy.
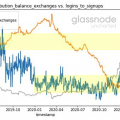
However, after March 2020 and the “great monetaryinflation ”, this trend has changed significantly. The first chart below shows the volume of illiquid supply and its percentage as a percentage, while the second shows the BTC balance on exchange addresses and the percentage of OTC supply of bitcoins in the total circulating supply.
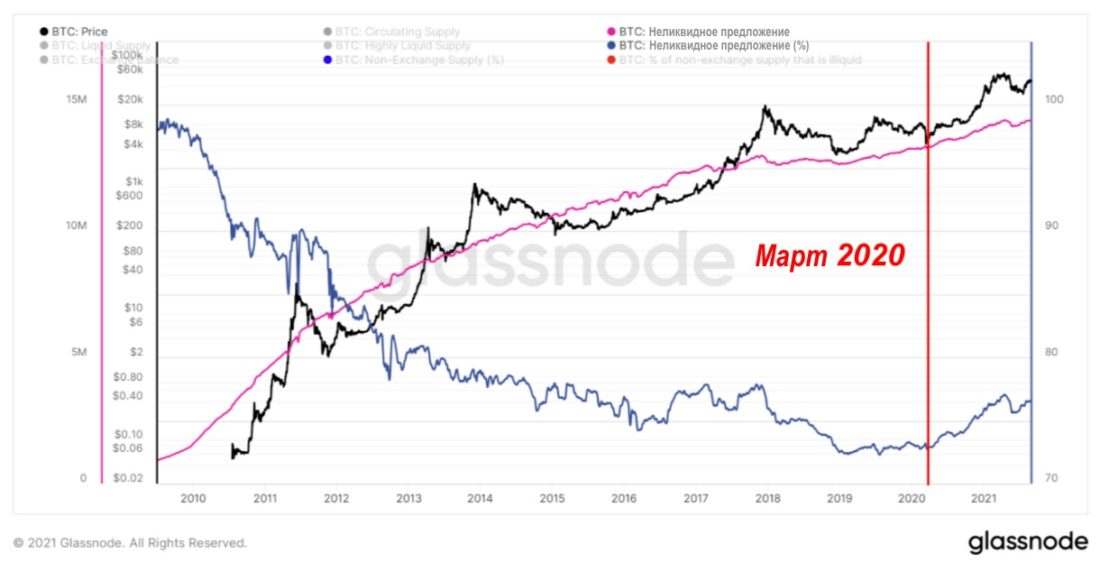
Bitcoin Illiquid Supply: Volume (pink curve) and percentage (blue)
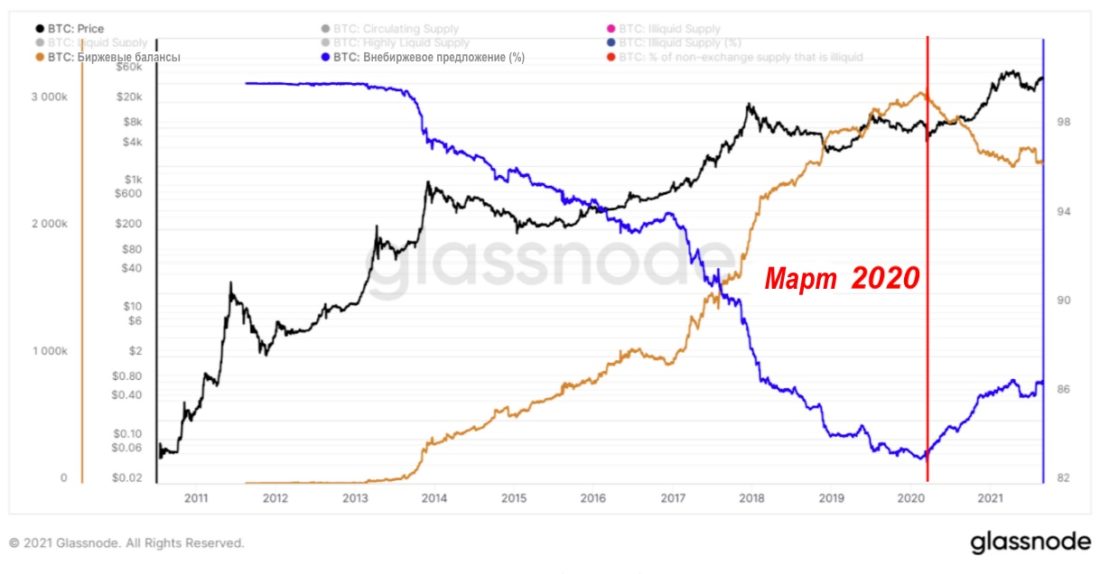
exchange balances and OTC offer (%)
Even more revealing is how the Illiquid Supply Percentage and OTC Offer Percentage graphs correlate with the BTC price chart from March 2020.
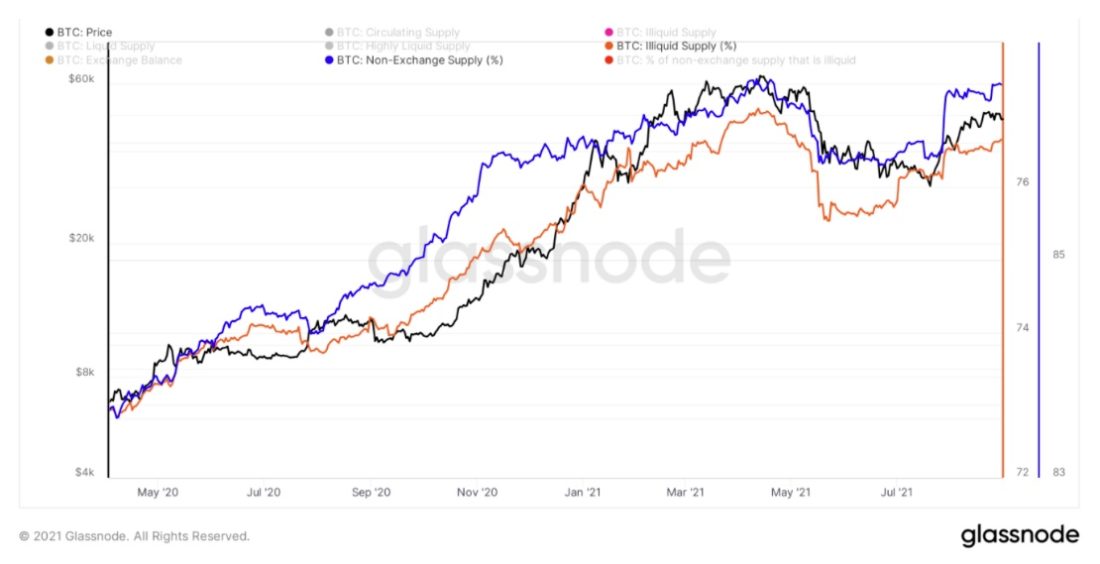
Bitcoin: Illiquid Supply (Red Curve) and OTC Supply Percentage (Blue)
Illiquid Supply Ratio and PercentageOTC offerings during this period were highly correlated with the price of BTC, and this relationship makes sense. We have touched on this issue in the materials that have come out in recent months.
Changing the net position of the hodlers
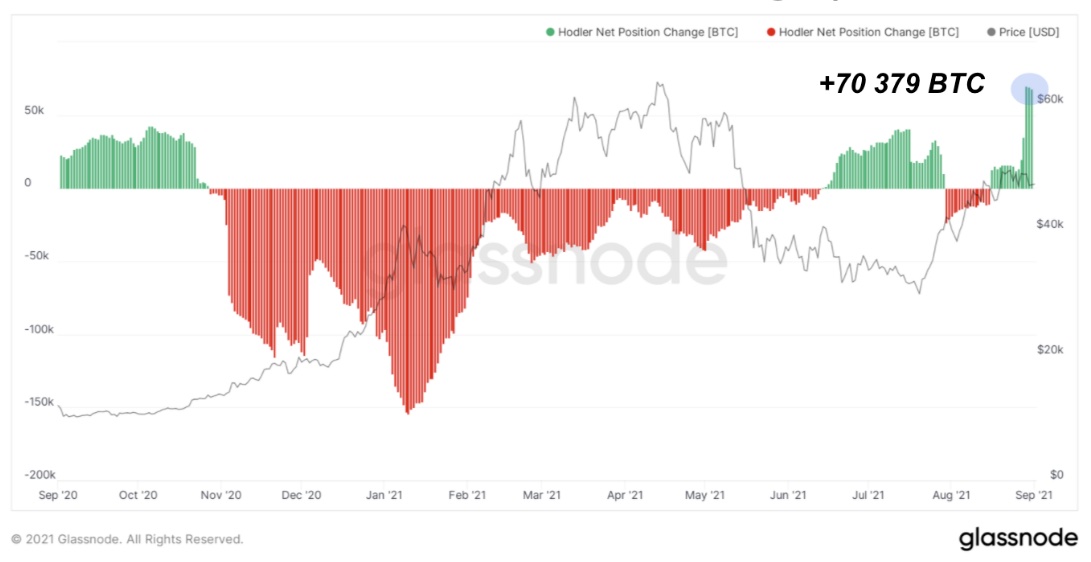
Bitcoin: Change in net hodler position (30 days)
Indicator of change in net position of hodlers,tracking net BTC buy / sell volume over the past 30 days clearly indicates strong accumulation. The metric, calculated as the difference between accumulated and destroyed coin-days, was first introduced by Adamant Capital in this introductory article.
Over the past 30 days, more than 70 thousand BTC have been accumulated, which confirms the supply compression signal read by other on-chain metrics.
HODL waves
Here are some more pieces of data to evaluatehow entrenched the hodling mindset is among bitcoin holders: 93% of BTC supply hasn't moved in the last month, 54% hasn't moved in the last year, and an incredible 35% haven't moved in the last three years, despite all the episodes of 50% drops and 1000% 1st rally from 2019 lows.
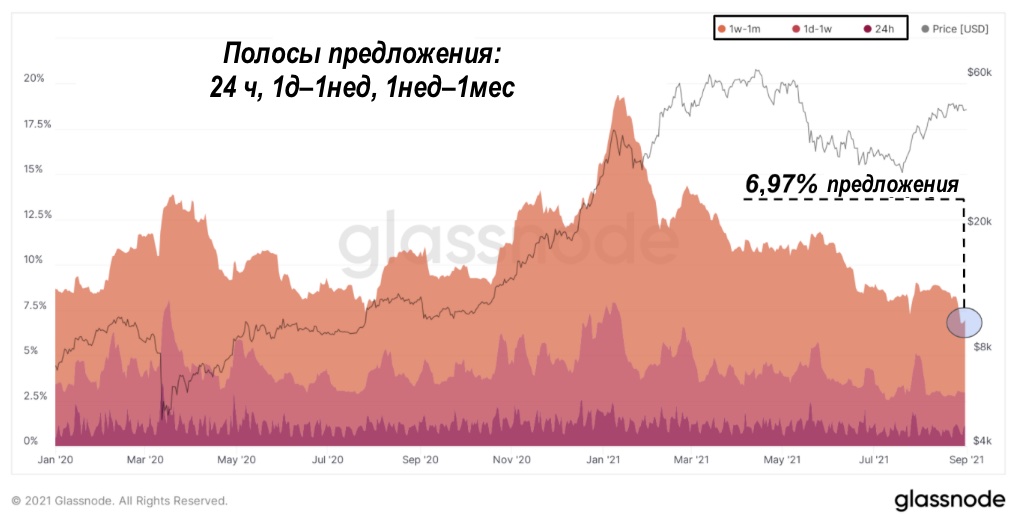
HODL waves: 93% of BTC hasn't moved in over a month
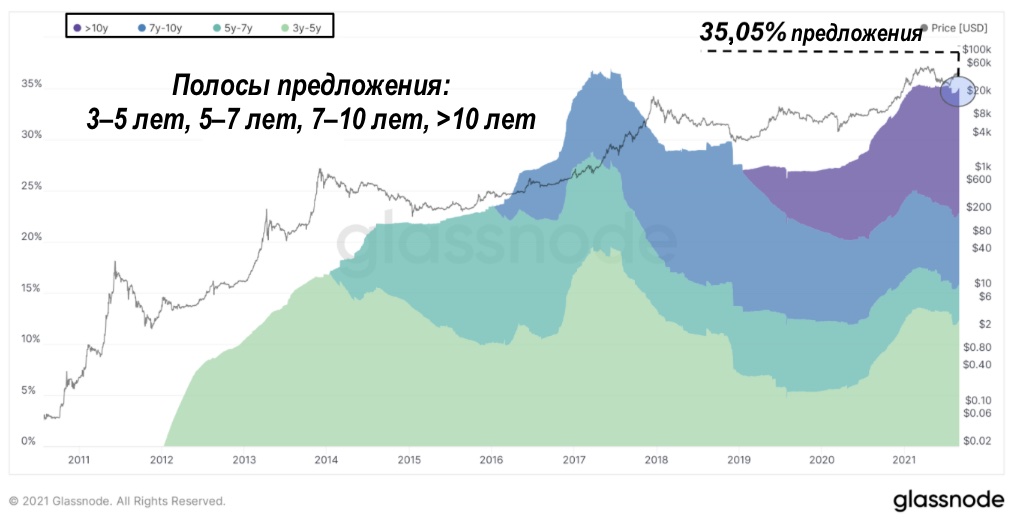
HODL waves: 35% of BTC haven't moved in over 3 years
What do all these on-chain metrics have in common?As it is probably clear by now, there is a strong contraction in supply versus demand, which coincides with external catalysts that are driving Bitcoin adoption at an unprecedented rate. The wall of money is trying to place itself in this market, but since most of the participants are not willing to sell, the situation can be resolved in only one way - due to a significant increase in the price of bitcoin.
We expect this trend to continue inthe future, albeit with some small deviations from the general trajectory. Thus, our point of view regarding price action and market positioning is quite simple: buy and hold, but not in such a way as to risk losing some or all of your position in episodes of short-term volatility due to inappropriate risk management and excessive leverage.
For most market participants, the besta simple dollar value averaging strategy with self-storing coins is presented. Reasonable unsecured debt at a low interest rate to increase market exposure may also be appropriate if such an option is available.
Bitcoin derivatives
The Bitcoin derivatives market landscape is constantis changing, and long-term investors may ignore it entirely, but for more experienced traders and speculators, the young derivatives market may offer opportunities to increase exposure and / or lower the average reference price - all in a meaningful way as the market periodically experiences severe imbalances.
The most obvious example is the decline in the share of open interest with margin in cryptocurrencies after the May liquidations.
On the day the maximum was set at $ 64,000.(Coinbase IPO day) 70% of the bitcoin futures market used bitcoin as collateral. This approach is fraught with a simultaneous PnL drawdown on the position and a reduction in the margin value.
At the beginning of 2021, open interest withBTC margin peaked at around 257k and was around ₿248K just before the May 19 crash, which saw open interest in Bitcoin-margined futures contract down by 31% (in BTC).
This, as well as the subsequent transition to a greater extentto derivatives with stablecoin margin means that the likelihood of another collapse in the derivatives market and a price collapse in the bitcoin market in the short term is much less likely.
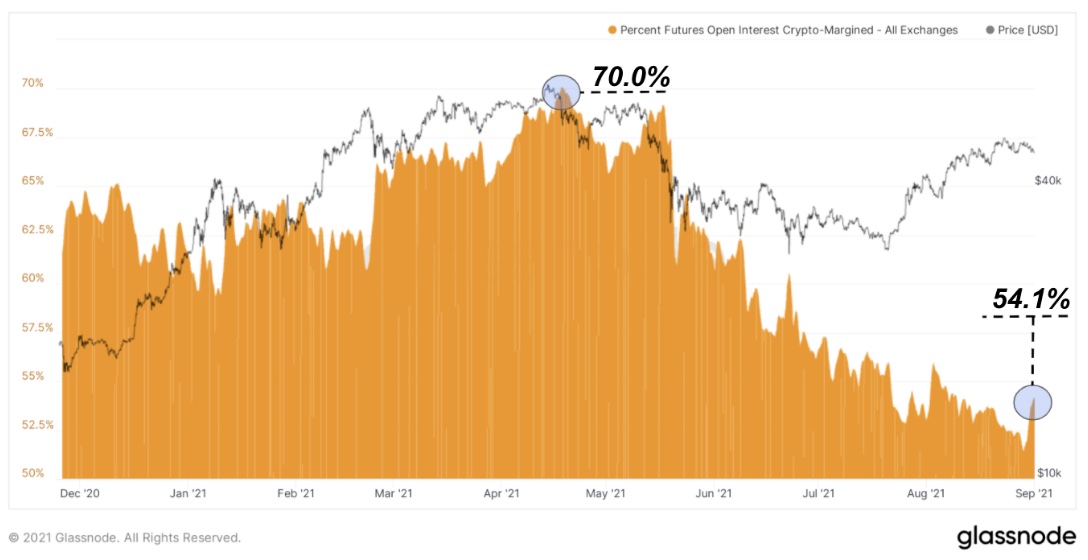
Percentage of Bitcoin Futures with Cryptocurrency Margin
And other things being equal, such dynamics isbullish in the sense that today's situation with BTC trading around $ 50K is completely different from when Bitcoin first hit that level in February this year.
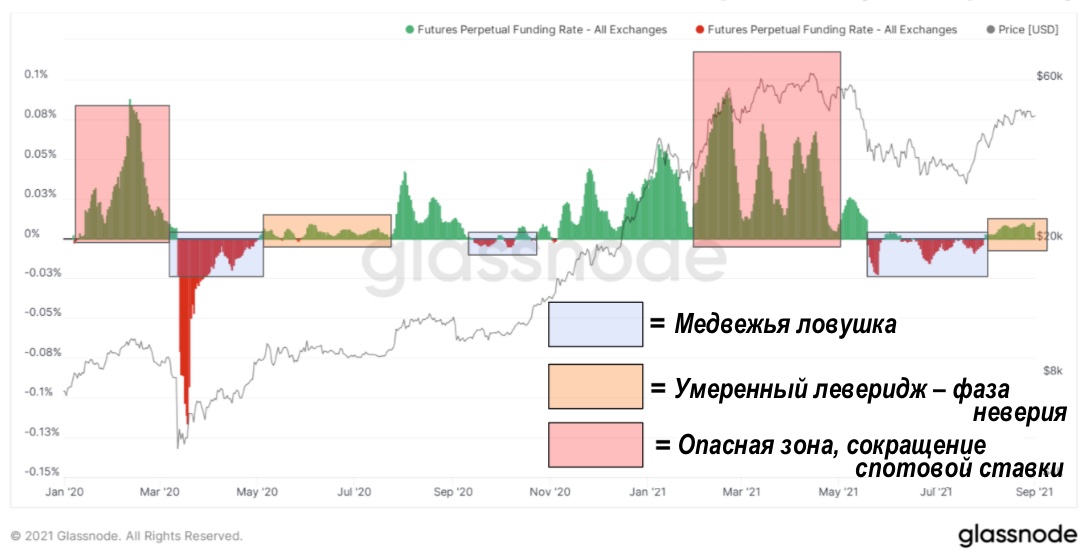
Perpetual Futures Funding Rate (7d MA)
Perpetual Futures Funding Rate - Moreone metric that can be used to gauge bullish / bearish sentiment and positioning in the derivatives market. From a very high perspective, Bitcoin, along with the well-known traditional four-year cycles, tends to go through boom and bust cycles driven by the derivatives market.
These cycles consist of the following stages:
- Building a permanent base of demand by committed stakers and hodlers.
- Displacement / Elimination of Shorts Opened Near the Bottom Formation Level.
- The influx of new money, waiting for the correction outside the market, the gradual spread of FOMO (loss of profits syndrome).
- A reflexive cycle of new demand, FOMO-syndrome and accumulation of longs on derivatives by hodlers and speculators in anticipation of parabolic growth.
- "It's different this time." Profit-taking by long-term holders creates pressure on the market, while bulls continue to build longs on derivatives.
- Long liquidation. Speculators, as well as inexperienced and poorly involved participants, leave the market.
- Convinced participants, aware of the inevitability of further adoption of Bitcoin, remain in the market and continue to accumulate and move BTC.
The cycle repeats over and over again until the onset of hyperbitcoinization.
Hashrate
Bitcoin hash rate since early Julyhas increased significantly: the 7-day moving average of hashrate at the time of writing is up 48% from its July lows. At the beginning of September, the hashrate is around 132 million Thesh/sec, after opening August at 111 million Thesh/sec.
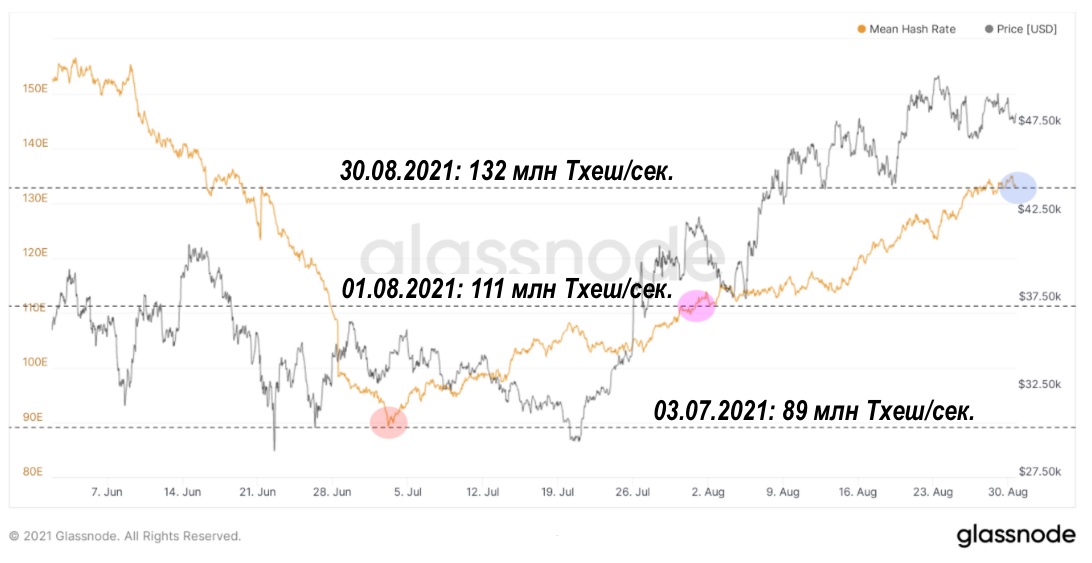
Average Bitcoin Hashrate (7d MA)
Aggressive hash rate recovery is especially encouraging given the scale of hashpower migration from China. Many industry players expected this recovery to take 8 to 12 months.
Mining difficulty
The recovery of the hash rate is undoubtedlyfacilitated by automatic difficulty adjustment, which aims to maintain a 10-minute interval between blocks to ensure stable network operation and stable release of a new proposal.
When the hashpower is disconnected from the network, the decreasehashing complexity makes mining more profitable; when blocks start entering the network faster than once every 10 minutes, increasing the hashing complexity restores the target interval between blocks. The last three difficulty adjustments were positive: on the last day of July + 6.03% and in August two adjustments were + 7.31% and + 13.24%, respectively.
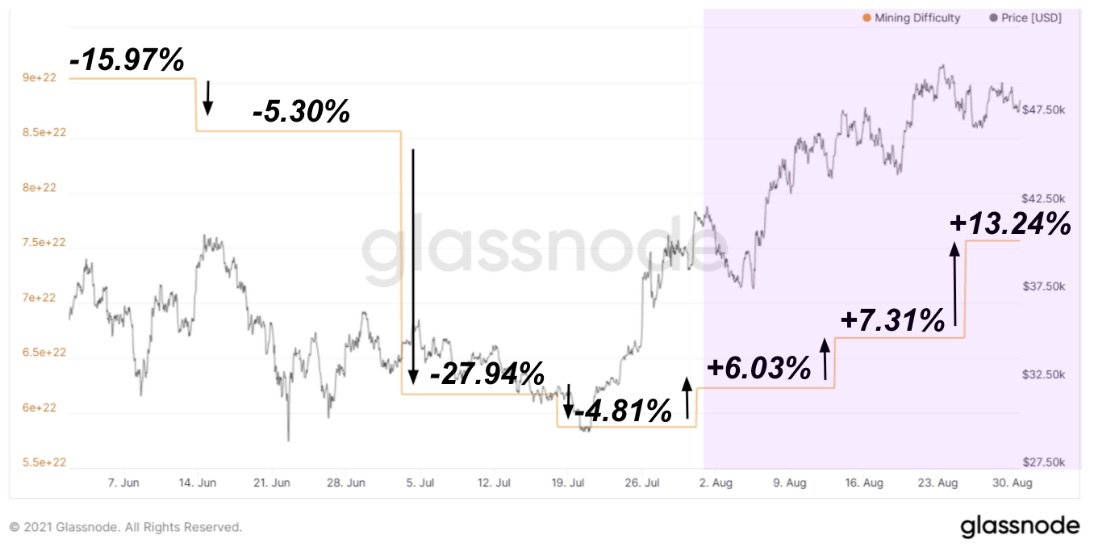
The difficulty of mining Bitcoin. August is highlighted
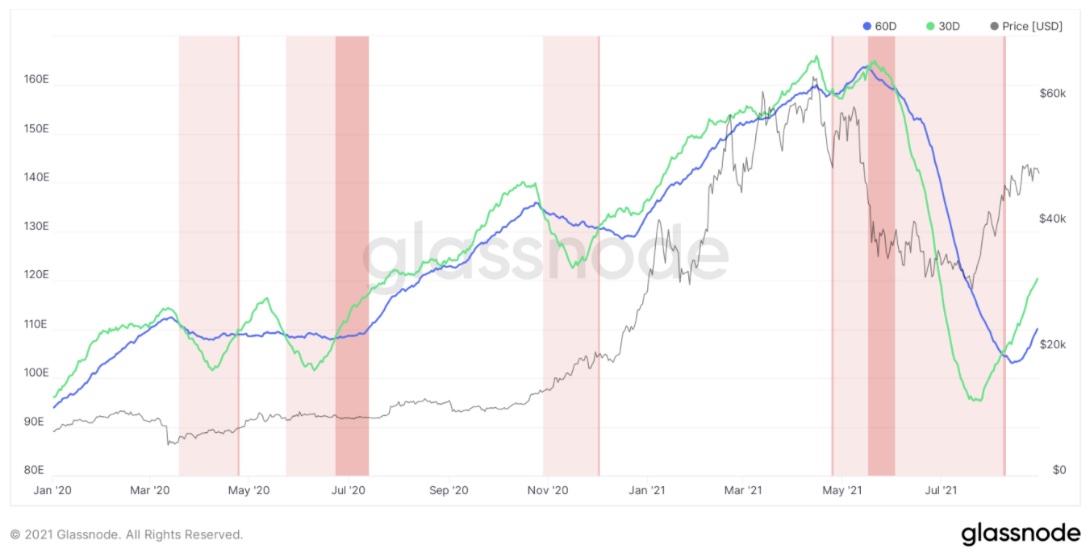
Hash Ribbons for Bitcoin
On August 14, we wrote about a buy signal in the Hash Ribbons indicator, historically one of the most reliable in the bitcoin market.
Hash Ribbons provides some of the most accurate signals to buy bitcoin, using hash changes to determine when bitcoin miners surrender.
When miners turn off their machines, it isshows that Bitcoin mining has become unprofitable for them. As a result of the disconnection, the hash rate of the network decreases, the blocks begin to flow slower than once every 10 minutes, and ultimately, with the next adjustment, the hashing complexity will be reduced in order to induce the disconnected miners to return to their activities.
Typically, when a large number of miners shut down their machines, the Hash Ribbons indicator first signals the surrender of the miners, and then a potential buy signal follows.
While this signal only means that the network hashrate has returned to growth again, it usually means that investors and traders should prepare for a fairly rapid price rally in Bitcoin.Why?Because miners don't sell anymore.Why aren't they selling?Because they don't feel the need.
Now this dynamic is just beginning.unfolding and throughout the history of Bitcoin, when miners were deeply “in the money” in terms of mining cost versus the market price of BTC, the market has always reacted with a strong bullish trend.
Macroeconomic background
As for the macroeconomic environment,the key trend remains the same: there is a bubble of sovereign debt (especially in the US Treasury bond market), which creates a bubble of financial assets in the rest of the world due to the dollar's status as the world's reserve currency.
Consumer price index
Inflation continues to be felt asbusinesses and consumers alike. A series of unprecedented monetary and fiscal stimulus, coupled with disruptions in global supply chains that still cannot fully recover from the 2020 economic lockdowns, have resulted in soaring prices for many commodities, and shortages of essential components such as semiconductors are even forcing enterprises to suspend production.
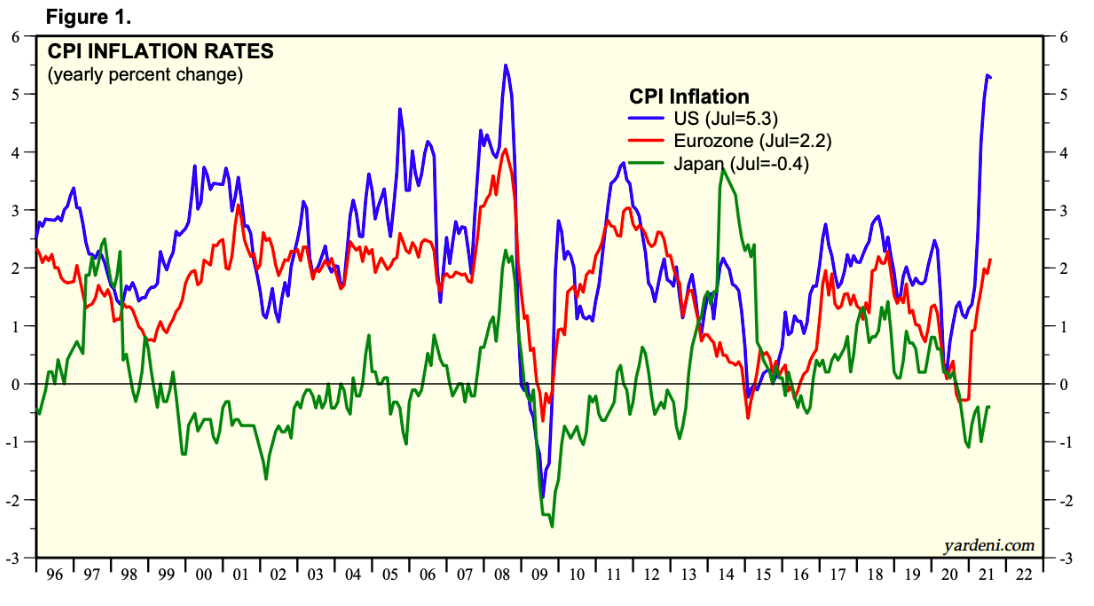
CPI inflation: blue curve - USA, red - Eurozone, green - Japan.
: Yardeni Research
The Treasury market is especially interesting in terms of inflationary expectations: the yield on 10-year debt is 1.29%, and Treasury inflation-protected securities (TIPS) - -1.08%.
TIPS are of particular interest when considering the return offered by an inflation-protected instrument.
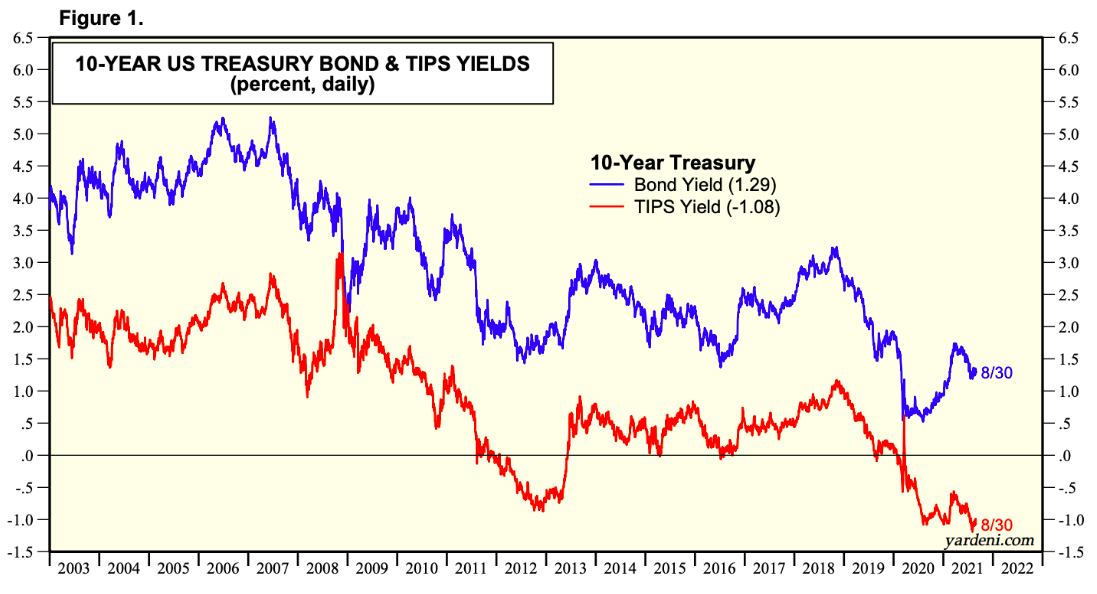
The yield on 10-year government. bonds (blue curve) and inflation-protected bonds (red) (in%, daily chart).
: Yardeni Research
Since the COVID-19 crisis, the FedThe US increased its share of the TIPS market to over 20% from ~ 8% before the crisis. This led to a decrease in the real returns that investors could obtain through securities, stimulating the allocation of capital to other assets, and, combined with negative real interest rates along the entire yield curve, pushed investors to move further along the risk curve.
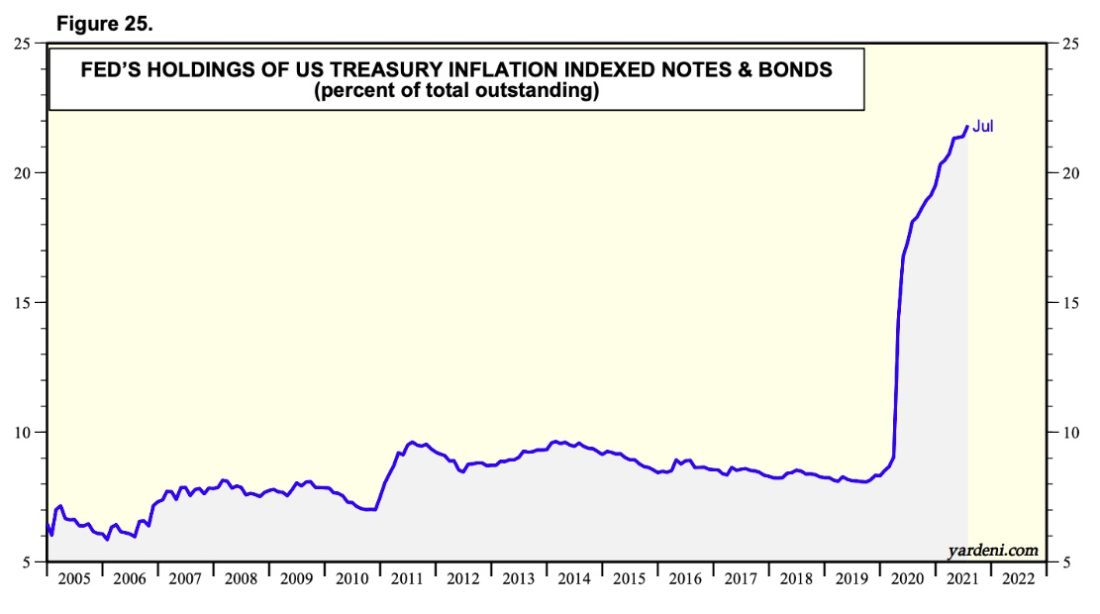
State US bonds on the Fed's balance sheet, indexed by inflation (as a percentage of total debt).
: Yardeni Research
But why would anyone voluntarily invest in a security that is guaranteed to lose value?
In conditions of negative real profitabilitythe dollar (or other fiat currencies) do not play the traditional role of a store of capital, but rather the role of low volatility speculation. In a world where capital is negatively valued and the stock market is creeping upward, setting new record highs on an almost daily basis, holding the dollar in your portfolio is a long-term hedge of volatility against a deflationary downturn. Those holding government bonds are essentially making the same rate, only with additional coupon payments.
In a fiat system with fractional reservationevery dollar created by credit expansion must be repaid, plus interest. Thus, contrary to popular belief, credit expansion may feel inflationary in the short term due to the impact on asset prices, but long-term debt itself is deflationary as some of the borrower's future productivity is carried over to the present.
Dollar/bond bulls bet thatfuture demand for dollars, which comes from $84.6 trillion of domestic debt plus a relatively unknown but very significant amount of dollar debt in the Eurodollar market (USD-denominated deposits in foreign banks outside of Fed regulation), will be betting on the dollar, and they are right.
A dollar loaned today is a dollar plusinterest due tomorrow. Simple credit expansion creates a deflationary scenario in the future. But from the point of view of the financial and global monetary system, there is more to it than meets the eye.
Asset inflation as a national security issue
The growing stock market is currently a national security issue for the United States. Little is said about it, but it's true.
As a result of the Bretton Woods Agreement, whichapproved the US dollar as the world's reserve currency in 1944, and the Nixon shock in 1971 that drove the world economy to floating fiat currencies, the United States was in a rather precarious position.
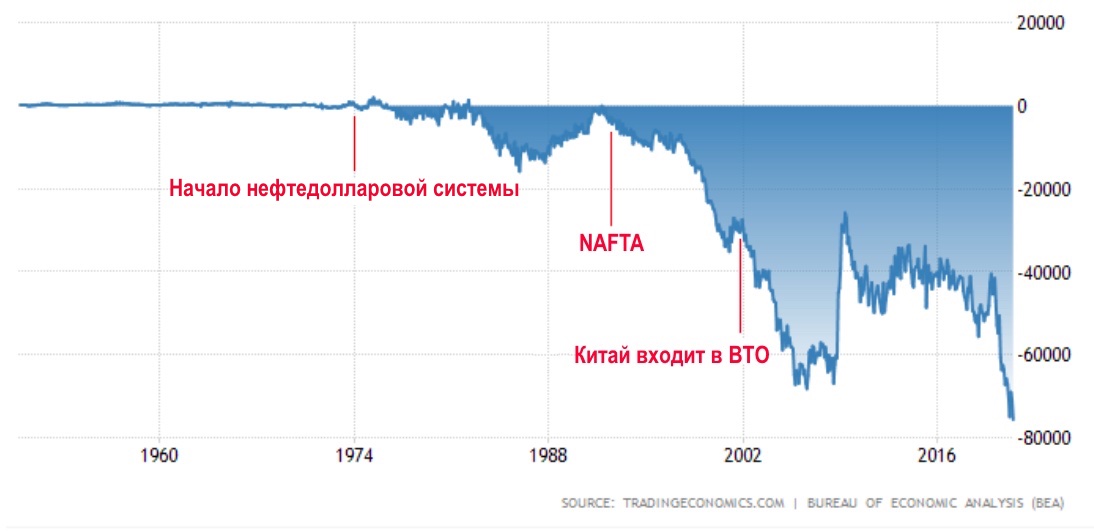
US trade balance.:tradingeconomics.com
Because of the Triffin paradox, the United States has become a rare example of a double deficit country: a trade deficit and a budget deficit.
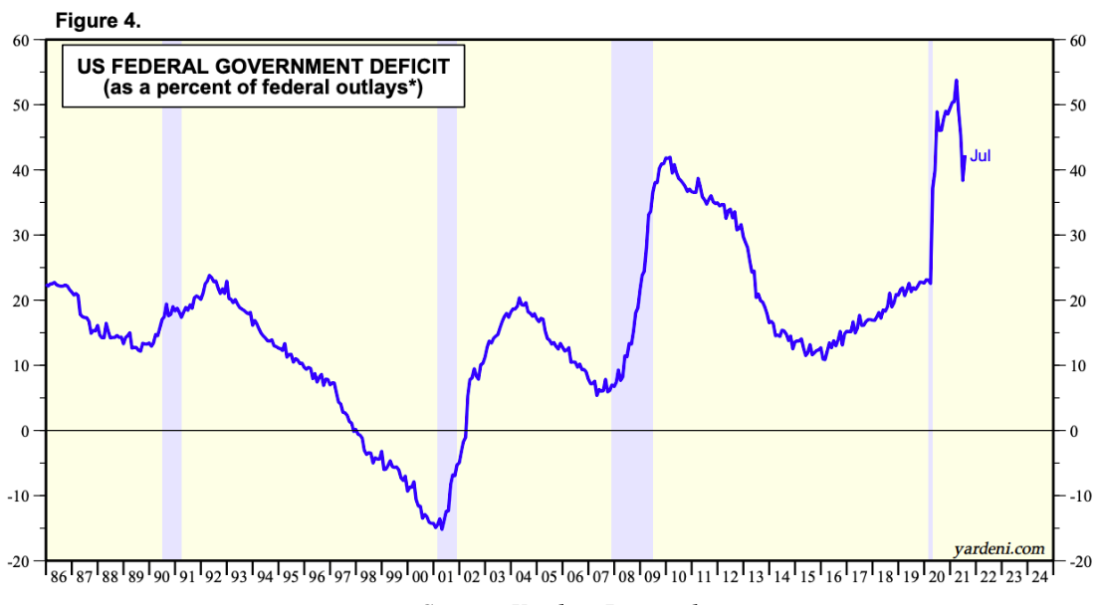
Federal budget deficit (in% of federal spending).
: Yardeni Research
The reasons for this The Economist Robert Triffin outlined as early as 1960:
“If the United States stops testingbalance of payments deficit, the international community will lose its largest source of reserve replenishment. The resulting liquidity shortage could drag the economy into a contractionary spiral, leading to instability.
If the US budget deficit persists, a sustainablethe flow of dollars will continue to fuel global economic growth. However, an excessive US budget deficit (dollar glut) will undermine confidence in the value of the US dollar. Having lost confidence, the dollar will no longer play the role of the world's reserve currency. The system of a fixed exchange rate can fail, leading to instability, "
- International Monetary Fund.
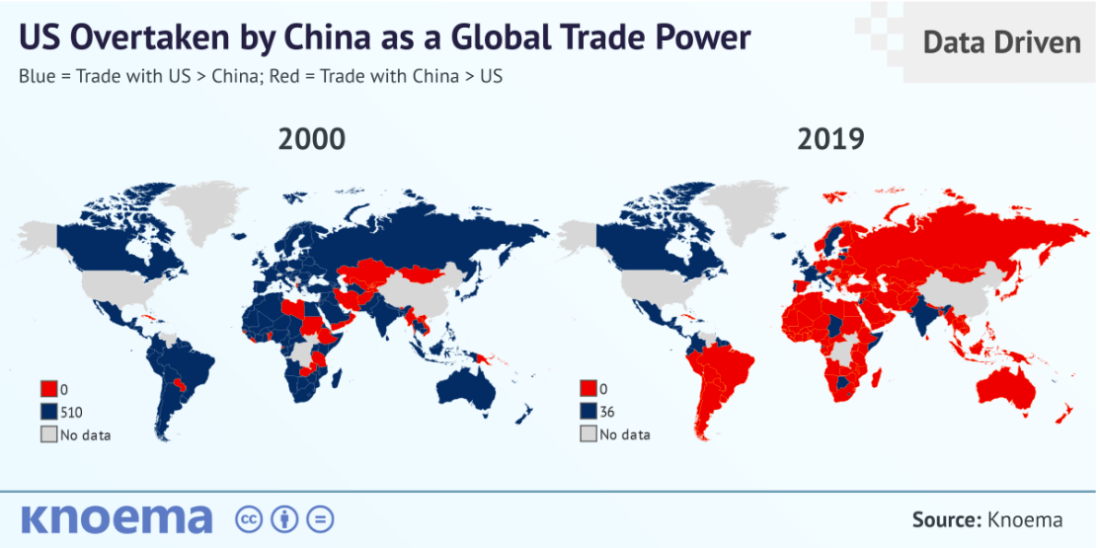
China has surpassed the United States as a global tradepowers. Blue highlights areas where US trade outperforms trade with China, red highlights areas where trade with China outweighs trade with US, gray — no data
In just two decades, the United States has gone fromworld leader in trade before being completely supplanted by the burgeoning national superpower, China. As it turned out, Triffin's fears were justified, and the United States now has two options:
Option 1:Change the exchange rate and “protect the dollar” by demandingThe Fed is raising interest rates and cutting back on asset purchases, thereby plunging the global economy into an unprecedented depression, while widening divisions in an already polarized society as unemployment rates rise, asset values fall, and the real value of debt soars.
Or
Option 2:Continue to devalue the dollar whilestocks, real estate and other asset classes continue to rise slowly and steadily in nominal terms as the US seeks to recapture the manufacturing that has been driven out of the country over the past two decades while attempting to keep social tensions to a minimum.
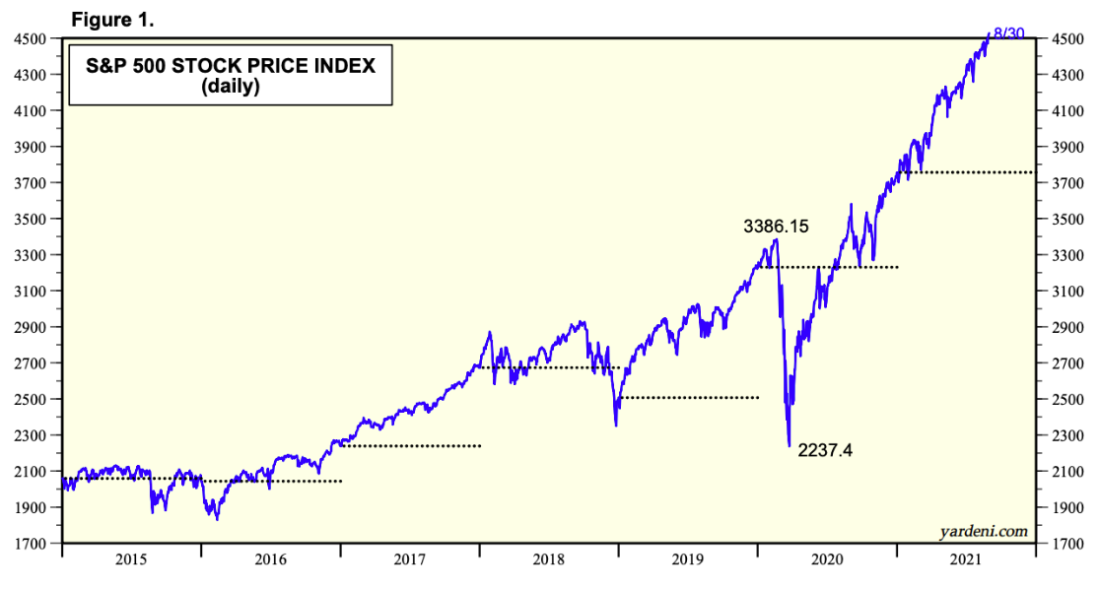
S&P 500 Index (1-day chart).: Yardeni Research
That the market continues to grow slowly and steadilywith minimal volatility is not a mistake, but rather the result of a deliberate policy. Market participants know that talking heads from the Fed and political power have no choice but to devalue the currency.
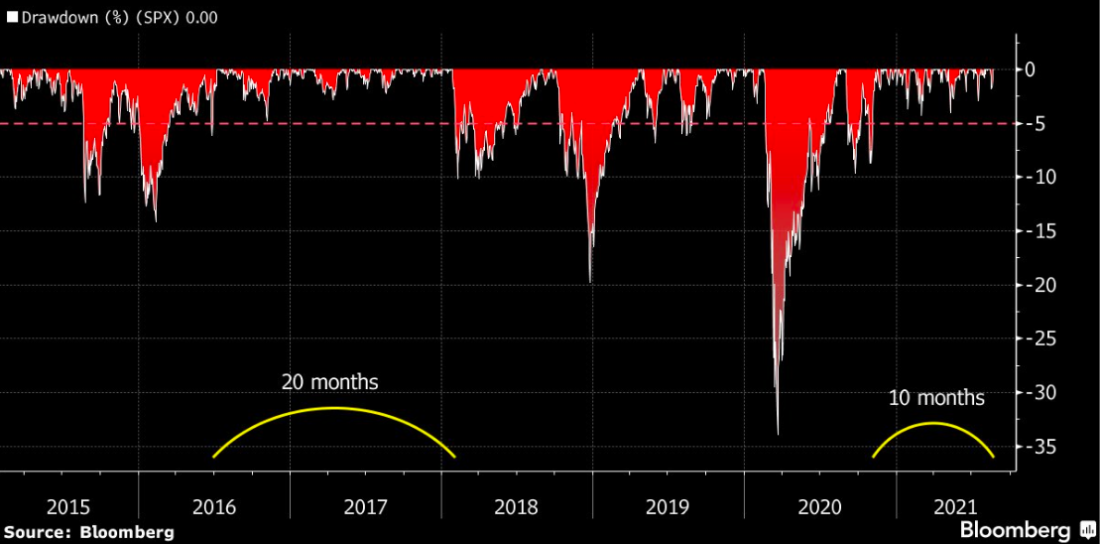
10 months without a 5% correction in the S&P 500 index.
: Holger Szchaepitz
According to (PDF) former credit market trader Greg Foss,
“In the debt-to-GDP spiral, fiat currency is a fallacy. This is pure mathematics. This is a spiral from which there is no mathematical exit. "
This is not a new phenomenon, and in fact debtcrises like the one unfolding today - not only in the United States, but throughout the world - have happened many times before (just not on the same scale as they are now, in a technologically interconnected world).
All known debt crises in history have ended in the same way:
"Print money / monetization of debt and governmentguarantees are inevitable in a depression when interest rate cuts will not work, although these instruments are of little use in countries that have limited or no money to print money and cannot easily negotiate debt redistribution. All the cases of debt reduction we studied (and this is most of those that have occurred over the past 100 years) ultimately led to large waves of money creation, budget deficits and currency devaluation (in relation to gold, commodities and stocks) ",
- Ray Dalio, Principles for Overcoming Large-Scale Debt Crises (PDF, eng.)
Our proposed solution to this problem is clear:Bitcoin. And the reason I started this report with basic supply and demand dynamics in the Bitcoin money network is because Bitcoin serves as a solution to the problem of large monetary inflation.
“In investing during periods of hyperinflation, there isa few basic principles: sell currency, do whatever you can to get your money out of the country, buy commodity assets, and invest in commodity industries (such as gold, coal, and metals). Buying stocks will probably not be the best decision: investing in the stock market becomes unprofitable as inflation turns into hyperinflation.
Instead of a high correlation between the exchange rate andshare price, there is a growing divergence between them. So during such periods gold becomes the preferred asset, stocks suffer losses, even if their value in local currency rises, and bonds are completely useless. "
- Ray Dalio, Principles for Overcoming Large-Scale Debt Crises (PDF, eng.)
The solution is simple:
- Withdraw your money out of the country and store it in the immutable Bitcoin money network.
- Shorten the currency (borrow dollars depending on the term, collateral and interest rate) and buy solid assets with the cost of production.
The reason gold has always beenthe preferred asset during debt crises is not the shiny metallic nature or its industrial use, but rather the unfalsifiable value of the asset. The marginal unit of gold was more difficult to produce in relation to the available supply than any other interchangeable commodity.
In the face of Bitcoin, we have a monetary asset withliquidity 24/7/365 in every jurisdiction and in all markets of the planet, with a strictly limited supply, with a direct economic incentive to sell any / all surplus energy to the grid, strengthening it in the process while increasing the marginal cost per unit of production (due to the adjustment of complexity, as mentioned above).
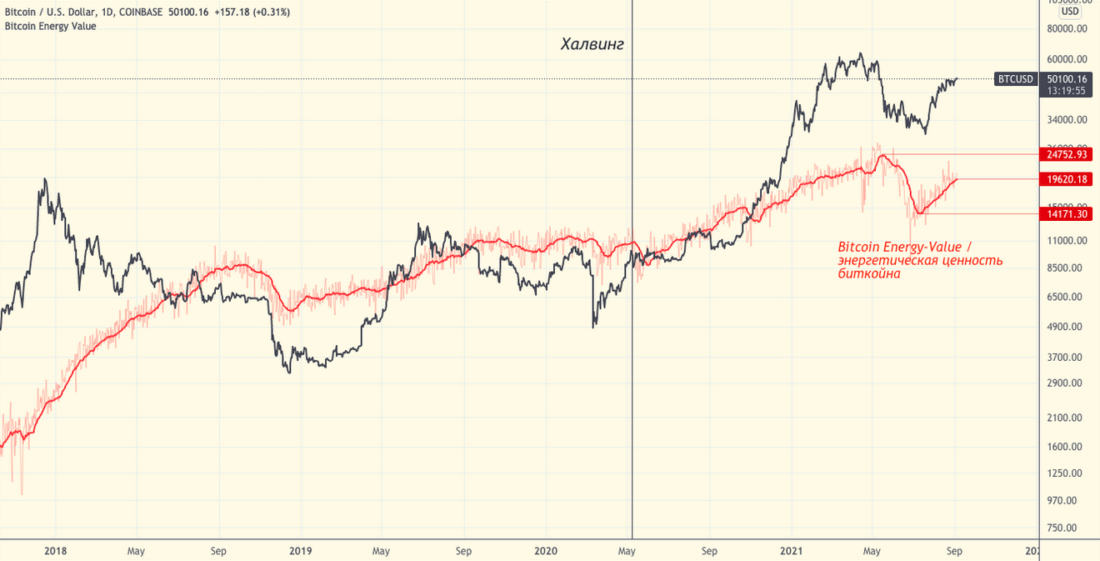
Chart executed in TradingView
Bitcoin is not just an asset to buy in times of unprecedented economic turmoil.
Bitcoin is by far the most reliableasset on the planet, and unlike gold during debt crises of the past, Bitcoin today is in the process of monetization, which leads us to believe that a 10,000% growth is not only theoretically possible, but quite likely over the next decade .
Finally, I would like to quote one more quote, this time from the famous Austrian economist, Ludwig von Mises:
“There is no way to avoid the finalthe collapse of the credit expansion boom. The only choice is whether the crisis will come sooner as a result of a voluntary abandonment of this policy, or later as a complete and final catastrophe of the monetary system, ”- Ludwig von Mises.
Place your savings accordingly.
BitNewsdisclaim liability for anyinvestment recommendations that may be contained in this article. All opinions expressed express exclusively the personal opinions of the author and respondents. Any actions related to investment and trading in crypto markets involve the risk of losing invested funds. Based on the data provided, you make investment decisions carefully, responsibly and at your own risk.
</p>
Read this:
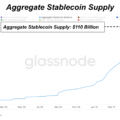 Stablecoin Market Review and Stablecoin Supply Ratio Indicator
 MP from Paraguay Announces 'Big Day' for Bitcoin
 Structural Analysis of the Bitcoin Market | 15 March 2021
 Through uncharted territories. Structural Analysis of the Bitcoin Market
 The mechanics behind Bitcoin's parabolic growth cycles. Visualization
 The Effective Market Hypothesis and the Bitcoin Stock-to-Flow Model