With the retest of weekly support in the BTC/USD pair, the market once again came close to the defining level. INIn this weekly review, Cred and DonAlt, authors of the Technical Roundup mailing list, share their thoughts on market positioning in the current ~ $ 30K structure.
Ethereum is traditionally next on the list: we will discuss the weekly range in the pair to BTC and the key levels in the pair to USD.
Altcoins look as unreliable as ever. Today we take a look at the technical structure of the DeFi Index and also discuss Solana, one of the major bullish anomalies in today's altcoin market.
The review will be completed by a guest "column" from William Clemente, who will share his on-chain analysis of the current range in the bitcoin / dollar pair.
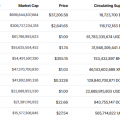
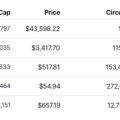
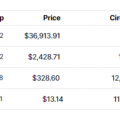
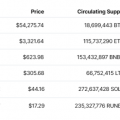
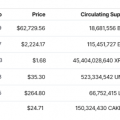
https://coinmarketcap.com/coins/views/all/
Bitcoin returned to support
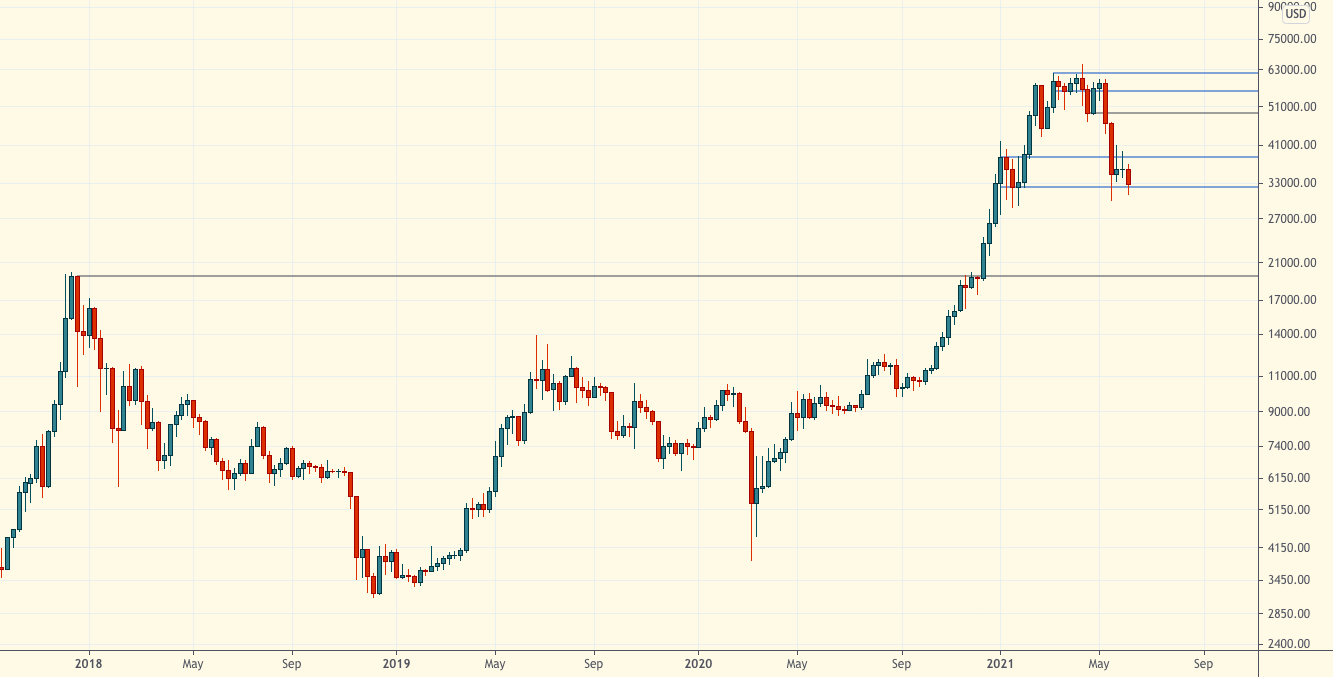
Chart executed in TradingView
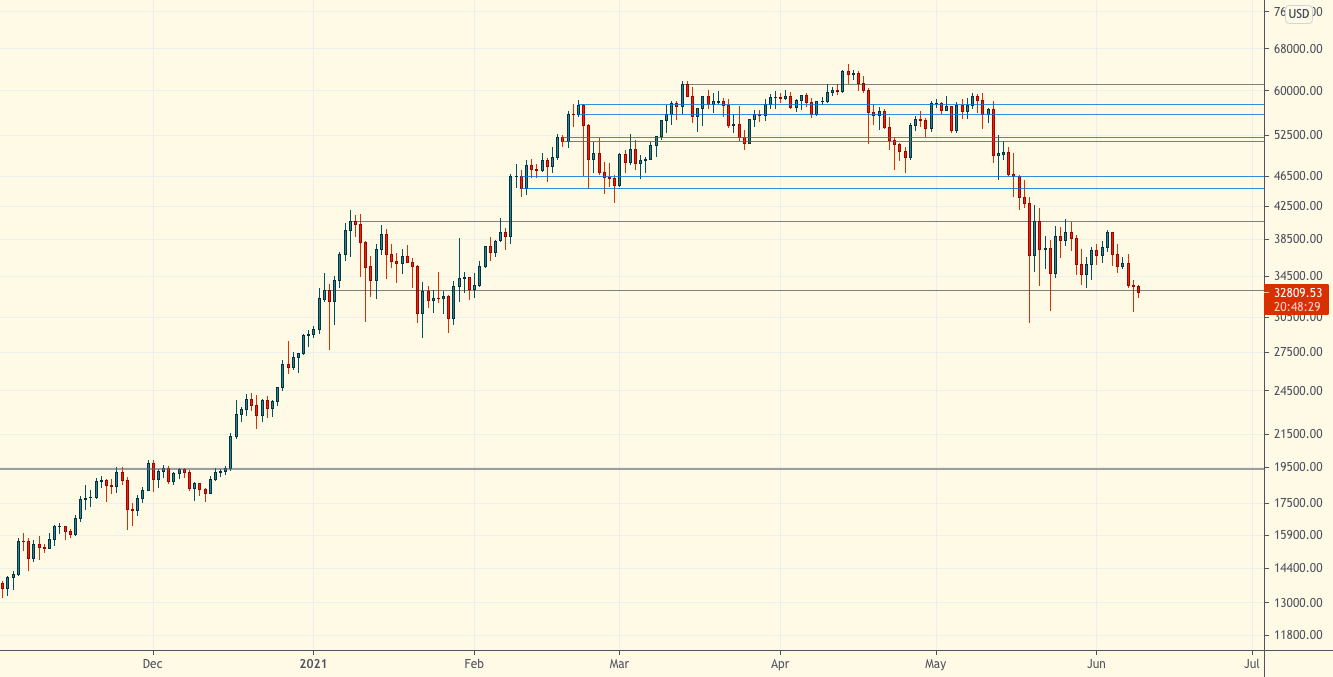
Chart executed in TradingView
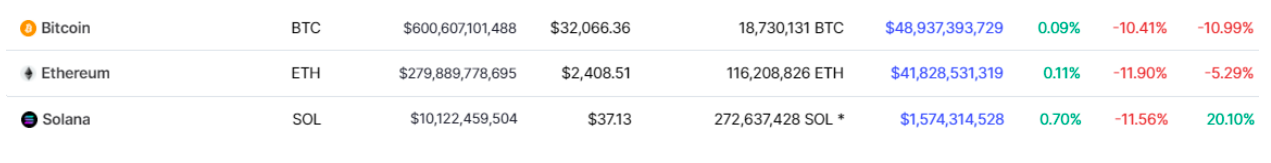
The BTC/USD rate has returned to support. The weekly structure at $32.3 thousand is currently being tested.
This is support on the weekly timeframe.When trading on high timeframes, you need to take into account the possibility of "wicks" formation (on the candlestick chart), since these levels are not always reinforced concrete. This is especially important when it comes to a strong downward movement into the support level, fueled by liquidations.
This support has a common optionpositioning on the market became a “blind” purchase during liquidations. However, on smaller timeframes this is already the third or fourth retest of the current support in a row, and this circumstance requires additional caution. Not least because if the BTC price falls below $30 thousand, the next significant support is at $20 thousand.
In the Technical Review, we professconservative approach. And although we are not averse to buying out sharp drops on personal accounts on occasion, the format of the weekly review imposes its own limitations (however, they are quite reasonable for a wide audience). This leaves us with the following options.
Reaction (purchase) to deep movableswith “wick” liquidations below $30K seems like a smart tactic. Buying after a deep “spike” drawdown with a subsequent recovery above $32.3 thousand is also a competitive option. Waiting for a weekly close above $32.3K and then showing strength in the subsequent week is a slower tactic, but also not a bad idea.
But catching declines by essentially trading againstmarket is a very risky activity unless you deliberately specialize in small time frames. A move below $30k aggressively bought back would at least define the risks, i.e. provide a logical area to set a stop loss.
Do not lose sight of the fact that the market is now at the support level, which does not add to the simplicity and readability of the current market structure.
Ethereum is still in range
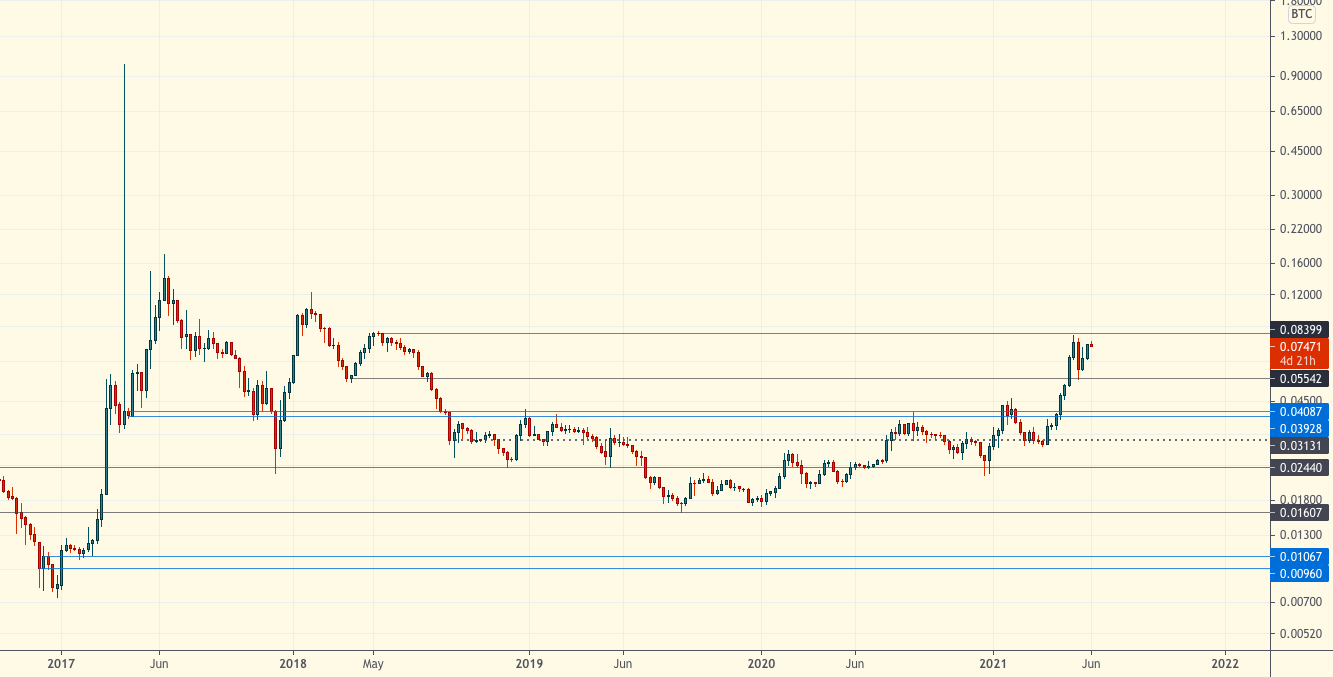
Chart executed in TradingView
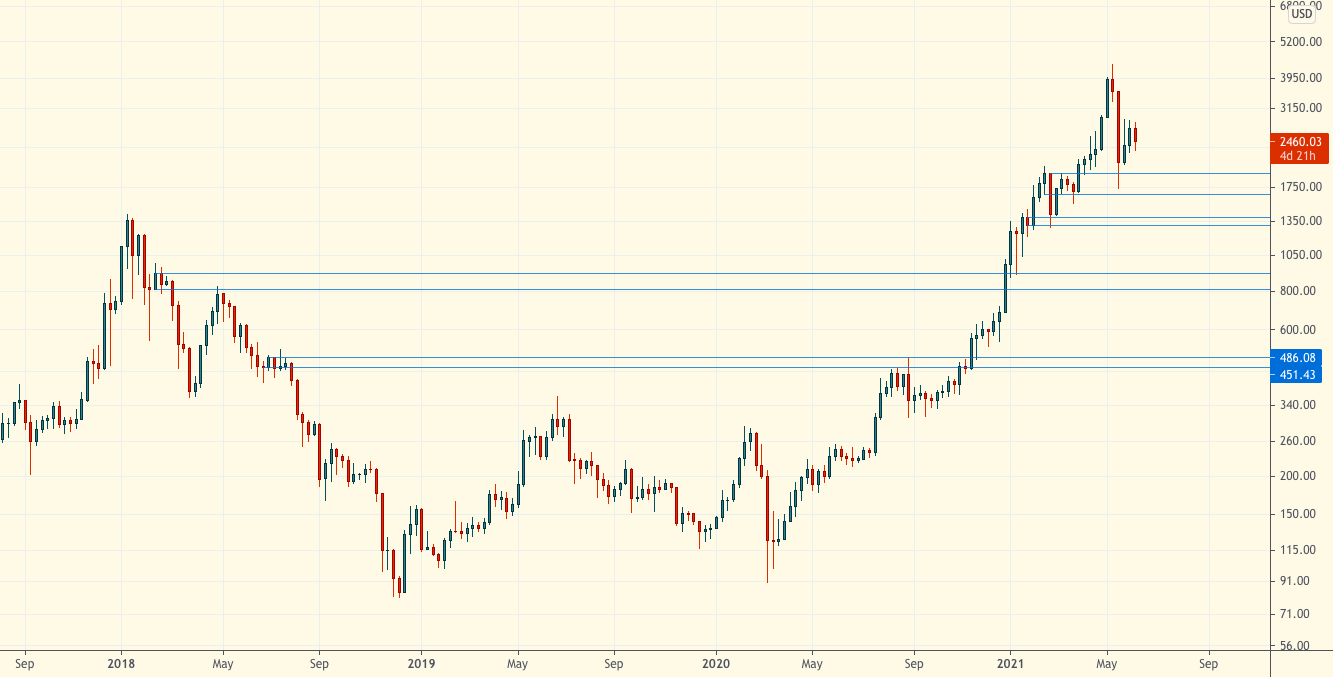
Chart executed in TradingView
Ethereum is still in range and showing relative strength against Bitcoin.
Last week we made our pointon the thesis about the “unlinking” of the ETH rate from BTC. To briefly summarize, we do not believe there is strong enough evidence that Ethereum can disassociate itself from BTC's weakness on higher timeframes. We also believe that the best time to benefit from stretched correlations is during a bull market, i.e. when Bitcoin's market conditions are a tailwind for Ethereum.
The pair against USD looks good.The price bounced off the support seen on several timeframes around $ 2000, after which it got stuck in the range between $ 2200 and $ 2900. Unlike BTC / USD, Ethereum / USD is currently out of support at the high timeframe. Being away from the trading structure usually means a no-trade zone for us. As we said, we expect ETH / USD to follow the BTC / USD rate if the latter breaks through the support and continues the downward movement.
In the pair to BTC, little has changed.Against BTC, ETH is still within the weekly structure with support at ₿0.055 and resistance at шим0.084, which has not yet been tested. This usually suggests that Ethereum is the best candidate for a good bounce. While this is true in terms of relative strength, there are no good technical levels to work with with BTC.
To summarize, Bitcoin's weakness continues to be a strong deterrent for Ethereum bulls. And to date, we see no reason to conclude that the ETH rate has significantly diverged from BTC.
DeFi finds resistance
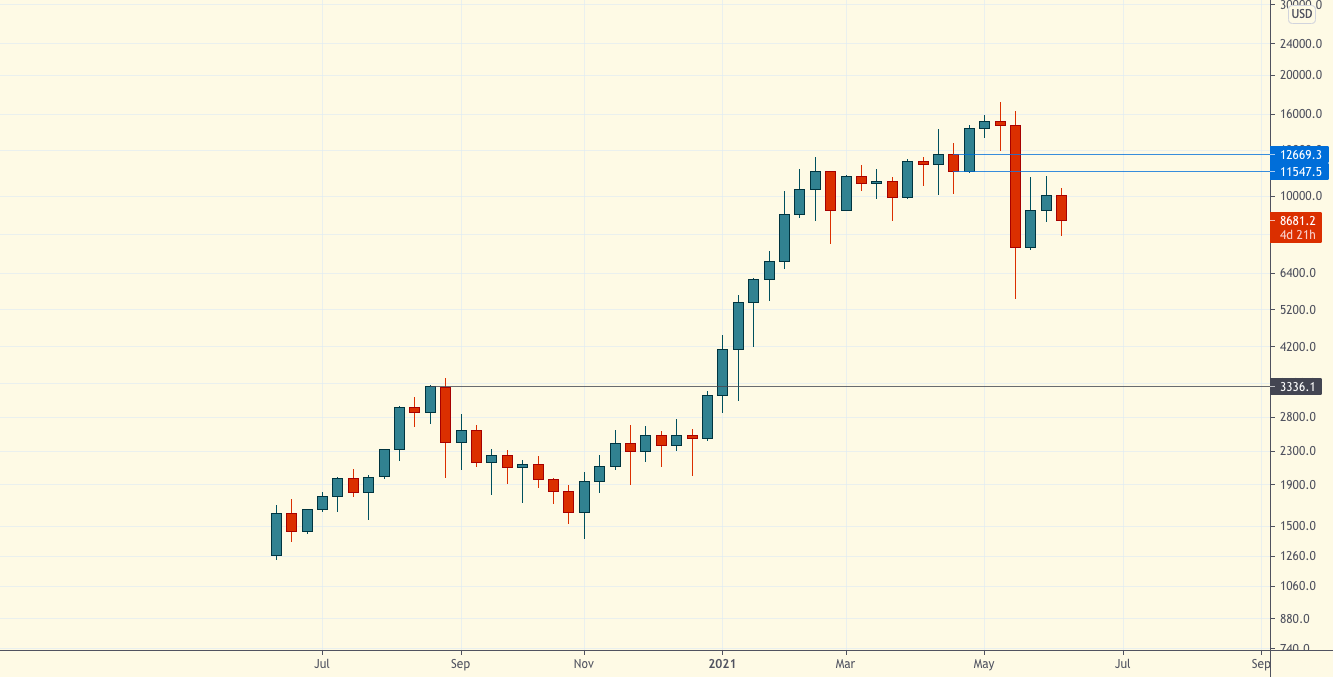
Chart executed in TradingView
The DeFi Index is imperfect, but it's a good way toat a glance to get an idea of where this market is. And now it is at the resistance after breaking the structure on a high timeframe.
In the past few weeks, it has been difficult to leada reasonable case for allocating funds to this asset class. From a TA perspective, all altcoins (and DeFi are no exception) have broken through important supports, and recent weeks have been marked by mostly bearish retests. In addition, even in terms of relative strength against Bitcoin, DeFi is inferior to Ethereum.
While stories of DeFi decoupling from BTC based on cash flows and the like sound appealing, it appears that the market is currently treating these instruments as mere collateral.
In full accordance with the bulkaltcoins, the DeFi index broke the market structure on the weekly timeframe and is now testing the previous support at $ 9,934 as resistance. Support for keeping the trend is quite far below. When you are dealing with a rally after a bearish break in a market structure, buying that rally into resistance is usually a very bad decision. The best trading opportunities open either above the resistance level on a retracement, or near support on a deeper correction. The current situation does not correspond to either option.
However, this is a good point to quoteone of DonAlt's old sayings: “We have no desire to fight for some crumbs when almost no one sells it; we will be more active when everything looks good again. ” It's like that.
An exception to the big picture of altcoins: Solana
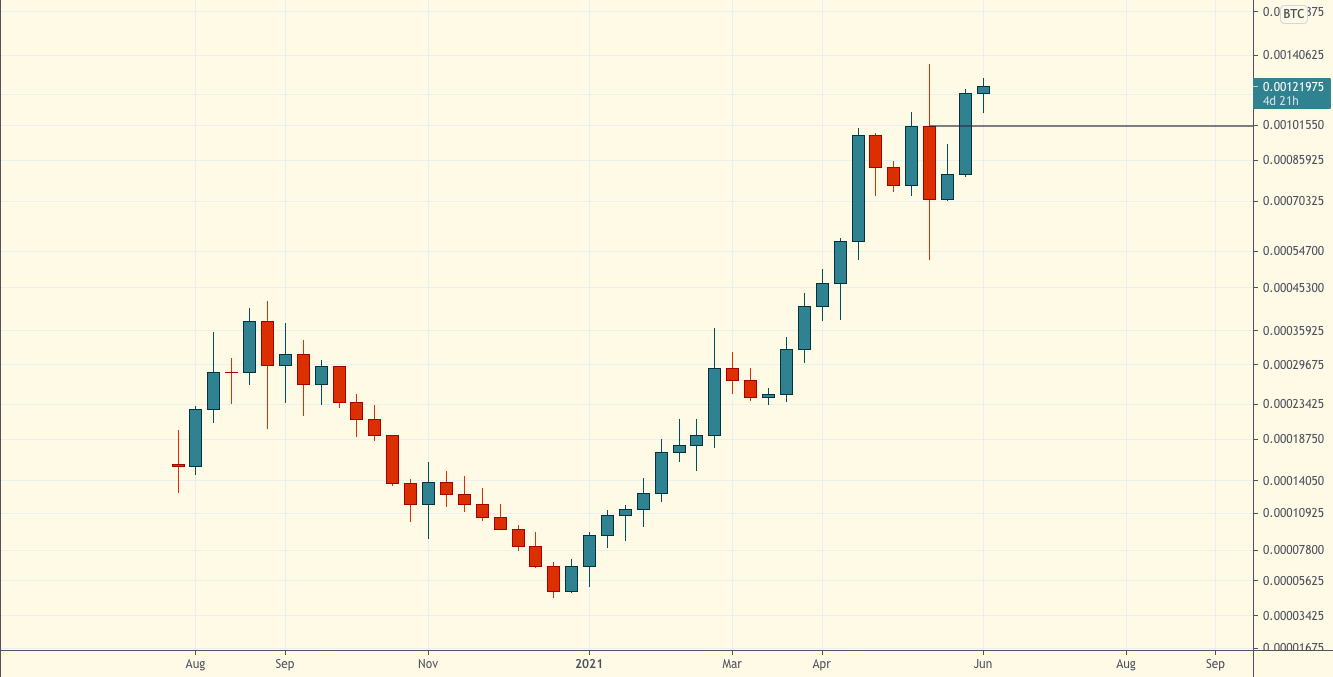
Chart executed in TradingView
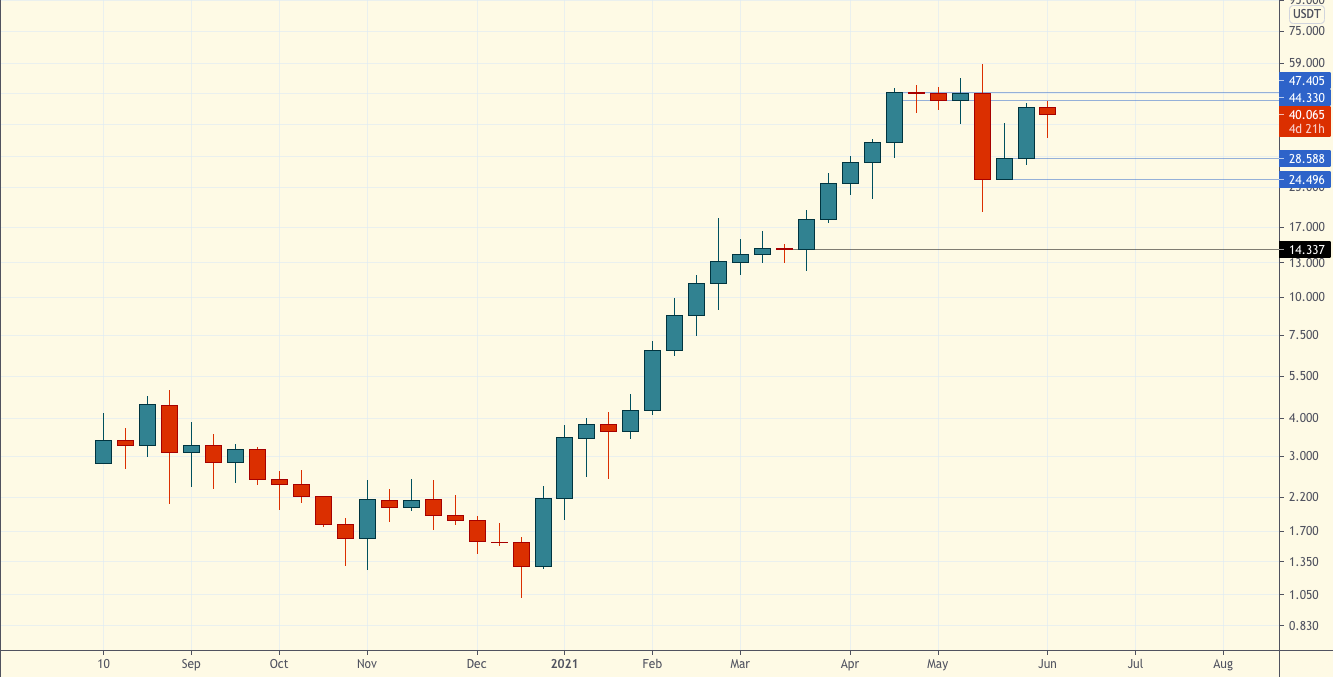
Chart executed in TradingView
Altcoins in general were completely uninteresting. The last few weeks have been marked by erratic bearish retests of the breakdown levels of the market structure.
Solana is one of the few exceptions to the big picture (speaking of relatively high-cap altcoins), and not for the first time.
Unsurprisingly, the pair to BTC is showing strength.The SOL / BTC rate formed a larger high on the weekly timeframe after a month-long consolidation. The chart is bullish, but there are lessons to be learned from Ethereum. In particular, bullish exceptions do not last forever, and will ultimately fall along with the entire market at a time of general weakness. Generally, quite a few altcoin to BTC pairs look good. The reason we raise this issue is to make the following important difference: in our opinion, the fact that altcoin / BTC pairs look decent is more a consequence of the weakness of bitcoin than of the strength of the altcoins. And this is definitely not an ideal situation if you are looking for a stable and sustainable rate opportunity.
The rate to USD is at resistance.A good rally from the lows led the price to the $ 44.3-47.4 cluster. At this level, we expect people to take profits, at least in part. The alternate scenario is a breakout of an all-time high, but to be honest, we are not particularly interested in buying a breakout in one of the few exceptions altcoins when the rest of the market approached the resistance level after breaking the bullish structure.
Even exceptions from the general picture today do not look very attractive in our eyes.
On-chain analysis from Will Clemente
Will Clemente specializes inon-chain analytics. He has kindly agreed to share his thoughts on the current state of the bitcoin market in this White Paper. We are mainly guided by technical analysis, but we love to learn and are always open to different methodologies.
In this part, we will look at the profiles of various market participants trading BTC / USD in this price range.
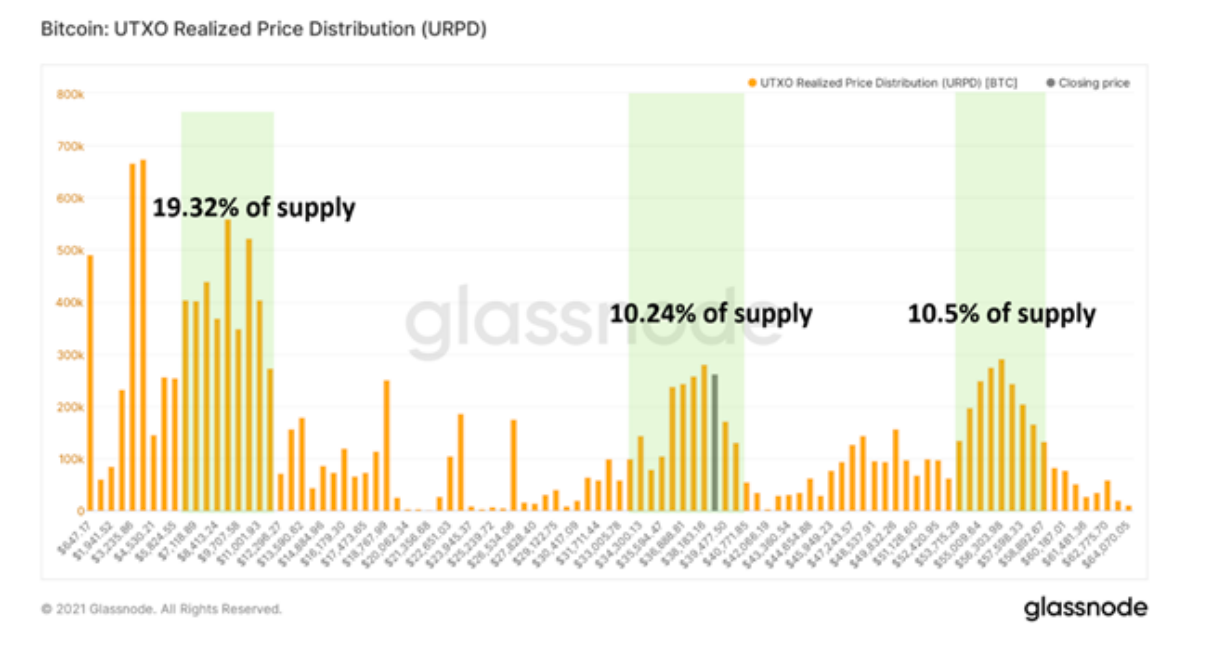
First, let's highlight the third one for this bullish rallya large zone of on-chain volume between $32 thousand and $40 thousand. The other two are one above ($53-59 thousand), the other below ($4-11 thousand) current values. This indicates the creation of a strong capital base in the current range. It should be noted that the mentioned upper zone will now likely act as resistance if we return to these values in the near future. It's worth keeping this in mind.
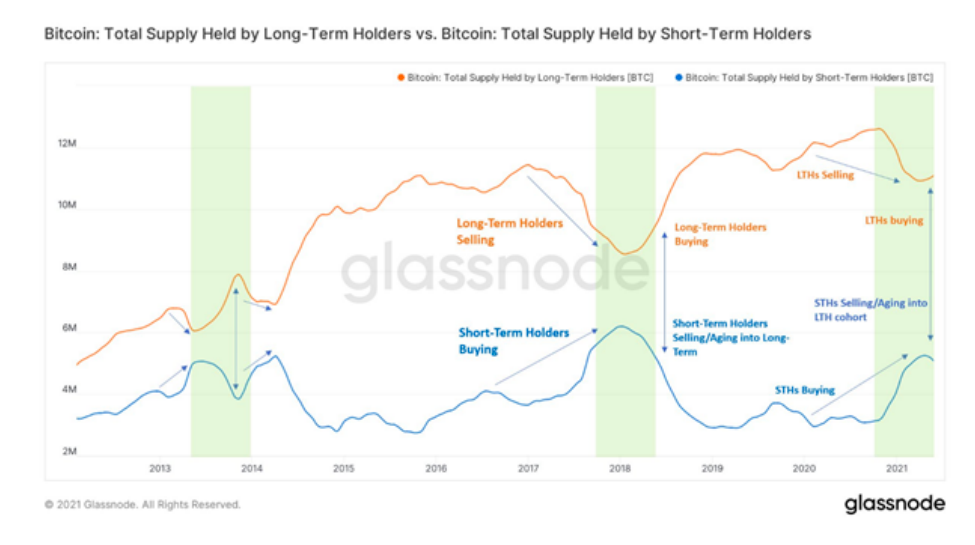
One of the most important trends is dynamicsdistribution of BTC between short-term and long-term owners. Short-term holders have sold more BTC in the past month than long-term holders have bought, but in the past week, long-term holders have offset sales of short-term holders. Such divergence was observed only in two cases: 1) consolidation between the two pumps of 2013 and 2) transition to the bear market in 2018.
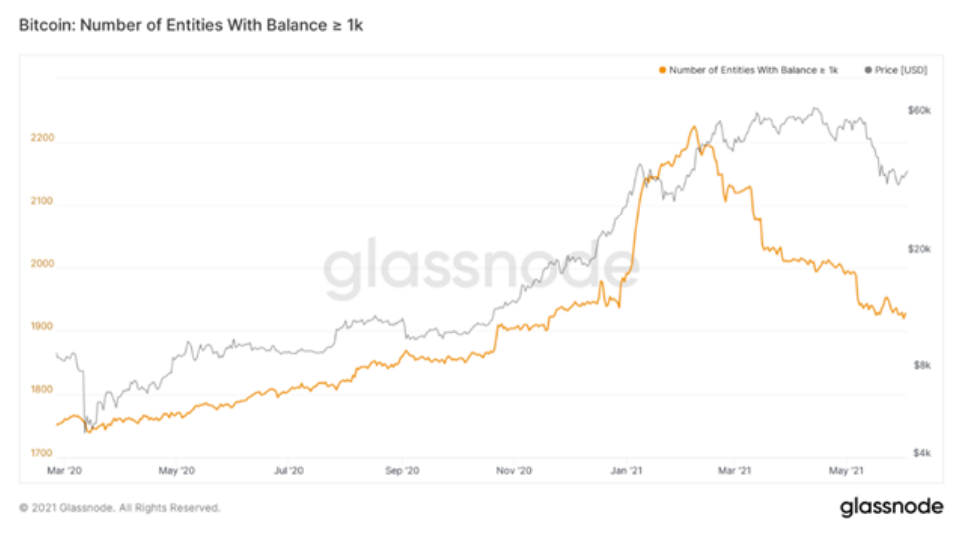
Above, we talked about the tendency to hodling amongmarket participants. Now let's take a look at the cohorts of network actors, divided by the amount of their savings. The current trend is no longer as promising as in the chart above.
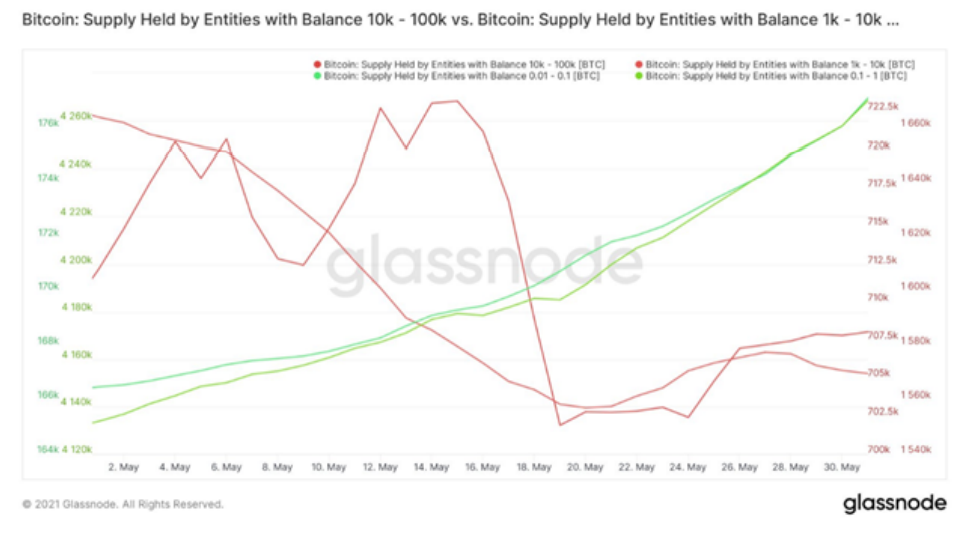
The number of whales has been steadily declining since February.indicating a decline in demand from wealthy investors and institutional capital. At the same time, accumulation by retail investors has occurred at the fastest pace in Bitcoin history. The second graph shows a reverse shift from larger chain entities to retail investors.
Whales selling their stock to retail investors is certainly not the most optimistic picture.
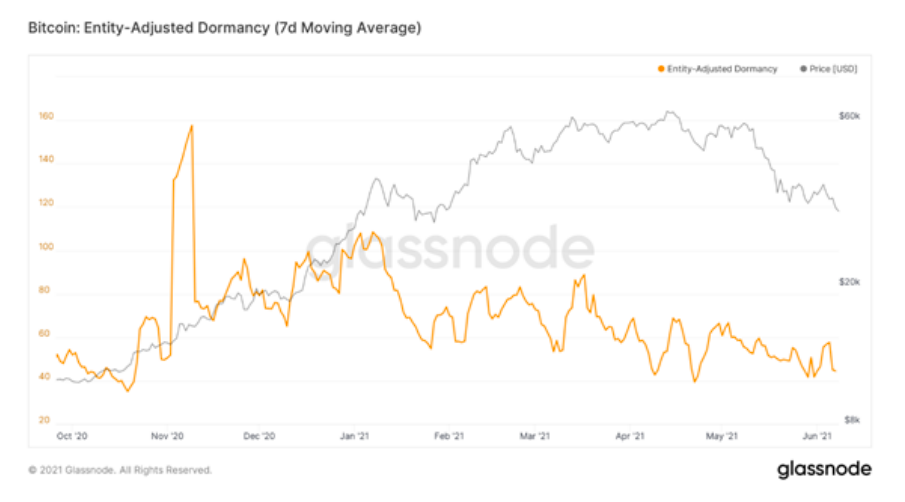
In general, the age of the coins sold has been on a downward trend since the beginning of February.
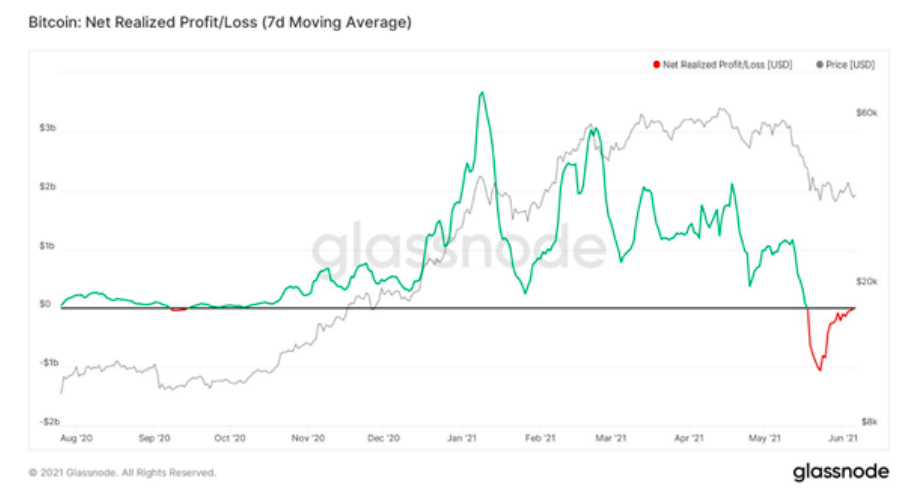
These coins have been selling at a loss since mid-May, but now the process seems to be almost complete.
Conclusions:
The market seems to be in the stage of consolidation: new entrants are selling, experienced ones are buying, profit-taking levels are practically zeroed above the profit / loss threshold.
The whales are selling, the "retail" is buying (in this sense, the picture is so-so).
If we zoom out and look at the macro picture, the on-chain indicators still show opportunities for this bullish trend to continue.
The article does not contain investment recommendations,all the opinions expressed express exclusively the personal opinions of the author and the respondents. Any activity related to investing and trading in the markets carries risks. Make your own decisions responsibly and independently.
�
</p>