Let's refresh an old idea... Too many traders view technical analysis as a predictorfuture events.They believe that they can see what will happen based on several lines and candles on the chart. If that were the case, all technical analysts would agree on each chart, and (almost) all traders would have 100% success and be fabulously rich.
The reality is that you can show a graph100 traders and get 100 different interpretations of where the price will go. In this respect, technical analysis is at least pseudoscience, and should be wary of any trader who speaks with absolute certainty about what will happen. They are either trying to sell you something or are emotionally attached to their idea.
The graph is just an illustration of emotionmarket participants. How fearful are they? How Greed Is It? At what point is the pendulum most likely to swing between the two poles? And that's exactly what we want to find out.
So what is the general purpose of charting analysis?For me, a chart is a risk management tool and a way to approach a trade with a specific plan. It includes points such as the entry point to a trade, closing a trade with a profit, and where to set a stop loss in case things don't go according to plan. Risk management becomes much more difficult without a chart, even if all lines, patterns and indicators are completely meaningless. At least the graph gives us some useful information. This is why I always say that the method of identifying trades does not matter - what matters is how you apply that method to manage your risk, and this is where the chart comes into play.
Charts cannot tell you what will happen in the future!
Bitcoin technical analysis
Markets reacted quickly to news of defaultEvergrande a few days earlier. She later turned out to be a fake when Evergrande paid off her debts. Markets tend to overreact to the news, even though everyone was watching Evergrande and knew it was coming. In addition, the number of open positions in Bitcoin futures was high, and the number of long positions was also increasing. As I always say, whales use news like this to provoke cascading liquidations and make money, which is probably what happened here. It is highly unlikely that the average investor immediately reacted to the news about Evergrande and sold their bitcoins. It wasn't like that.
In any case, this small (so far) correction has practically no effect on the picture observed on the older timeframes.
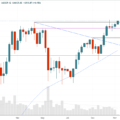
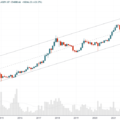
Monthly schedule
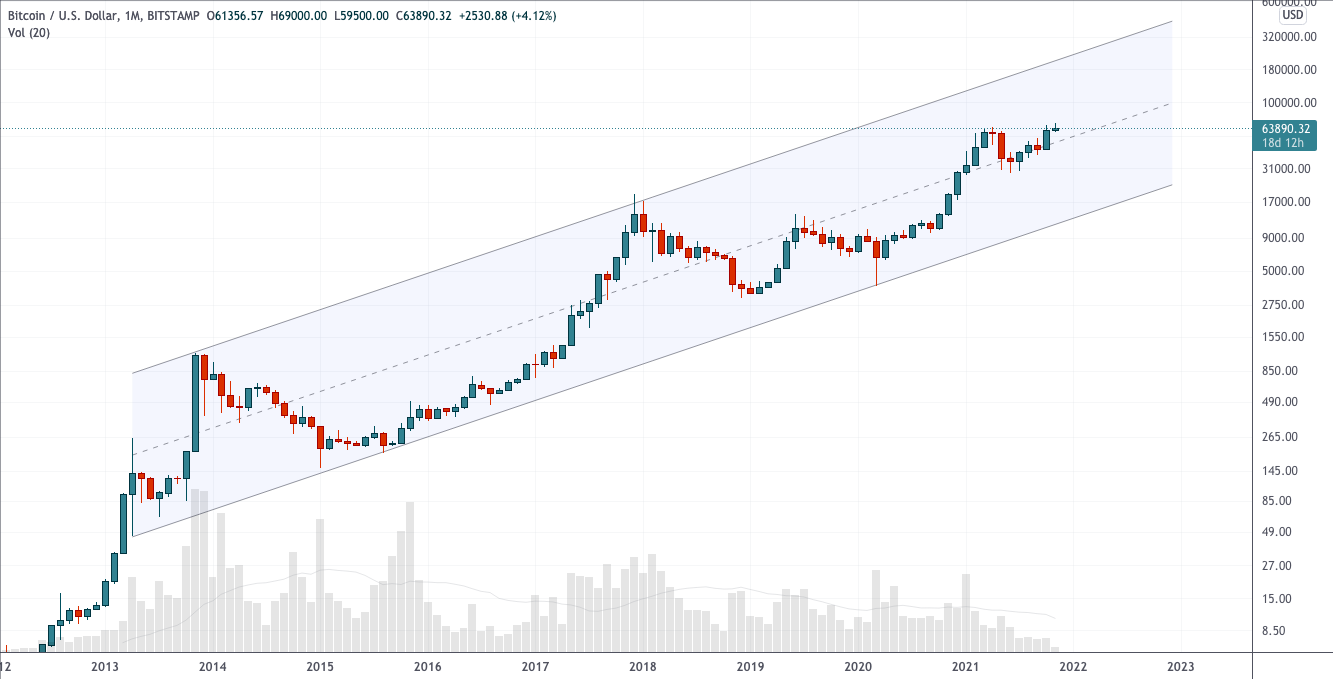
Chart executed in TradingView
Rise to the highs of the ascending channel in the process. I wrote about this in more detail last Friday.
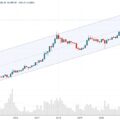
Weekly schedule
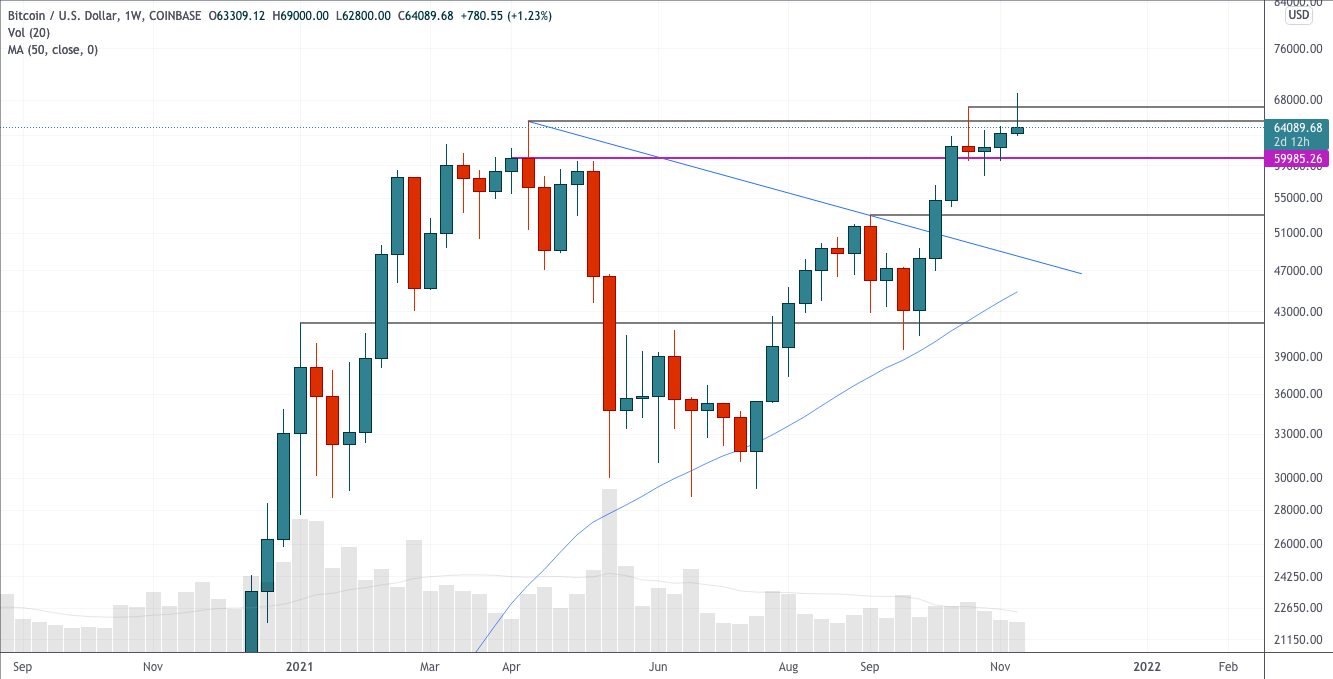
Chart executed in TradingView
I already see talk about a new bear market and aboutthat bitcoin has reached the top. Anything is possible, but I always find it amusing when price action, which is actually sideways, causes panic in the market.
In my opinion, nothing special is happening.The weekly candle doesn't look particularly informative yet, but we have a few days left and it's too early to judge. At the moment we have another «shooting star» and the bearish Swing Failure Pattern (SFP). We saw this three candles ago and it turned out to be just a donut hole. However, a repetition of the pattern may serve as additional confirmation that the market is not yet ready for continued growth.
For several days now, my analysis and intuition have suggested that we will see some consolidation and decline by testing the lower levels.
Small corrections and retests of levels as support are healthy trends. Sometimes the market needs to retreat a little in order to move higher later. This in itself is not cause for alarm.
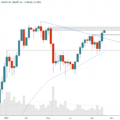
Daily chart
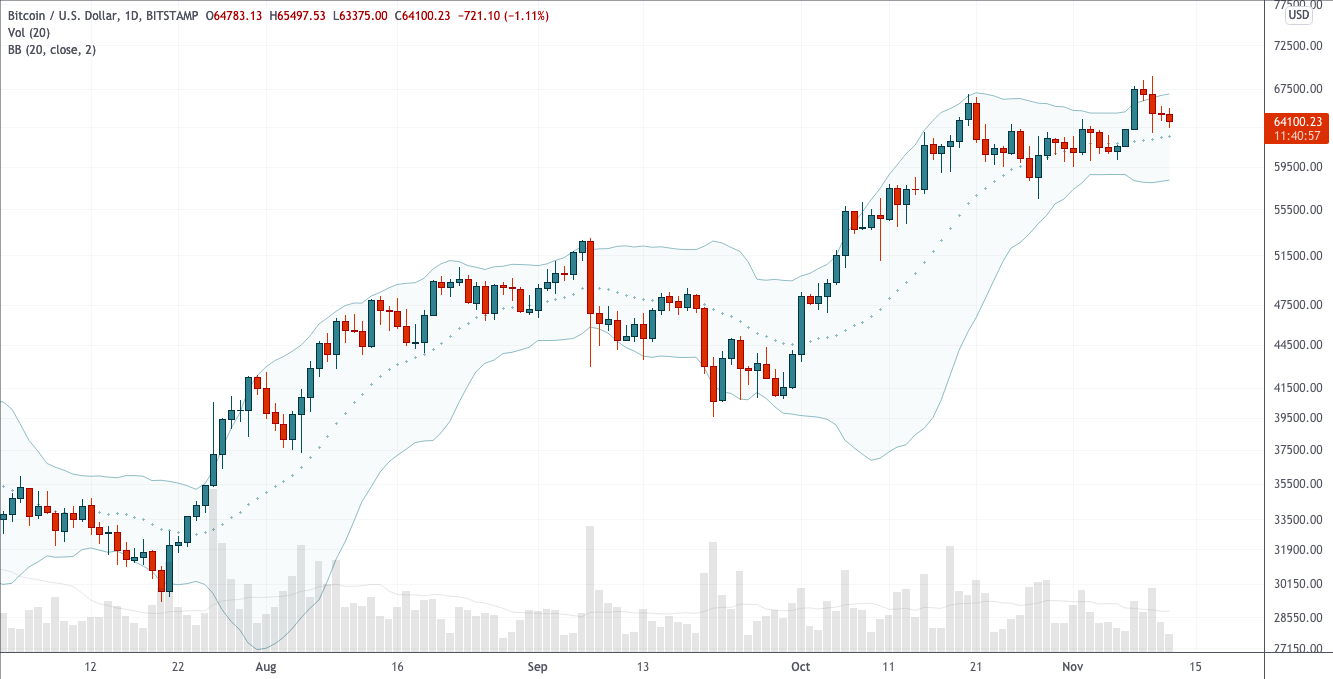
Chart executed in TradingView
As already discussed, the price has risen and overcomeresistance of the upper border of the Bollinger Bands. This usually causes the price to return to the bands before rallying higher along the upper border resistance, but nothing is certain. The central line of Bollinger Bands and the lower border of the indicator will provide support if the price continues to fall, so I do not expect quotes to go below 57-59k, which would be a very good correction for both price and leverage.
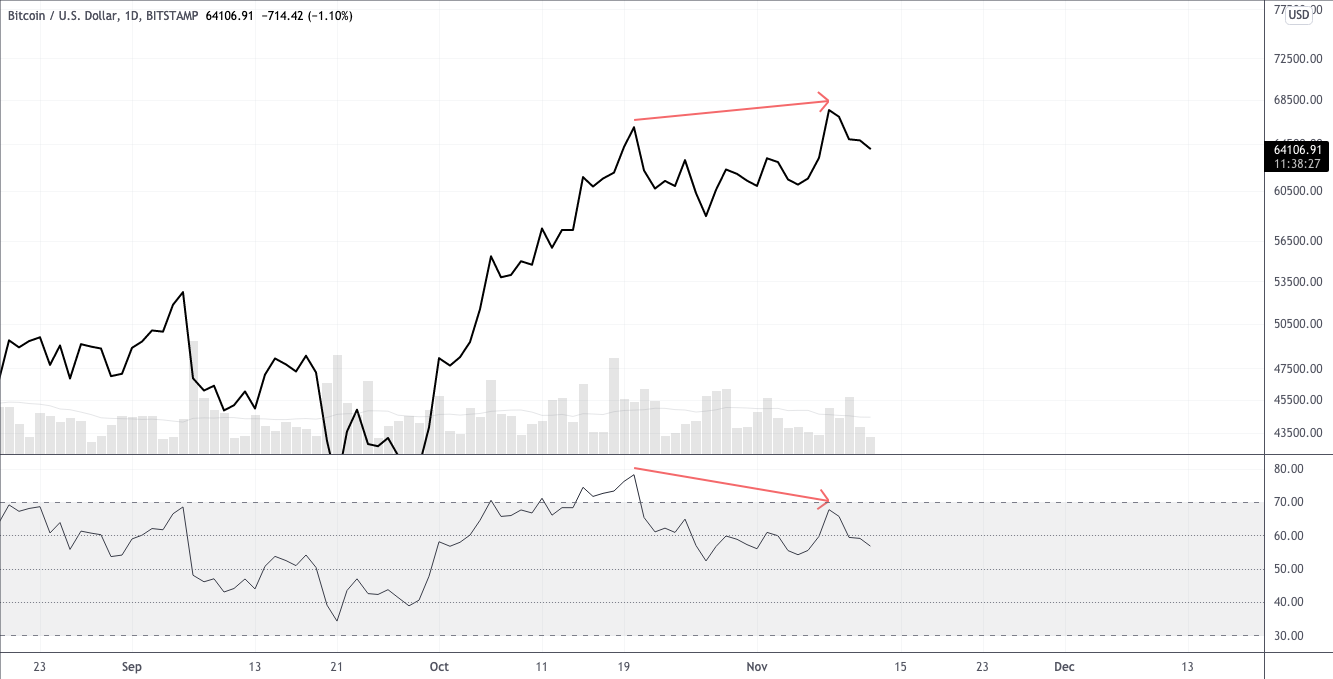
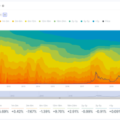
Chart executed in TradingView
Clearly overbought bearishdivergence on the daily chart, which also forms on higher timeframes. This is inevitable given how high the RSI has climbed in the past, so it doesn't really bother me.
Nevertheless, all this leads me to believe thatThe RSI could take another breather and move lower while the price is trading in a narrow horizontal range, and ultimately give out hidden bullish divergence.
Well, if there is a more serious fall, then I buy.
BitNews disclaim responsibility for anyinvestment recommendations that may be contained in this article. All the opinions expressed express exclusively the personal opinions of the author and the respondents. Any actions related to investments and trading on crypto markets involve the risk of losing the invested funds. Based on the data provided, you make investment decisions in a balanced, responsible manner and at your own risk.
Read this:
 Growth continues - technical analysis from November 8, 2021
 October did not disappoint. What can you expect now? - technical analysis from November 1, 2021
 Key point for the BTC market - technical analysis from October 11, 2021
 Asymmetric bets + technical analysis from November 5, 2021
 Market Trends Continue - Technical Review November 10, 2021
 Epic Rally Coming To Resistance - Technical Analysis Oct 07, 2021