Today we want to share with you the final article in the series dedicated to Bitcoin and its properties.Perhaps today's text will not be so much aboutBitcoin, how much is the whole world of finance. In addition, this article will present a rather interesting study of Parker Lewis, who at the time of the last financial crisis worked as an analyst at Deutsche Bank, and is now a partner in the consulting company Hayman Capital Management. If you are not afraid of long, but at the same time useful texts, then read on.
</p>Table of contents
Suddenly - Part 1: Bitcoin, not blockchain
Suddenly - Part 2: Here's what Bitcoin decides
Suddenly - Part 3: Bitcoin is not so slow
Suddenly - Part 4: Bitcoin doesn't waste energy
Suddenly - Part 5: Bitcoin Is Not That Volatile
Suddenly - Part 6: Bitcoin cannot be copied
Suddenly - Part 7: But first gradually…
The following study was written inOctober 2017, before the Federal Reserve System (FRS) began to reduce its balance sheet, and since then has not changed or edited. The task then was to understand the financial crisis and the impact of quantitative easing in an attempt to predict what can be expected when the Fed reverses quantitative easing. Parker worked on the study independently and concluded with recommendations to investors on how best to insure.
According to Parker, although the article has not been updated sincethe moment of writing, his fundamental views also have not changed. Moreover, he does not like it when research is rigged by new data, which often leads to a revision of history. Those who read the article today have more information than the author had at that time. After writing it, the Fed began to cut its balance, but in March 2019, it signaled a change in course.
We'll have to see if these views will passtest of time. It's unlikely that Parker would be right about everything, but the underlying narrative was clearly correct. The article claims that the Fed will change course faster than most believe (or believed), but if there was a way to rewrite the ending, Parker would definitely mention Bitcoin, because indeed, where this article ends, Bitcoin begins. One of the main conclusions that can be drawn is that future quantitative easing(Fed and other central banks of the world)there is no doubt about it, and this is the reason why Bitcoin exists.
The history of the last and next dollar crisis

Understanding the Fundamental Impact of Quantitative Easing and the Psychology of the Federal Reserve (Fed)(including its limitations, weaknesses and contradictions)allows us to anticipate the next steps of the Fed and theirimpact on financial markets. A black swan event is difficult to predict, but in retrospect it often appears more predictable than it actually was. The subprime mortgage crisis also seemed obvious in hindsight. The Fed subsequently created $3.6 trillion in digital dollars, increasing the dollar value of financial assets and enabling a major expansion of the American credit system.(net growth of 25% from the pre-crisis period to the present). It seems obvious now that when the Fed starts getting rid of this “temporarily” accumulated $3.6 trillion, the value of financial assets will fall(reverse order of operations)and the instability of the credit system will return. And much faster than the market expects. Risks are misunderstood and underestimated.
These risks are explained below and why the marketI am convinced that this time everything will be different. The analysis begins with a detailed review of current historical periods, starting with the so-called period of Great Moderation; the following is an assessment of the current economic situation, and in conclusion, recommendations are given on how to protect your wealth.
Background of the 2008 global financial crisis
: (Roughly) Daily
In the two decades leading up to the global financial crisis,US total debt grew almost 5 times from $ 11.2 trillion in 1987 to $ 52.5 trillion in 2007.During the same period, although nominal GDP tripled, it lagged significantly behind credit expansion, causing the total debt-to-GDP ratio to rise from 230% in 1987 to 360% in 2007.
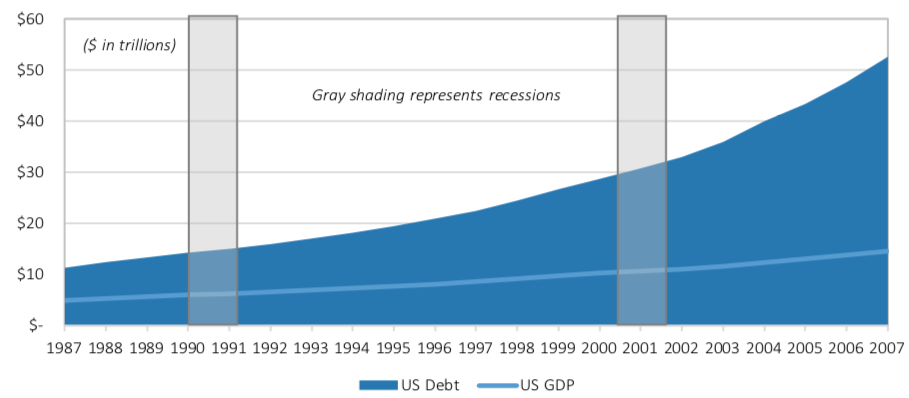
Fig 1.Debt of the entire US system (shaded segment) versus nominal GDP (line) — 1987-2007 Gray bars indicate periods of recession. : Fed data
Although the credit expansion was broad-based, it was predominantly driven by households(in particular housing mortgages)and the financial sector. The debt of these segments outpaced the overall average, increasing from 1987 to 2007. respectively, by 5.8 and 8.8 times, while the total systemic debt increased by 4.7 times.
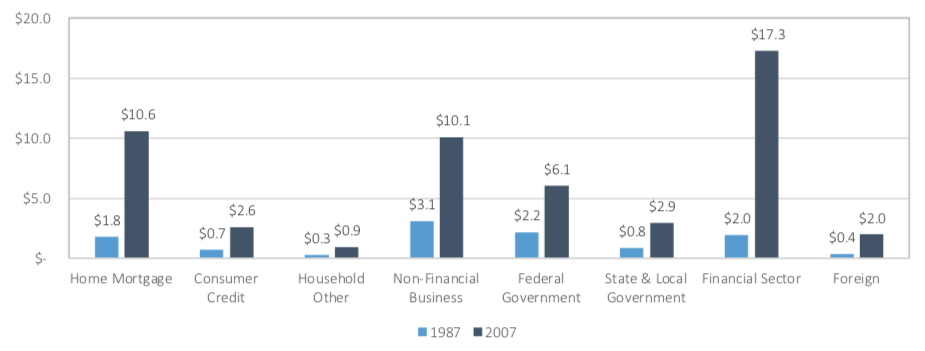
Fig 2.Debt in the economic sector: mortgage and debt of the financial sector, 1987 compared to 2007 : Fed data
Despite recessions in the early 1990s and early2000s, credit expansion continued unabated. During this period, credit creation was predominantly unproductive, with the non-financial commercial sector accounting for less than 20%. The shrinking returns were obvious, as every dollar of credit expansion resulted in very little GDP growth(credit growth exceeded GDP growth).
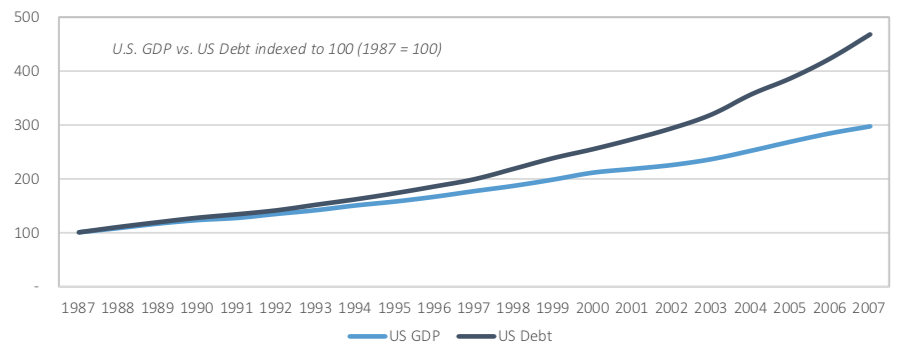
Fig 3.Declining yields: Debt growth (dark blue) outpaces GDP (light blue). : Fed data
When there was a recession in the economic cycle,The Fed has been aggressively cutting interest rates. Since the mid-1980s, the Fed has had only one policy response: cut interest rates to stimulate demand. Instead of allowing the credit system to naturally restructure, the Fed consistently created an environment in which more credit could be created so that existing debt levels could be maintained. Even as the Fed-fuelled lending was paying less and less, the Fed's response was more (not less) of the same. Every recession from 1987 to 2007 The Fed aggressively cut short-term rates: from 9% to 3% in 1991 and from 6% to 1% in 2001. With each cycle, the federal funds rate became lower and lower, never returning to its previous level.As the credit system grew larger and more demand was squeezed out, the increased burden of debt servicing became exorbitant.
Every time the Fed lowered short-terminterest rates, in order to stimulate the economy, this policy was carried out by increasing bank reserves (cash) in the system. If you increase the offer, the price should decrease. In this case, the Fed increased the supply of dollars, and the price of dollars (interest rates on loans) decreased. The mechanism for the Fed to increase the supply of dollars mainly came down to the purchase of US Treasury securities. With increasing liquidity (the supply of dollars) and sluggish economic growth, US Treasury securities (the global risk-free standard) became more attractive adjusted for risk, which provoked a decrease in long-term profitability. Since the rates on all risky assets are to some extent based on risk-free, and the supply of dollars thanks to the Fed has steadily increased, loans have become cheaper everywhere, which contributed to the continuation of a comprehensive credit expansion.
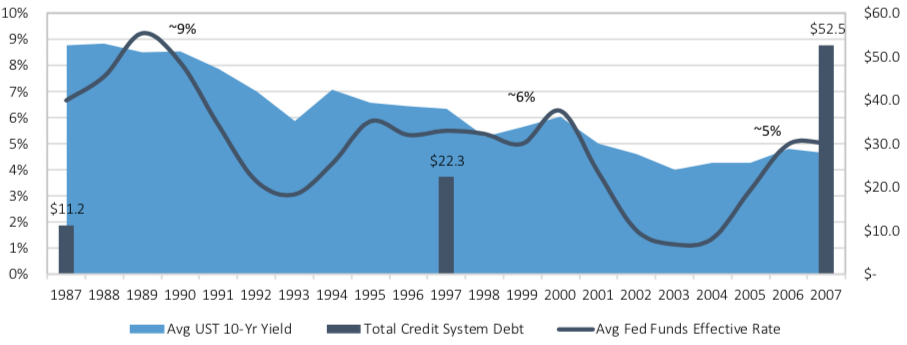
Fig 4.Suppressing volatility: lower interest rates, more and more debt. : Fed data
The new Fed regime in the 1980s determined that its courseprice stability implies reversing economic cycles, or at least their booms and busts. For this, the Fed had one tool: increasing the supply of dollars to lower interest rates and stimulate credit expansion. Despite periodic recessions, during this period the nominal annual GDP did not decrease in any year, which was a result of the quick and aggressive reaction of the Fed to lower interest rates.
Although until 2008 US nominal annual GDP has not declined since 1947 (60 years), the period from the mid-1980s to 2007 differed in how much credit growth exceeded GDP growth. During the period of substantial expansion from the 1950s to the 1980s, GDP and credit grew at a comparable pace. But something changed in the 1980s, and this was largely a consequence of the Fed’s doctrine change and departure from a reasonable monetary policy. From the mid-1940s to the mid-1980s, the ratio of US systemic debt to GDP was relatively stable at 1.5 (or 150%). In the 1980s, credit expansion, driven by the housing and financial sectors, marked the beginning of two decades, during which the ratio of systemic debt to GDP increased to almost 3.5 (350%).
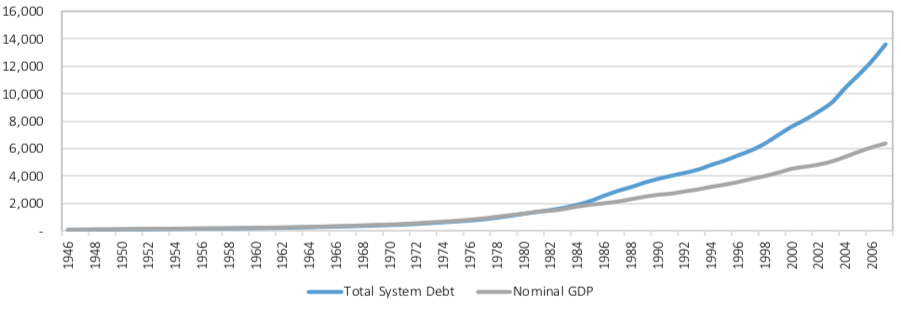
Fig 5.Something changed in the mid-1980s: productive or unproductive credit expansion? : Fed data
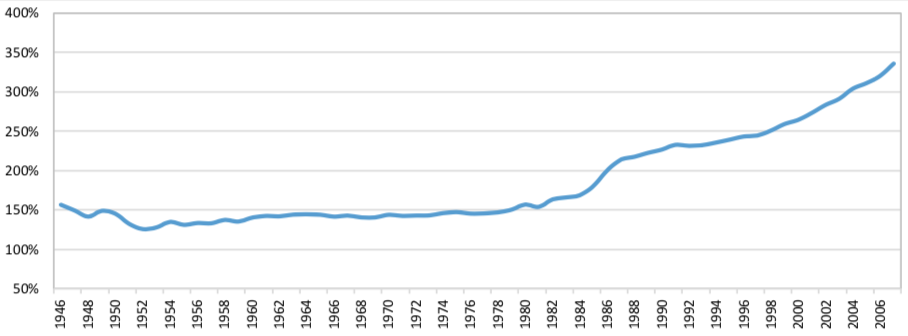
Fig 6.System-wide debt to GDP rises from 1.5x in 1980 to nearly 3.5x in 2007: Fed data
Over the past decades, individual companies andindustries were restructured, many companies and even industries disappeared, giving way to new ones. However, the economy as a whole was not allowed to restructure after periods when the credit system grew too quickly. By preventing systemic restructuring, the Fed, whether consciously or not, contributed to the imbalance. The overall imbalance gradually grew, and the credit system became increasingly unsustainable due to the failure of the underlying economic engine, masked by deficit-financed tax cuts, an artificial housing boom, and the Fed's eager injection of fuel. In 2007, after two recessions and two recoveries, interest rates were 50% lower than 20 years earlier. Since credit growth significantly exceeded GDP growth,the only practical way to maintainoverstated levels of credit there was an artificial suppression of interest rates. A collateral consequence of artificially low interest rates has been asset-backed asset bubbles.
Despite the creation of unstable conditions,Fed policy during this period is often praised for maintaining low volatility. Due to the low volatility of inflation and the overall observed volatility, this period is known as Great Moderation. In fact, Great Moderation was a great suppression. Central bankers suppressed volatility by consistently lowering interest rates and returning to basics from time to time. The Fed was convinced that a more “efficient” monetary policy meant creating conditions of low volatility that supported healthy economic expansion.
Ironically, the Fed's policy of suppressingvolatility through ever lower interest rates actually made a significant contribution to future volatility, which directly led to the global financial crisis - a period of violent volatility. Unfortunately, most economists and central bankers do not recognize this reality and are still blind to the causal link between the great suppression of being reassured and the strong volatility of the 2008 crisis. The following quote from the representative of the Federal Reserve Bank (FRB) Kansas City a look at the period from the mid-1980s to 2007 of most of the mainstream circles.
[7] “Great moderation from the mid-1980s to2007 was a favorable period of relative calm after the volatility of large inflation. Chaired by Walker (until 1987), Greenspan (1987-2006) and Bernanke (since 2006), inflation was low and relatively stable, while it was the longest period of economic expansion after World War II. Looking back, economists may disagree on the role that various factors played in the Great Moderation, but one thing is certain: the best monetary policy was key. Unfortunately, the financial crisis of 2007-08. and the subsequent great recession broke the lull of Great Moderation. An important issue for the Fed leadership - and all US and world politicians - is whether the violation that began in 2007 was a temporary episode, or does it reflect a transition to a more volatile economy in the future. " - Craig Hakkio, Kansas City Fed, Great Moderation
The prevailing economic discussions about thisperiod is not about whether the Great Moderation caused the global financial crisis, but whether the global financial crisis ended the Great Moderation. While central bankers and economists debate the extent to which the period of persistently low volatility before the crisis was due to“Better monetary policy”, it is necessary to discuss whether this policy wasthe cause of violent volatility and instability during a crisis. In 2004, before becoming chairman of the Fed and before the crisis, Ben Bernanke argued that the merits of an improved monetary policy were not sufficiently recognized.
[8] “Were the main cause of the Great Moderationstructural changes, improved monetary policy or just luck - an important issue on which no consensus has yet formed. I believe that the improved monetary policy has contributed not only to reducing inflation volatility (which does not cause any particular contradictions), but also to reducing overall volatility. Moreover, since the change in the monetary policy regime has a comprehensive effect, I believe that some of the consequences of improved monetary policy could be incorrectly identified as exogenous changes in the economic structure or in the distribution of economic shocks. This conclusion inspires me with optimism about the future, because I am sure that the monetary authorities will not forget the lessons of the 1970s. I am quite active in defending the opinion of improved monetary policy, because I believe that this explanation of the Great Moderation is not given enough credit in the literature. ” - Ben Bernanke, speech at the congress of the Eastern Economic Association, February 2004
Bernanke had no advantage at that timeretrospectives, but it’s still noteworthy that the future Fed chairman believed that the Fed creates conditions for financial stability, while in fact the opposite happened. In the midst of the crisis, the Fed reacted with the same policy (lower rates), confirming that it does not recognize that it was this unsuccessful policy of Great Moderation that provoked the instability of the financial system that led to the crisis.
Nassim Nicholas Taleb, author of The Black Swan (2007), and Mark Blythe in an essay comparing the conditions of the financial crisis with the Arab Spring("The Black Swan from Cairo")argue that suppressing volatility doesa world less predictable and less secure. Modern financial, political and social systems are extremely complex and interconnected. And the suppression of vibrations, according to Taleb and Blythe, makes such systems less stable and more fragile. While central bankers should have discussed how much suppressed volatility increased volatility and contributed to future volatility before planning unprecedented quantitative easing, these discussions were left to dissenters, the market, and the future of the American economy.
[9] “Complex systems with artificially suppressedvolatility becomes extremely fragile, while not detecting visible risks. They often become too calm and show minimal variability, while risks quietly accumulate beneath the surface. While political and economic leadership has stated their intention to stabilize the system by suppressing fluctuations, the result is usually the opposite. Such artificially limited systems become predisposed to “black swans” - that is, they become extremely vulnerable to large-scale events, significantly out of the statistical norm and, by and large, unpredictable for observers. Such conditions sooner or later lead to serious shocks, taking everyone by surprise and leveling the years of stability or, in some cases, making things worse than they were in the initial volatile state. The later the shock, the worse the resulting damage to economic and political systems ...
Variation is information. When there is no variation, there is no information ... As Jean-Jacques Rousseau wrote: “A little anxiety spurs the soul, and freedom does not contribute to the prosperity of the species.” Freedom brings unpredictable fluctuations. This is one of the properties of life: there is no freedom without noise - and stability without volatility. " - Taleb and Blythe, “The Black Swan from Cairo” (2011)
Looking back at history, one can convincinglyargue that the Fed created instability by suppressing volatility. In an attempt to smooth out economic boom and bust cycles, the Fed stimulated artificial demand by lowering interest rates. This demand initially came from interest rate-sensitive sources: long-term capital-intensive projects and durable goods(housing, factories, cars, etc.). As a result, it was squeezed prematurelyfuture demand, which naturally created an excess of supply in some cases or spurred consumption that would otherwise be unavailable, limiting future investment and future consumer spending. Instead of allowing the restructuring of excess supply and cancellation of bad debts, the Fed, with the slightest sign of economic slowdown, continued to lower interest rates more and more, extending similar cycles.
Before the financial crisis, the total outstanding debt of the American credit system rose to $53 trillion.(throughout the system, including the public and private sectors). At that time, the banking system and its $53 trillion in debt obligations were supported by only $350 billion in bank liquidity.(the ratio of system debt to cash, excluding derivatives, was approximately 150: 1). The unstable and fragile nature of this systemsupported by short-term finance markets. Every day, every available dollar was squeezed out of the financial system to provide liquidity where there was the greatest need for financing. During periods of calm in the markets, their participants remain highly inclined to provide short-term loans, since most of them do not need 100% of their cash reserves daily and short-term risks are limited. In short-term financing markets, lenders are usually banks or other financial institutions with an excess cash balance. Banks 'cash reserves largely represent deposits from consumers and businesses (i.e., banks issue short-term loans from their customers' deposits). This system works until a very small percentage of counterparties are unable to repay short-term loans or until a very small percentage of lenders stop providing liquidity to short-term markets due to fear of massive insolvency.
It is because of the structure of the financial systemthe subprime mortgage crisis was a match from which the flame ignited, and not the flame itself. The flames were a financial system overloaded with loans, where too much debt was supported by too few dollars. Each dollar has been loaned 150 times. When credit begins to decline, liquidity is given increased value and demand for dollars is growing. Consumers spend less and save more. Business cuts costs and reduces investment. Money circulation speed is falling, which is problematic for a financial system overloaded with credit, dependent on a free and fast flow of money. It becomes obvious that it is impossible to find enough dollars to pay off all existing debts denominated in dollars. A vicious and self-reinforcing cycle arises in which defaults lead to new defaults and a reduction in credit leads to a further reduction in credit. Since this happens suddenly and, by and large, uncontrollably, unemployment rises sharply, which adds even more fuel to the fire. The Fed met such an apocalyptic scenario in 2008.
The global financial crisis, or the dollar crisis

The difficulty is that throughout the crisis andafter him, the Fed again and again demonstrated that it did not fully understand the problems and consequences of its reaction. It is important that this is not just a statement of opinion, but a fact proven by time. Despite a misunderstanding of the consequences, the Fed pursued extreme measures to reduce short-term rates to 0% for seven years and create $ 3.6 trillion, having lost its balance sheet and increased bank liquidity by almost 10 times. These extreme measures were not taken in one fell swoop, and there were indications in the process that they were not working.
Despite the recognition that her actionsUnprecedented and experimental, and to the presence of empirical evidence that aggressive monetary easing does not work, the Fed's reaction was to do even more of the same: print more money and buy more mortgage-backed securities (supporting the housing market) and US Treasury securities (distorting everything risky assets in the world). Thus, the Fed not only pursued policies that it did not fully understand, but also created conditions in which an unstable credit system of $ 53 trillion could increase by 25%.
Despite the credit crisis, the credit system(not including derivatives) increased to $66 trillion in outstanding debt at the end of 2016, which is $13 trillion more than before the crisis. In the decade following the crisis, more debt was created than existed before 1987 ($11 trillion), a scenario that would simply not have been possible without the Fed's intervention.The Fed pursued such a policy because it had no other instruments.Printing money, mainly throughcreating bank reserves was all the Fed could do to stop the panic or stop the systemic pro-cyclical credit contraction. The Fed may use vague and obscure terms such as the target federal funds rate, open market operations, interest on short-term excess reserves, large-scale asset purchases, reverse repos, and quantitative easing. But in reality, the only way the Fed achieves its policy goal of easing monetary conditions is by increasing the money supply. The Fed's tools are inadequate, and its knowledge and understanding of the consequences is limited and insufficient.
Understanding the meaning of the Fed’s political decisions and the psychology of its leadership is critical to guide future consequences.
Although we have 30 years of history at our disposal,Light on the future is best shed by understanding the Fed's failures over the past decade, starting with the onset of the crisis, when most did not yet realize that a crisis was inevitable. In February 2007, subprime mortgages became a concern and the S&P 500 fell 5%. During the Fed meeting in March 2007, Chairman Bernanke admitted his confusion about the connection between subprime mortgages and the stock market.
[10] “I am puzzled by the quantitative relationship betweenproblems with subprime mortgages and the stock market. It seems to me that the amount at risk due to defaults on subprime mortgages is about $ 50 billion, which is very small compared to the capitalization of the stock market. It seems that the problem is largely due to poor insurance, and not to any fundamental indicators of the economy. Therefore, I am a little puzzled by whether this says anything about fundamental indicators and how it relates to the stock market. ” - Ben Bernanke, Fed Board of Governors Meeting, March 2007
The Fed did not regulate(and still does not regulate)separate derivatives markets, but regulatedfinancial institutions dealing in derivatives. Despite his oversight of these institutions and the risks to which their balance sheets were exposed, Bernanke did not have a reliable valuation of derivatives associated with subprime mortgages, and at the beginning of the crisis he repeatedly refused to acknowledge that it was a liquidity crisis and then failed to understand the extent of this liquidity crisis . This omission was a consequence of a general misunderstanding of why a credit system with $53 trillion in debt(not counting derivatives), supported by just $350 billion in liquidity, was fragile and vulnerable to bank panics at the slightest provocation(whether because of subprime mortgages or something else).
After the famous words of Bernanke in March 2007 that the subprime mortgage market is under control, in the summer and autumn of 2007 the building caused even more cracks. Bernanke's misunderstanding of the potential systemic risks and poor liquidity of financial markets became even more apparent in 2008, when market shocks accelerated. The chairman was unable to identify the dollar crisis either the day before or during the turmoil.
Bernanke's comments during various meetings, speeches and press conferences in January-July 2008:
[11] “The Fed does not currently predict a recession.” - January 20, 2008
“[American economy] has strong laborresources, superior performance and technology, as well as a deep and liquid financial market that is in the process of self-recovery. ” - January 18, 2008
“Over the past month, the risk of the economy entering a significant recession seems to have decreased.” - June 9, 2008
“State-funded enterprises are adequately capitalized. Collapse does not threaten them. ” - July 20, 2008
From peak to trough, the American stock market lost $10 trillion in value. Corporate bonds were sold, gold was sold, foreign currencies were sold.Everything served as a source of financing for dollarsbecause the whole world was in short supply of dollars.
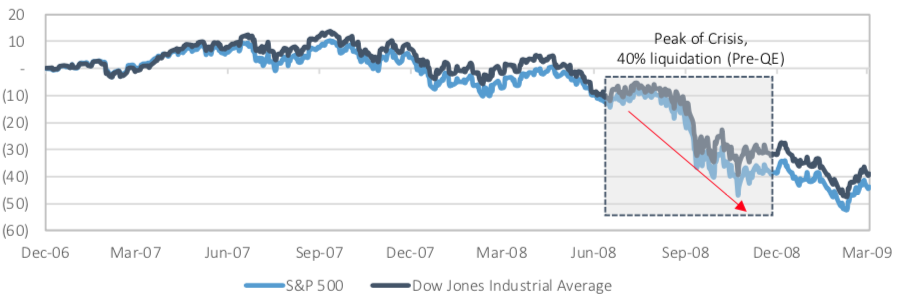
Fig 12.Sold Stocks: The stock market lost $10 trillion in value from peak to trough. : Fed data
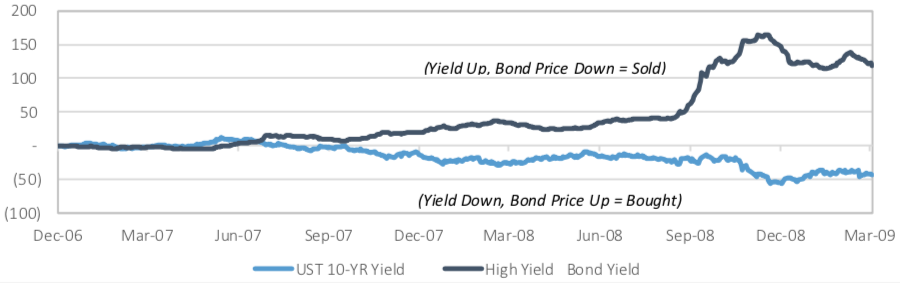
Fig 13.High yield bonds sold, Treasuries bought (in dollars): Negative yield bonds yield more than twice as much. : Fed data
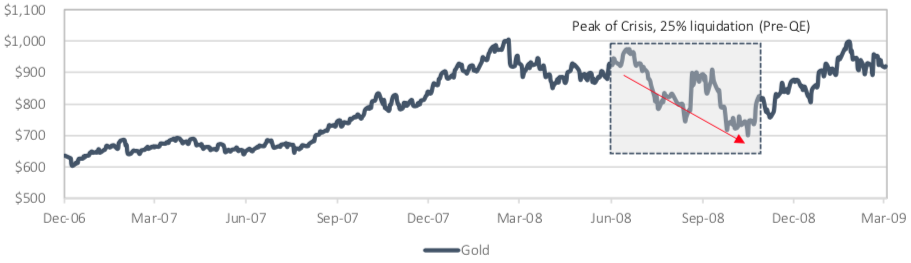
Fig 14.Sold Gold: The historic flight to safety resulted in a loss of about $1.25 trillion in purchasing power. : Fed data
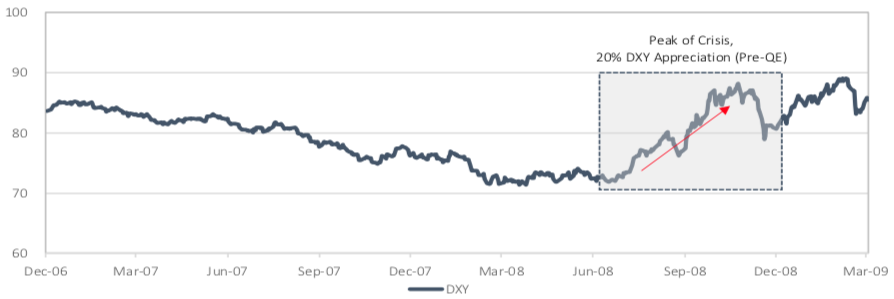
Fig 15.The dollar index is up 20% as currencies are sold to buy dollars. : Fed data
Everything was sold for dollars in order to finance dollar-denominated obligations.It is estimated that losses from subprime mortgagesaccounted for less than 0.5% of the stock market's losses. It was the dollar crisis that started with subprime mortgages. As Nassim Taleb would say, the system was complex and fragile. Attributing the crisis to subprime mortgages is like blaming the avalanche on a single shock that exposed the fragility of an unsustainable system.
Bernanke and the Fed fundamentally did not understand whyThe system structured this way experienced such a lack of liquidity. What seems obvious in retrospect was not obvious to the Fed, nor to the vast majority of market participants, who blindly ignored the risks of an over-leveraged financial system dependent on wholesale short-term funding. With $53 trillion in debt and only $350 billion in liquidity, how could the Fed chairman consider financial markets deep, liquid, or stable? The Fed believed that $350 billion in liquidity was sufficient because it viewed financial markets through the prism of the status quo of short-term financing and endless debt refinancing. The Fed has failed to recognize the unsustainable monster it has created.Since every dollar that existed in the banking system was loaned 150 times to create liabilities of banks and shadow banks, it was mathematically impossible to pay off all debts, and the Fed did not seriously consider the possibility or consequences of systemic deleveraging(leverage reduction).
The banking system wasa colossal game of musical chairs, and when the music stopped, everyone finally realized that the system lacked more than one chair. Not for every dollar, the debt expires on a particular day, or in the next 30 days, or in the next 6 months, or even in the coming year. This is far from the case. But when market participants realized the reality of the dollar deficit, the maturity of debts did not matter. Everyone needed dollars to pay off debts in the future and protect themselves from insolvency. At the same time, everyone was afraid of counterparty risks and insolvent borrowers. The consequence was the pursuit of dollars, and short-term financing markets ceased to function. Liquidity, which seemed deep to the Fed, evaporated because it was always an illusion. Short-term financing is a reliable source of liquidity only when demand is limited. When a need arises for a systemic scale, short-term financing cannot serve as a reliable source of liquidity, because it cannot be sufficient and a justified fear of insolvency is widespread. It follows that with systemic deletion, a systemic need for liquidity arises. In response to such an event, a liquidity crisis will almost certainly begin, no matter how deep or liquid the Fed considers the banking system.
Quantitative easing
Systemic deletion is extremely difficultthe consequences of the overload of the financial system with credit, and the risk of such an event exists today due to how the Fed reacted to the latest crisis. In response to the 2008 crisis, despite the fact that it took her by surprise, the Fed admitted that in order to prevent a massive credit collapse, extreme measures should be taken to stimulate “aggregate demand” in order to deploy an avalanche of contraction. Taking measures to inject short-term liquidity into the financial system in order to solve the liquidity crisis, the Fed kept the error that in order to solve a long-term problem, it was only necessary to lower interest rates to restart the economic engine. This time, this meant not only a reduction in short-term rates, but also a manipulation of long-term rates, and for this the Fed made large-scale asset purchases (quantitative easing).
There is a popular definition of insanity asrepeating over and over the same actions in anticipation of a different result. The Fed is guided by two main philosophies that prevent it from changing course. Firstly, the Fed is dominated by monetarists, convinced that the path to full employment is to increase the money supply (printing money), reducing the cost of each dollar relative to goods and services in order to increase dollar spending (aggregate demand). Secondly, the Fed created the problem with its failed policy. If she does nothing, it will become obvious that the king is naked, so it’s better to do at least something than not to do anything. Madness is encouraged by the popular misconception that printing money will help pay off debts (or make them sustainable), while in reality such a policy only contributes to creating even more volatile debts.
Accordingly, in response to the 2008 crisis The Fed has been doing the same as in the past two decades. Only this time she did it on a large scale. When the United States suspended the convertibility of the dollar into gold on August 15, 1971, effectively putting an end to the Bretton Woods system, the checks and balances of the otherwise independent Fed were removed. This opened the door for the unlimited and uncontrolled printing of Fed money. Alexander Hamilton, one of the founding fathers of the United States, supported the creation of a common national currency, but farsightedly warned of the risks that arise when this currency is not backed by physical money, in particular gold.
[16] “Issuing paper money by the government wiselybanned by individual states and the national constitution, and the US government should not neglect the spirit of this ban. Although paper issuance by the general authorities may have some advantages that are not inherent and free from some of the disadvantages inherent in emissions by the states, it is so prone to abuse - and it can be argued that such abuse is practically guaranteed - that the government will be wise if will not resort to such a seductive and dangerous remedy. In calm times, this may not have bad consequences, and, if properly managed, will even lead to something good, but in serious and difficult emergency situations it will almost certainly play a trick. Printing paper is much easier than levying taxes, so a government practicing paper issuing in such urgent situations is unlikely to refuse to go too far in using this resource to as far as possible avoid measures less favorable to its popularity. Even if this is not brought to an absolute bubble, then at least it will lead to a bloated and artificial situation that is incompatible with the regular and prosperous course of political economy. ” - Alexander Hamilton, Speech to the US House of Representatives
Although Hamilton could not imagine the complexityof the current financial system or the degree to which the Fed intervenes in financial risks, this founding father clearly understood the fundamental risks of an uncontrolled federal government and central bank. The Fed's response to the 2008 financial crisis was the culmination of a centennial distortion of fundamental principles and a final deviation from prudent monetary policy. At the peak of the liquidity crisis, in October 2008, with the often romanticized subsidies to banks designed by Ben Bernanke and Hank Paulson, a quantitative easing officially began. Over the next 5 years, the Fed implemented three quantitative easing programs that increased the Fed's balance sheet from $ 900 billion to $ 4.5 trillion.
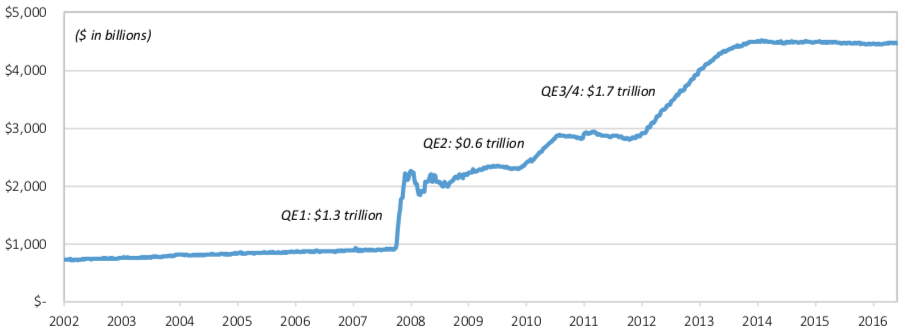
Fig 17.The Federal Reserve's quantitative easing programs are five times the size of the Fed's balance sheet. : Fed data
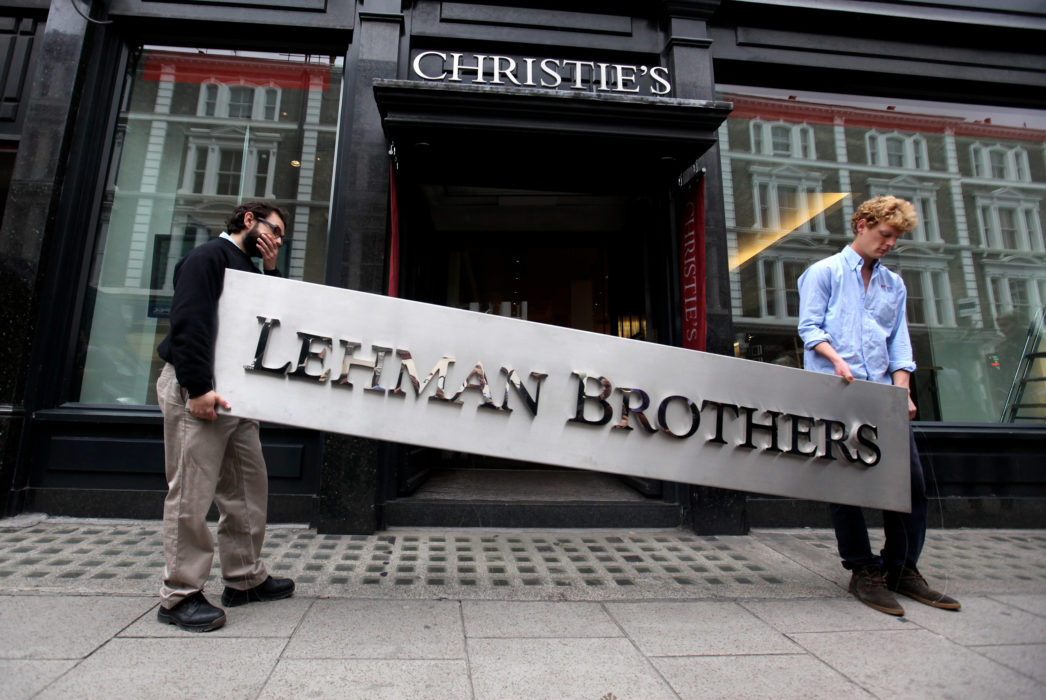
From the evolution of the Fed’s emergency policy, it’s obvioushow unprecedented and experimental her actions were. In 2008, the Fed lowered its key rate seven times, from 4.25% to 0%. She provided banks with up to $ 400 billion of liquidity. When the crisis spread to the whole world, the Fed expanded its existing dollar swap lines with the European Central Bank and central banks in Switzerland, Japan, Canada and the UK. She has created new swap lines for central banks in Australia, Norway, Sweden, Denmark, New Zealand, Brazil, South Korea, and Mexico. After Lehman Brothers was allowed to collapse, the Fed provided AIG with a $ 85 billion loan and, together with the federal government, designed $ 250 billion in subsidies for nine Wall Street banks and a $ 700 billion distressed asset repurchase program. After all urgent measures coordinated with the Treasury The United States and Congress-approved, the economy remained unstable, and the Fed considered it appropriate and necessary to start the first of three quantitative easing programs.
As part of the first quantitative easing of the Fedpledged to allocate $ 600 billion for the purchase of mortgage-backed securities and increase the purchase of US Treasury securities and bank bonds. By suspending the purchase of assets in June 2010, the Fed resumed it in August of the same year to maintain the overall balance after the expiration of the obligations held by the Fed. Since the recovery was at risk, the Fed subsequently authorized a second quantitative easing program to increase its balance sheet by purchasing another $ 600 billion from the US Treasury. in the second quantitative easing? If the actions taken in 2008 and 2009 showed that the financial system is unstable and unstable, then the need for a second quantitative easing raises questions about the effectiveness of the Fed measures.
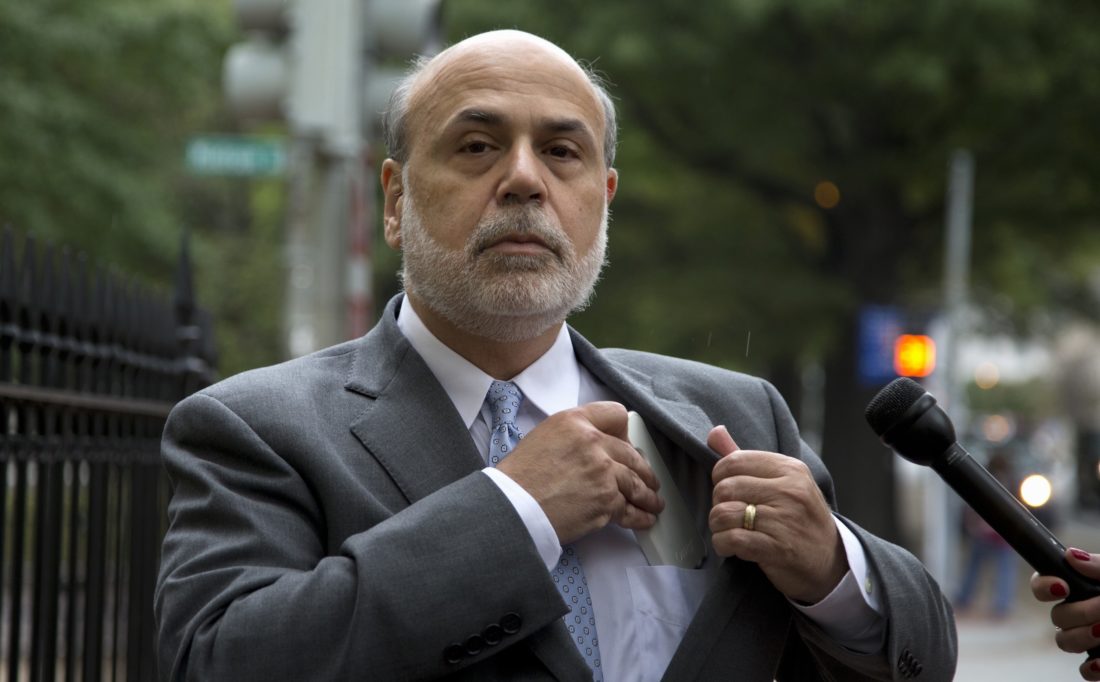
The operation to increase the money supply throughthe creation of bank reserves should be recognized as what it was: the creation of a situation incompatible with the regular and prosperous course of the economy (as Hamilton said). Instead, the Fed, led by the monetarists, was convinced that the most effective way to achieve its political goal of full employment was to continue to stimulate aggregate demand through monetary easing and lower interest rates. Following the approval of the second quantitative easing in November 2010, Ben Bernanke came to the 60 Minutes television show to assure the country that the Fed was in control and that the final round of balance sheet expansion was prudent and necessary. In that interview, Bernanke called what the Fed was trying to achieve with the help of the second quantitative easing: to further reduce interest rates. Bernanke also explained - for which he is often ridiculed - that the view that the Fed’s actions are tantamount to printing money is a myth.
[18] “There is a myth that we are printing money. We do not print money. The amount of currency in circulation does not change. Money supply does not change in any significant way. We lower interest rates by purchasing Treasury securities. And by lowering interest rates, we hope to stimulate faster economic growth. Thus, the main thing is to find the right moment to reverse this policy. And this is exactly what we are going to do. ” - Ben Bernanke, interview on the 60 Minutes television show, December 2010
Despite the nuances, the Fed is indeed physicallydidn't print money. When Bernanke explained that the amount of currency in circulation does not change, this was indeed the case. The Fed's balance sheet includes two main forms of liabilities: currency in circulation and bank reserves. The first is physical currency.(paper cash and coins)largely out of controlbanking system, and the second is the payment obligations of various banking institutions reporting to the Federal Reserve. Through quantitative easing, the Fed increased the amount of bank reserves, and unless those reserves were converted into physical currency, the liquidity created by the Fed remained in the banking system.And although the vast majority of marketparticipants consider Bernanke’s notorious comments either as intentionally misleading or as outright lies, what if the Fed didn’t really consider its actions printing money?
As Bernanke argued, the Fed's goal wasstimulating the economy by lowering interest rates. Since the Fed's short-term key rate was already 0%, the only way to achieve such a goal was to buy securities with longer maturities to influence long-term rates.Fed admitted that it is increasing the amountbank reserves and, as a direct consequence, dollar liquidity in the banking system, however, its purpose was not to provide liquidity, but to lower interest rates.The liquidity crisis has passed, and with it the need for more liquidity(from the point of view of the Fed). The second quantitative easing came down tomeeting target interest rates. In addition, the Fed considered its measures temporary. No matter how long the Fed’s balance sheet remains exaggerated, the Fed could reduce bank reserves as quickly as it created them, either by allowing the holding of securities to expire without reinvesting revenue, or by actively selling securities on the open market. With currency in circulation (physical cash) this would be impossible, and this is probably why the Fed considered its operations as something else and temporary.
The difference is subtle but critical: target interest rates against liquidity injections. The order of operations can be very similar and the boundaries are definitely vague, but here the psychology of the Fed's decision-making is clearly visible: the second quantitative easing is a continuation of the Great Moderation policy, which signals that, despite the volatility of 2008-2009, the Fed did not see the need for change of course. The years after the financial crisis should be the best time for introspection, but the Fed was either too blind or too stubborn to acknowledge the omissions of its policy. The implementation of the second quantitative easing confirmed this conclusion and launched a sequence of events unfolding in 2011 - events that significantly undermined the authority of the Fed.
If 2008 and 2009remembered as the peak of the crisis, 2011 turned out to be a critical indicator of what to expect in the future. During this critical but often overlooked year, the real economy deteriorated, the Federal Reserve's quantitative easing programs proved ineffective, and the fragility of the financial system became evident again. Carefully familiarize yourself with transcripts of Fed meetings for 2011.(which became available only in January 2017)shows that the Fed had limitedunderstanding the reasons. After 2011, any underlying assumption that the Fed understands the consequences of its policy decisions in financial markets or in the real economy is a willful ignorance of history.
During the Fed meeting in January 2011When the second quantitative easing was underway, the consensus was that the economy was improving and risks to the Fed's economic outlook were balanced or positive(i.e. the risk of failed forecasts was considered limited). The course of the second quantitative easing is quitesatisfied the Fed. During the next Fed meeting in March 2011, participants believed that the economy was still improving, but not at the fast as expected pace. At the next meeting in April, views on the economy were mixed. Some participants were concerned about the risks of recession, while others were concerned about the inflationary effects of quantitative easing. Nevertheless, the mood for economic recovery was positive enough to warrant lengthy discussions about how the Fed would tighten monetary policy when the time was right. By the June meeting, participants had noticed the recent weakness of the economy, since almost all of the incoming data was disappointing. Although the majority still believed that a moderate recovery was taking place, sentiments became noticeably more pessimistic, and the perception of the risks of the Fed's forecasts being unjustified increased. Despite the worsening economic prospects, the view on recovery remained unchanged, and in June 2011 the Fed completed the second round of quantitative easing, as planned, suspending a further increase in its balance sheet.
In a short period from the completion of the secondquantitative easing in late June until the next Fed meeting in August, the financial situation became noticeably more fragile. During the summer months, the American economy slowed and concerns about long- and short-term growth grew. The Fed acknowledged that "leverage and debt are slowing long-term growth" and flagged weak consumer spending as a particular cause for concern. At the same time, a confluence of global circumstances has further aggravated the financial situation. Europe was on the verge of a debt crisis, Congress was struggling to approve an increase in the debt ceiling, and S&P, amid troubles with the budget and the ceiling, downgraded the US credit rating of the debt. Conditions in the financial markets deteriorated so significantly and quickly that liquidity became a problem.

In just 8 months, the economy has gone from sustained improvement to moderate growth and then to rapid deterioration.It is especially noteworthy that such a rapid shifteconomic situation occurred when the Fed actively purchased $600 billion of US Treasury securities as part of the second quantitative easing. The extraordinary nature of what happened and when did not go unnoticed by the Fed. While the liquidity pressures and concerns eventually subsided without the Fed needing to resort to emergency measures, the problems were severe enough to spark debate about the sustainability of financial markets and the effectiveness of quantitative easing. The Fed's open market operations manager has repeatedly noted that the liquidity problems are suspicious and unexpected, given that the Fed has increased bank reserves to $1.6 trillion over two rounds of quantitative easing. Before quantitative easing, the Fed held only $10 billion in bank reserves, and there was approximately $350 billion in cash in the banking system. In August 2011, the banking system was supported by $1.7 trillion in cash, of which $1.6 trillion of bank reserves were kept at the Federal Reserve, but for some reason liquidity problems suddenly emerged. Before the crisis, Bernanke mistakenly believed that the financial system was deep and liquid. But after two rounds of quantitative easing, the previously misunderstood liquidity problem had to be solved by the Fed's response.
[19] “Regarding the issue of reserves, wewe see the emergence of pressure in terms of financing. We see a lot more discussion about the potential need for liquidity. I mentioned in my briefing that you can use currency swap lines, but in market reviews we see discussions about measures such as urgent auctions. So the liquidity pressure is very significant. And I consider it necessary to note that all this happens with $ 1.6 trillion of reserves in the system.
As I noted during the videoconference, the leapshort-term financing rates warned us of the likelihood of having to conduct repos to maintain federal funds rates in the target range of the Federal Open Market Committee (FOMC). This is an unusual outcome, given that the financial system has approximately $ 1.6 trillion of excess reserves. As a result, we did not need to carry out such operations, since the federal funds rate remained in the FOMC target range. ” - Brian Slack, Fed Open Market Operations Manager, August 2011
Again, the stability of the financial system was called into question even after the steps taken by the Fed. This further confirms two conclusions:1) perceived liquidity of financial marketsit will never be enough as long as leverage remains at an unstable level (at that time, the ratio of debt to cash was approximately 32: 1, $ 55 trillion of debt against $ 1.7 trillion of cash in the banking system); And2) It is difficult for the Fed to understand the liquidity risks inherent in financial markets because it considers liquidity through the prism of the status quo of short-term financing needs.
The shock was not only serious enough andunexpected to raise questions about how the short-term liquidity problem could have arisen, but Fed Chairman Bernanke was also forced to admit that doubts about the effectiveness of the Fed's policies are not unfounded. Despite the recognition that the Fed is unable to solve fiscal and structural problems through monetary policy and that the monetary base is not the main problem of the economy, Bernanke still believed that the Fed should act “painkiller” - to alleviate pain without addressing the cause of the problem. Even when the Fed is self-critical and honest about its limitations, it is still trapped in two bad options: to do something or not to do anything. What happens when force majeure meets a stationary object? In the case of the Fed, the answer was not to deviate from the course: strive for more, not less. This is partly a consequence of human nature (survival instinct), and partly the rationalization by the uncontrolled and unselected central bank of its irrational decisions. The result is short-term stability due to long-term sustainability.
: Washington Examiner
[20] “I am quite ready to accept the argument thatmonetary policy is not the main tool, that this is not the main problem of the economy, but we are obliged to do our best, to act soothingly, to help in any way we can, even if we cannot solve fiscal, structural and other problems. ” - Ben Bernanke, Fed Chairman, August 2011
At the same August meeting, the Fed was likeat least a few rational participants who are ready to admit, albeit in an unskilled and shameless manner, that the Fed pursues an extreme and experimental policy without a sufficient understanding of the relationship between the financial sector and the real economy and the impact on the economy of general deletion.
[21] “We resolutely moved in the wrongdirection. Jones Stevens showed at yesterday’s briefing how well we lowered our forecasts this year. I also want to emphasize that I believe that we have deep gaps in understanding the interconnections of the financial sector and the real economy, which in recent years have significantly affected our ability to predict the reaction of the real economy and continue to do so. This ignorance will unite us with the rest of our profession, but I am glad to see the enormous work being done on the board of governors, in the Fed and in our profession as a whole in an attempt to better understand the two-way relationship between the real economy and the financial sector. However, I believe that the available literature is still at a very immature stage. We have much to learn and learn in this regard. ” - David Wilcox, Fed Economist, August 2011
[22] “Regarding our view of the economy,then we constantly ask ourselves: what have we missed and how useful are our models of different difficulty levels in helping us understand what is happening in the economy? It seems to me that one of the issues that we do not understand too well concerns how the general deletion affects our models. The deletion definitely occurred in the consumer sector and in corporate loans, and now there is a significant deletion in the fiscal sector - that is, in the federal government and state and municipal governments. I would like us to study this in more detail. This can help us better understand what is happening with the economy. ” - Richard Fisher, Fed Manager, August 2011
After much discussion in April 2011 on the tightening of monetary policy and after the completion of the second quantitative easing in June 2011, the market and, importantly, the economy deteriorated so much that in August 2011 the Fed discussed liquidity issues and the potential need for further accommodative policies to support economic recovery. In September of the same year, Bernanke made comparisons from 2008, and the Fed decided to launch Operation Twist, an accommodation policy in which the Fed intended to sell short-term assets (for up to 3 years) for $ 400 billion to buy long-term assets (from 6 to 30 years), which was supposed to reduce long-term interest rates and signal the market that the policy would remain accommodative for some time.
[23] “The financial situation remains tense -even in some respects, recalling 2008, European problems with public debt and banks can be significantly aggravated, which can have serious consequences for the US financial system and economy.
I think the most important event of the summer wasthat signs of financial instability reappeared. Of course, we have not yet reached the level of 2008, but there seems to be a similar unfavorable feedback between the economy and the financial situation.
In my estimation, the instability of financial markets,increased spreads, falling stock prices, rising stock volatility - all this together represents at least one important reason why the expected rebound in the second half turned out to be weaker than we had hoped. The financial situation not only affected the well-being of households and, for example, the cost of loans, but it also led to an increase in risk aversion both in the markets and in the real economy, and affected moods. ” - Ben Bernanke, Fed Chairman, September 2011
Although the situation in the fall of 2011 also led to the consideration of additional quantitative easing, the Fed resisted the temptation to further increase the balance sheet, implementing a strategy to increase the terms of assets in its portfolio, hoping that such an accommodation policy would be enough to stimulate the economy, despite the growing pessimism regarding recovery.
[24] “I do not think that monetary policy inliterally completely ineffective. I believe that one can observe the effect on financial markets, which, in turn, should affect wealth, confidence and some other determining factors of expenditure and production. Since the spread of the effect is weak, this can serve as an argument for more, not less, stimulation. ” - Ben Bernanke, Fed Chairman, September 2011
Only in September 2012 The Fed decided that a third round of quantitative easing is needed to revive recovery, which approved the purchase of mortgage-backed securities worth $ 40 billion per month for an indefinite period. In December 2012, this amount was increased to $ 85 billion per month.($40 billion mortgage-backed securities + $45 billion US Treasury securities), again, for an indefinite period.The Fed only began reducing its QE3 asset purchases in January 2014. The number of securities purchased each month was gradually reduced until the purchases stopped in October 2014.From September 2012 to October 2014, the Fed actually created $ 1.7 trillion, increasing its balance by about 60%, from $ 2.8 trillion to $ 4.5 trillion.
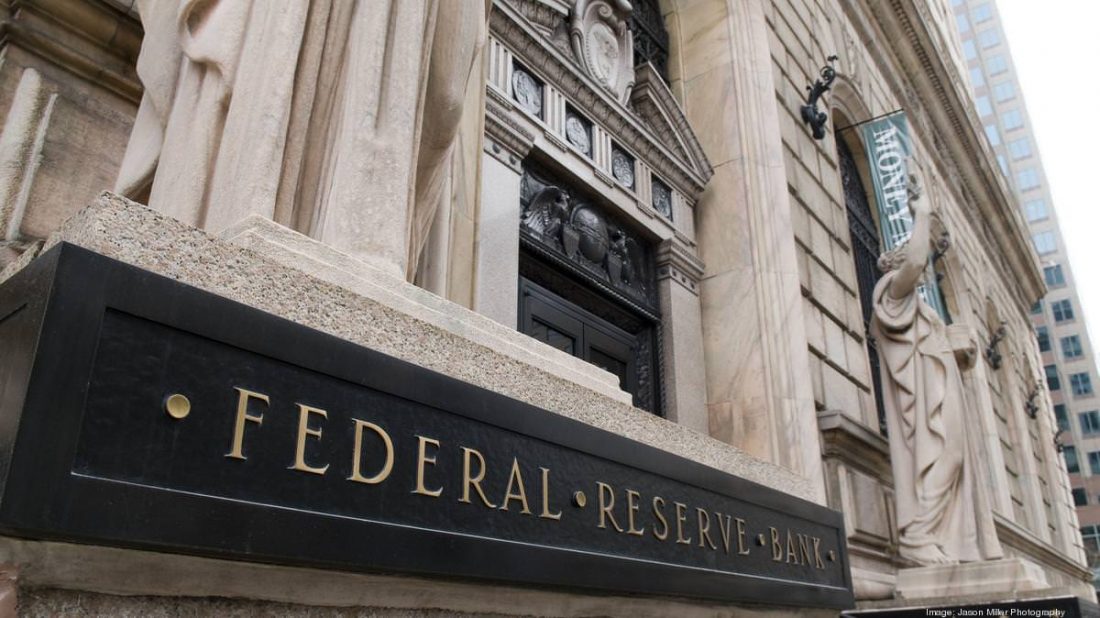
US Federal Reserve Building. : Time
The third quantitative easing is not remarkablybecause of its scale. It is more remarkable that the existence of the third quantitative easing spoke about the decision-making process of the Fed, about its judgments in general, temperament, inconsistency of policy and the ability to predict both economic indicators and the impact of its policy on the real economy. In March 2011, the Fed considered the second quantitative easing to be successful, with almost all Fed managers agreeing unanimously that there is a moderate recovery and that quantitative easing has the expected effect. In the fall of that year, it became apparent that the Fed was wrong. Economic recovery was at risk, and financial markets were again volatile, which once again confirmed the inability to predict the impact of their policies on the economic situation.
Many members of the Fed governing council, includingBernanke, recognized that monetary policy is not the main problem of the economy and that it cannot solve fiscal and structural problems. And the same people also doubted whether additional asset purchases could significantly affect the recovery of the economy. Despite historical data, recognition of its limitations and undisguised concerns about the effectiveness of the policy, the Fed decided that it was better to act “painkiller” rather than logical or rational. In its decision, the Fed was guided by the fear of the unknown, and not by a firm understanding of the consequences, which raised only more questions about the Fed's ability to judge.
Not only did developments in 2011 prove that the Fed was sticking with its policy, but the meeting transcripts also confirmed the Fed's fundamental psychology: something is better than nothing.(almost a verbatim quote from Bernanke). The Fed clearly recognized that its policieshas come to uncertainty and that there will almost certainly be unintended consequences. However, despite the general fear of inflationary effects and recognition of uncertainty and unintended consequences, the Fed has not conducted a thorough discussion or assessment of the possible negative consequences(at least nothing is known about this). She did not discuss the implications of the stimulusexpanding the credit system, which was already growing 200% faster than GDP, by another 25%. She did not identify all the economic imbalances that her policies could allow to persist and perhaps widen. She did not assess the ineffectiveness of the first two rounds of quantitative easing and did not justify how the third round would be different.Why?Because she couldn't do it.The Fed had a choice: more or nothing. By pursuing past policies without understanding the reasons for their failures and, therefore, the expectations for future success, the Fed has demonstrated a lack of the requisite judgment and temperament for the task with which it has been entrusted. The overall nature of the Fed has proven inconsistent with the board of directors of a multi-billion dollar corporation, yet it is entrusted with spending trillions of dollars.
Moreover, the Fed’s decision to expand purchasesmortgage-backed securities shed bright light on the degree of inconsistency of its policy. The Fed justified its initial purchases of mortgage-backed securities during the first quantitative easing by the need to improve the functioning of the critical market. Many Fed officials in 2011 expressed concern that the Fed was distributing loans instead of simply pursuing target interest rates, and advocated moving to a balance sheet consisting solely of US Treasury securities as soon as possible. The degree of concern varied, but most agreed. Since transcripts of the meetings for 2012 are not yet available, it is impossible to know exactly what has changed and what the nature of the discussions was. The minutes of the September 2012 meeting of the Fed only further emphasize the inconsistency of the policy and the contradiction between the concern over the Fed holding mortgage-backed securities in 2011 and the decision to significantly expand their purchases in 2012.
Despite the “stable” expectations of long-terminflation and an improving labor market, the Fed used the pretext of “medium-term” inflation lagging behind the required 2% threshold and the “slow pace” of labor market improvement to justify buying $40 billion of mortgage-backed securities per month for an indefinite period. This decision led to the purchase of mortgage-backed securities totaling $1.1 trillion, on top of the $600 billion purchased under the first quantitative easing. Although it was noted that one member(Richmond Fed Chairman Jeffrey Lucker)voted against“Because I considered it inappropriate to support a particular sector of the economy”, no one explained why this is still appropriate, as it was not recognized that concern was not limited to this.
[25] “Members generally continue to predict that, with stable expectations of long-term inflation and a current lull in resource use, medium-term inflation will be below target 2%.
During discussion of further monetary policyMembers mainly expressed concern about the slow pace of improvement in the labor market, and all but one agreed that the outlook for economic activity and inflation required additional monetary accommodation. Members agreed that such accommodation should be provided by strengthening further policies on federal funds rates and purchases of mortgage-backed securities of $ 40 billion per month. Together with current purchases of long-term Treasury securities by $ 145 billion per month, as part of an asset expansion program announced in June, these purchases will increase long-term securities reserves by $ 185 billion per month by the end of the year, which should put downward pressure on long-term interest rates, support mortgage markets and help improve overall financial conditions. ” - Minutes of the Fed meeting, September 2012
The Fed believed that direct purchases of mortgage securitiessecurities will contribute to a more effective implementation of its monetary policy. Household welfare is largely related to the cost of housing, so if the Fed manipulates the housing market to support rising housing prices, the perceived welfare of households will increase, and with it consumer confidence, which will stimulate credit creation, consumer spending and aggregate demand, which, according to the Fed, is the best way to achieve full or maximum employment. In general, the Fed has manipulated markets that would have been volatile without it. She did this with poor judgment, inappropriate temperament, incorrect decision-making, inconsistent policies, and an inability to accurately predict or evaluate the effects of quantitative easing.
Current precarious state of affairs

: Unsplash
Throughout the extreme political experimentFed policies over the past decade, inflation has been a clear danger that the Fed has consistently recognized. With every accommodative policy decision, there has always been concern among Fed members about the impact on inflation.How did the Fed manage to lower interest rates to 0% for seven years and print $ 3.6 trillion without creating unbridled inflation?Despite the Fed's Herculean efforts, the underlyinginflation of personal consumer spending stubbornly remained in a narrow corridor of 1-2%: low inflation volatility is exactly what the Fed wanted. And this despite all the extreme measures that everyone considered inflationary. Why didn't quantitative easing cause inflation?
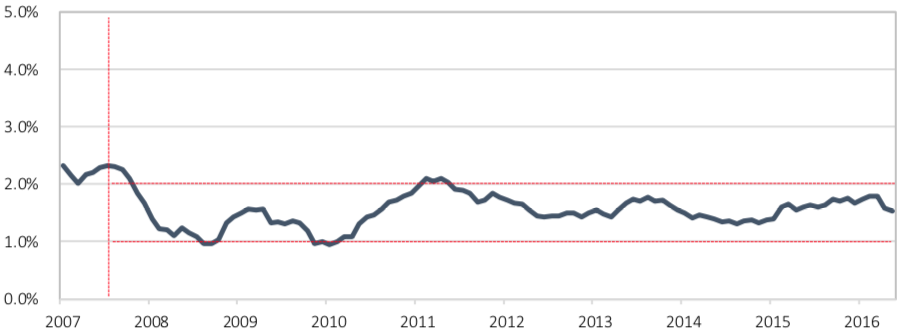
Fig 26.Payoff from the Great Moderation: Personal consumption spending on essential goods and services remains in a tight range year after year. : Fed data
The main reason: debt and leverage.Although there were periodic comments about debt levels being a drag on growth, the Fed and the market did not seem to see a direct connection between the leverage of the credit system and the lack of increased inflation in response to Fed policy decisions. The connection between systemic leverage and the lack of success of Fed policy in stimulating higher growth has also been elusive. In the two decades leading up to the 2008 crisis,The Fed contributed to excessive leverage, not only prematurely squeezing a huge portion of future demand, but also encouraging households, governments, and corporations to incur excessive debt.
When the Fed was creating bankingreserves to soften financial conditions, its policy was to contribute to the creation of additional credit (debt), in which it was successful, additionally creating $ 13 trillion of net debt from 2007 to 2016. Unfortunately, 70% of the net generated debt accounted for the expansion of unproductive government debt, since the demand of the national private sector for credit was predictably weak, because households and corporations were overloaded with debt at the beginning of the crisis and could not pay it off.
The Fed with its reflexive policy actuallyprevented the restructuring of this pre-crisis debt. In response to the Fed’s extreme measures to stimulate credit and aggregate demand, the entire national private sector created only $ 2.4 trillion of net new credit, while the public sector allowed its debt to grow by $ 10 trillion. The private sector acted rationally, responding to the reality of the imbalances that existed before the crisis due to unstable debts and did not go anywhere, while the public sector, with the help of the Fed and money brokers, took loans to the maximum, which only an irrational participant in the economy can do.
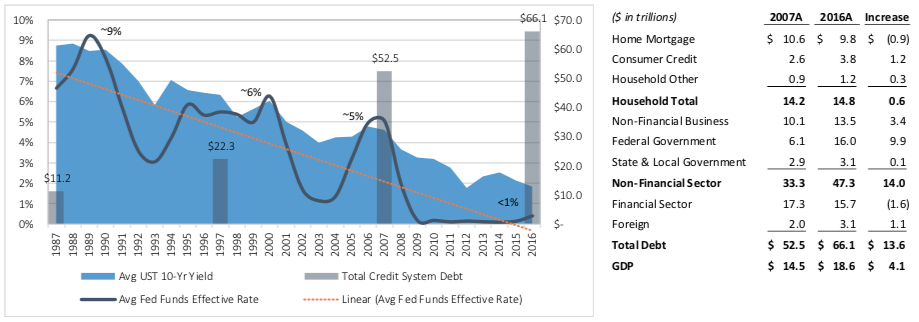
Fig 27.Lower interest rates = expanded credit system and increased government debt. : Fed data
A net unintended consequence of Fed policythere was a worsening of existing imbalances and the creation of new ones due to the expansion of the credit system, which was already unstable in 2008. Most notable are the imbalances in the housing and labor markets. Before the crisis, the share of those who own their own home, according to the US Census Bureau, was 69%, and in 2017 - 64%. While the number of households increased by 6 million(from 112 million to 118 million), the number of households with their own housing fell by 2 million(from 77 million to 75 million).
Over the same period, household mortgage debt outstanding fell by $900 billion.(from $ 10.6 trillion to $ 9.8 trillion), while the level of economic activityof the population dropped from 66.2% to 62.9%. Despite these statistics, which should be negative for the housing market, the Federal Housing Finance Agency's National Home Price Index is about 3% above the previous peak. Given the pre-crisis imbalance in the housing market (supply exceeding demand), coupled with lower economic activity rates, home ownership rates, and overall financing levels (less mortgage debt), we would expect home prices to be lower, not higher.Would it be possible without the Fed buying mortgage-backed securities worth $ 1.7 trillion with constant reinvestment?
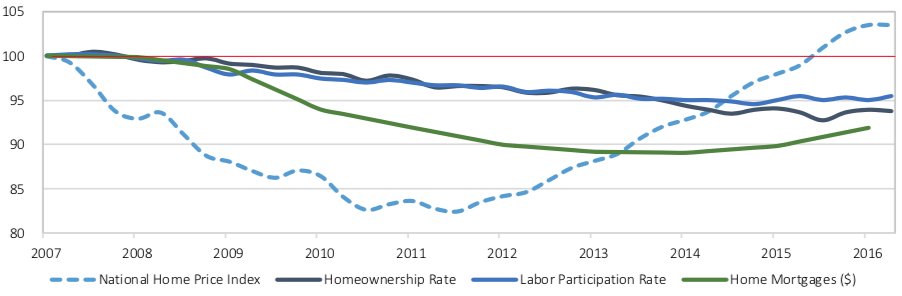
Fig 28.Home price index compared to home ownership rate, economic activity rate and mortgage debt. : Fed data
Imbalances are evident not only in the housing market,but also in the labor market. In particular, there is a significant imbalance between relative prices and relative wages, which is partly due to a decrease in the level of economic activity of the population. The level of economic activity of the population is calculated as the ratio of the civilian labor force(employed + unemployed, actively seeking work)to the working age population,defined as the population over 16 years of age, including pensioners. Despite the decline in the level of economic activity of the population, the labor force increased from the pre-crisis level by 5.7 million(from 154 million to 159.7 million), and the net employment level(created jobs)also increased by 5.7 million.
However, the working-age population in the United States increased by more than 21 million during the same period.(from 233 million to 254 million). Although a 3.3% decline may not seem like muchsignificant, if the current level of economic activity of the population were equal to the pre-crisis level, then the labor force would include 8.4 million more workers than today (i.e. it would be 168.1 million, not 159.7 million). The conclusion is thatout of every 4 people of the working-age population growth, only one works and in total 8 million more Americans should work.
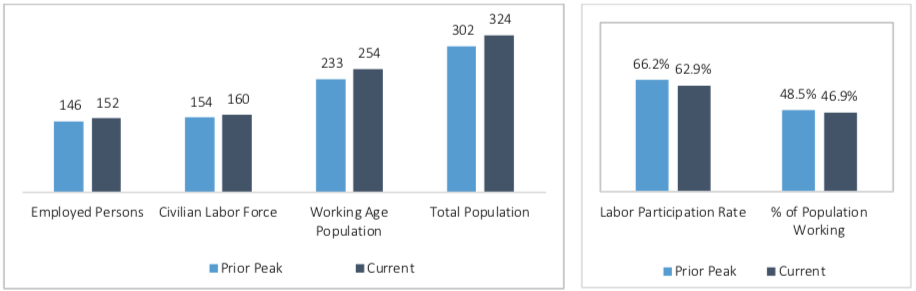
Fig 29.Civilian labor force: Labor force participation rate decreased by 3.4%. : Fed data
Still aggravated by the fact that agingthe population, often accused of reducing the level of economic activity, although it is a problem, it is far from the only acting factor. The decrease in the level of economic activity covers all demographic groups, according to the latest data from the Bureau of Labor Statistics, which tracks the level of economic activity from 2004 to 2014. During this period, the level of economic activity of whites, African Americans, Asians and Hispanics has decreased by at least 2%. Similarly, in each group, the level of economic activity of both men and women decreased, and for men, the decline is sharper. However, the most worrying is the data on age groups, since the level of economic activity has decreased just among young people (16-24 years old) and among middle-aged people (25-54 years old), who constitute the core of the workforce, while older people (55+) he grew up. In 2014, there were 2.4 million fewer Americans aged 16 to 54 in the labor force than in 2014.
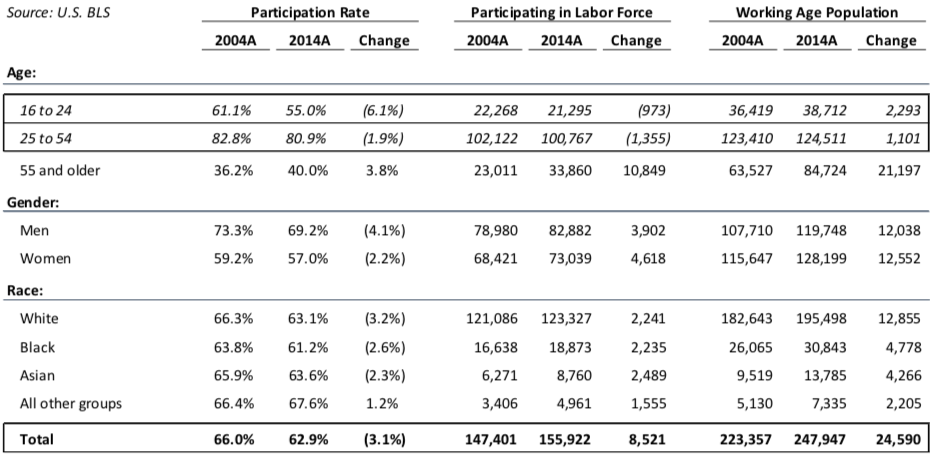
Fig 30.A lost decade among a core group of the labor force: the decline in the number of workers aged 16-54 from 2004 to 2014. : US Bureau of Labor Statistics
Despite the imbalances evident in housing marketsand labor, the S&P 500 and the Dow Jones Industrial Average are about 50% above their previous peak in 2007. As is well known, wealth effects tend to be procyclical. Rising housing costs are reflected in rising household wealth, and falling interest rates are reflected in rising prices of financial assets (stocks and bonds), which also pushes household wealth up. Both effects feed off each other, leading to greater propensity to take risks. Evidence of this is that household assets based on the stock market have risen to $40 trillion, up $15 trillion (60%) from the previous peak in 2007, while home prices have reached historic highs. Total household net wealth, as estimated by the Fed, is $30 trillion above its 2007 peak, a consequence of the Fed's creation of $3.6 trillion through quantitative easing despite declining labor force participation rates and stagnant real wages.
Ultimately, price levels(and perceived dollar fortune)depend on the Federal Reserve and can only be supportedtemporarily while the already bloated credit system continues to expand. The Fed intended to stimulate asset prices, and it succeeded, and quite strongly. Unfortunately,everywhere in the Fed markets caused distortion, albeit inadvertently, in an attempt to stimulate growth.
The Fed did everything it could to fuelcredit expansion, without a clear understanding of the imbalances created in the housing and labor markets or financial markets. However, the credit-driven recovery of the last decade is not fundamentally different from the 20 years before the crisis. The Fed has responded the same way for 30 years. Apart from its more significant scale and timing, the policy of quantitative easing is no different from the policy of the Great Moderation. Butthe risks are greater since the Fed led us all further along the same ledge.
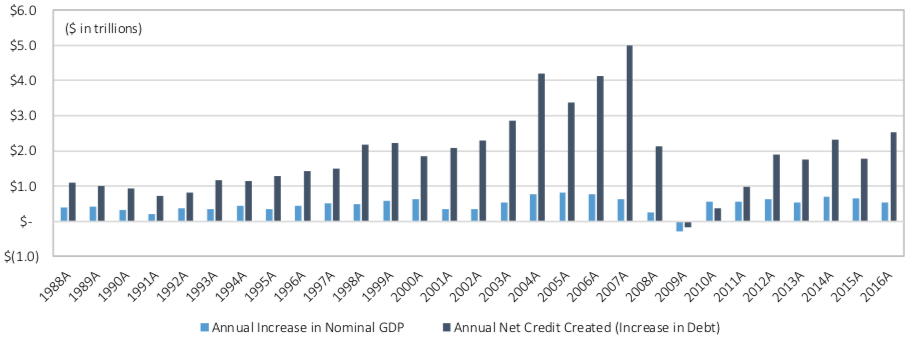
Fig 31.The last thirty years of Fed policy:debt growth outpaces GDP growth. Banking system cash (green) and bank reserves (light blue) versus system-wide debt (blue). : Fed data
In 2007, after two decades of the Fed continually making credit cheaper, every dollar that existed in the system had been lent out 150 times.($ 53 trillion of debt versus $ 350 billion of cash in the banking system), without taking into account the influence of derivatives.Today, as a result of the Fed increasing the amount of bank reserves through quantitative easing by almost $3 trillion, net system leverage has declined. However, gross leverage increased substantially for the same reason, as the Fed's low interest rate policies spurred further credit expansion. After several quantitative easing programs and changes in Fed commitments(when bank reserves were converted into physical currency that is beyond the control of the banking system)The existing $ 66 trillion of liabilities is supported by just $ 2.3 trillion of cash in the banking system.
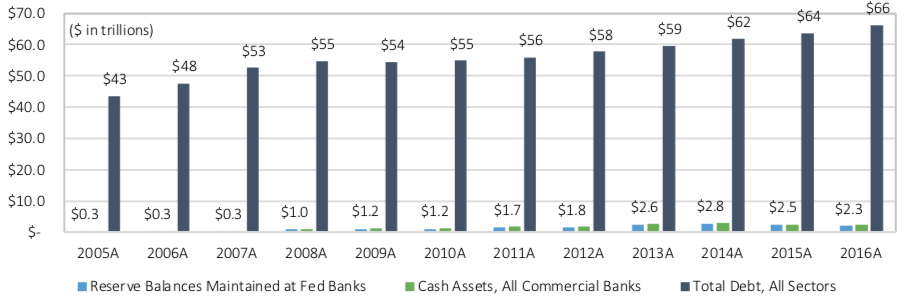
Fig 32.Overleveraged banking system: $30 of debt for every $1 of bank liquidity. : Fed data
At the moment, total cash in the banking system is almost $2 trillion higher than the level at the beginning of the crisis. But even after the Fed increased the amount of cash in the banking system by 6 times(from $ 350 billion to $ 2.3 trillion), every dollar that exists in the banking system today is lent out nearly 30 times. Over the past decade, it has been prematurely squeezed outeven more future demand as more credit was created. Leveraging the credit system and decades of squeezing out future demandrestrain the economy and hinder more sustainable and productive growth, which leads to a divergence of fundamental economic indicators and the value of financial assets (stocks and bonds), - such a status quo is possible only under mild financial conditions.
The same leverage dynamics explains whyFed concerns about inflation have almost always been false. Inflation actually depends on the balance or imbalance of aggregate supply and aggregate demand, and the Fed has distorted both supply and demand over an extended period. When aggregate demand exceeds aggregate supply, inflation occurs, either as a result of excess of growth in demand over supply growth (demand inflation), or as a result of supply shock (cost inflation). When aggregate demand lags behind aggregate supply, deflation follows.
Fed policy has created both inflationary anddeflationary pressure, as it stimulated spending on consumer goods (demand) and capital projects (supply), lowering interest rates. Low interest rates usually stimulate the consumption of goods and capital projects that are sensitive to long-term financing (i.e., there is a transfer of long-term supply and demand, which initially has an inflationary effect). If we talk about consumer spending, this implies, for example, housing and cars. With regard to investment, this implies the expansion of supply chains and production capacities. The growth of first-order activity leads to wider second-order economic effects (retail, hotels, restaurants, etc.).
: Shutterstock
However, Fed policy caused a shift in long-term demand and an expansion in supply. At the same time, the offer has expanded not only in the United States, but throughout the world. Because thedollar - the main currency of financing on the planet, the Fed's policy of constantly reducing pricesdollar financing, coupled with the effect of fiscal policy, has helped accelerate the globalization of supply chains, further expanding and diversifying supply. The increasing fragmentation and volume of global supply chains has created an environment in which widespread pressure on price levels is quickly becoming apparent as global demand predictably slows after years of delays. Thus, the Fed has created an environment where current demand is weak and existing supply is more than sufficient.The cumulative effect, after the initial transfer of demand, is constant deflationary pressure, and the only thing the Fed fears more than inflation is deflation.
When the credit system expands, i.e. when a new loan is created, the inflationary effect is due to the transfer of demand, but when the credit system is compressed, the opposite is true. When the motivation from both the demand side and the supply side is distorted due to the Fed’s low interest rate policy, the likelihood of a more significant imbalance of supply and demand due to the irrational distribution of capital increases. The Fed refuses to recognize how much imbalance it created in the credit system and in the corresponding supply and demand structure. The effect is cumulative, and with a limited understanding of the extent of the imbalance due to the impossibility of quantifying it, the Fed is now afraid of the inflationary impact of its policy, while it should focus on risks to financial stability.
Fed Executive Daniel Tarullo. : Project syndicate
In 2011When the Fed completed its second quantitative easing, there were signs of a slowdown in the economy, but many Fed employees were still worried about second-tier inflationary effects from creating more than $ 1 trillion. In an attempt to understand the story, Fed manager Daniel Tarullo re-read the transcripts of the meetings for 2005 and 2008 to find out how the Fed was evaluating inflationary pressures at the time and how this influenced political decisions. In a 2008 analysis, Tarullo found that the Fed underestimated financial risks and was overly worried about inflation. Although Tarullo did not find the missing link, he nevertheless urged the Fed to question its basic assumptions about what drives balancing pressure.
[33] “I reread the transcripts of FOMC meetings formid-2005 and for the whole of 2008 - periods of strong growth in oil prices and, to some extent, other commodity resources, to see how the committee evaluated what was happening and whether this experience could teach us something ... I just emphasize what can happen and what can be learned from the transcripts. Concerns over the prices of commodity resources, in particular reports about what businesses say, and they were in 2005 and 2008. there were many, they sound something like this: “A shift has occurred. Now we are reasoning in terms of inflation. ” And, of course, after about six months, this was no longer the case ... And I think that the transcripts for 2008 deserve more attention. I must say that I was struck by the relative underestimation of financial risks and the relative increase in inflation risks in mid-2008. ” - Fed Manager Tarullo, August 2011
Tarullo also stressed the concern thatThe Fed's thinking of 2008 repeated in 2011. In the first quarter and summer of 2011, there were concerns about inflation. In September, Bernanke made a comparison with 2008. A similar dynamic is unfolding today. The Fed held a meeting on February 1, 2017, and on February 14, 2017, Fed Chairman Janet Yellen addressed the Congress. Yellen signaled to the market that raising rates in March is possible, but unlikely. But suddenly, in the last week of February, several Fed managers began to signal the market about the upcoming March rate hike. In the week following Yellen’s speech in Congress, the probability of a March 15 rate hike was less than 30%. But in the first week of March, this probability increased to 90%, and the Fed eventually really raised rates by 25 basis points (bp).
What changed that caused the Fed to unexpectedlysignal a March increase? Meeting minutes play down inflation fears, but history suggests the Fed was afraid of falling behind trend as market expectations for wage inflation rose substantially. Accelerating rate hikes(1 increase in 2015 and 2016 versus 3 projected in 2017)and signaling a short-term contractionbalance sheet (gradual tightening), the Fed clearly expressed concern about the overheating of the economy, rising inflationary pressures and falling confidence in it after eight years of easy money.
As often happens in the Fed, among its employeeswere dissenting, but they remained in the minority. In this case, as evidenced by the minutes of the Fed meeting in March 2017, disagreement was expressed by the Chairman of the Federal Reserve Bank of Minneapolis Neil Kashkari, since “the latest data did not indicate further progress in achieving the goals of the committee and, therefore, did not provide convincing arguments in favor of a solid monetary policy” .
Shortly after the March meeting of KashkariHe detailed his views on the current state of the economy in a blog post written to refute statements by JPMorgan CEO Jamie Daimon, who stated in a letter to shareholders that regulators put forward excessive capital requirements for banks, which impedes lending, which could stimulate economic growth. Although not recognizing the Fed's role in squeezing decades of spending prematurely, Kashkari, refuting Daimon’s statements, correctly pointed out the lack of fundamental demand for new loans.
[34] “Daimon claims that the current requirements forlimited lending to capital and hurt economic growth, but also points to JPMorgan buying back $ 26 billion in stock over the past 5 years. If JPMorgan really had a demand for additional loans from creditworthy borrowers, then why did it refuse these borrowers and chose to buy back its own shares?
In fact, the cost of lending forhomeowners and businesses are record low. If loans were in short supply, then borrowers would compete for them, which would push the cost up. But this is not observed. ” - Neil Kashkari, Chairman of the Federal Reserve Bank of Minneapolis
Fundamental indicators begin to respond to the Fed weakening
Although the Fed has at least one vote, rightfeeling fundamental problems, she once again fell victim to false growth signals. By raising rates in December 2016 and March 2017, the Fed signaled economic strength and remained true to its course of tightening. Over the same period and subsequent months, economic data weakened, as did market expectations for growth. GDP growth in the 1st quarter In 2017, seasonally adjusted 1.2% indicated a slowdown in expansion from the second half of 2016. Car sales continue to disappoint, showing an annual decline in each of the first 8 months of 2017. Although employment data remains positive, bank credit expansion continues slow down with rising interest rates, delays on the part of consumers begin to grow, especially for car loans, credit cards and student debt, and retail is struggling with structural and cyclical problems.

Fig 35.Decline in car sales: Year-on-year decline in the first eight months of 2017. : Fed data

Fig 36.Recent weakening of the car market due to an increase in delinquencies and tightening requirements for car loans. : Fed data
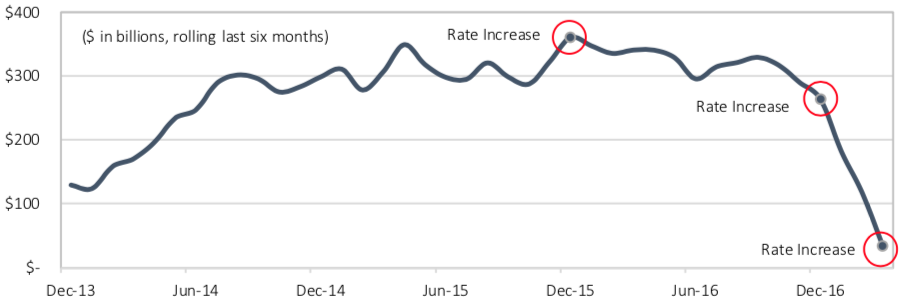
Fig 37.Loans and leasing in bank credit: the creation of loans is gradually stopping the work of banks. : Fed data
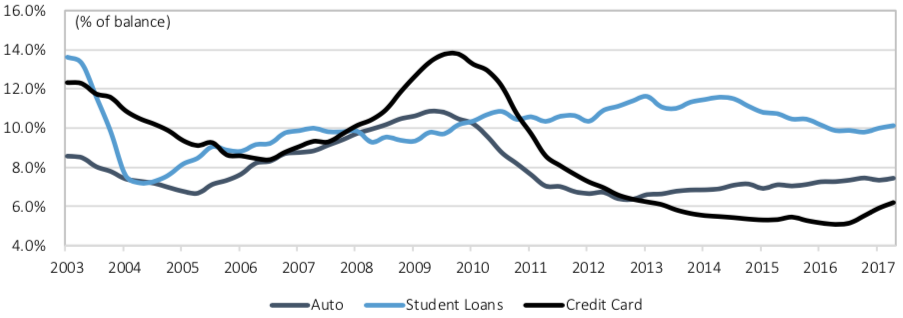
Fig 38.Consumer loans: Fundamentals are starting to deteriorate as delinquencies rise. : Fed data
10 weeks after the March rate hikeThe yield on 10-year US Treasury notes fell by 40 bps. p. (from 2.6% to 2.2%), and the yield spread of 10-year and 2-year bonds decreased by 33 bp. P.(from 125 bp to 92 bp), Whatsignals market fears of general economic weakness. Typically, when economic conditions worsen, the Treasury yield curve flattens(the spread between long-term and short-term bonds is reduced), which is what happened. Historically, during recessions, the yield curve often turns negative(long-term yield below short-term). For example, in a recession, yields on 10-year US Treasury bonds may be lower than yields on 2-year bonds, mainly due to deflationary concerns and more negative long-term prospects.
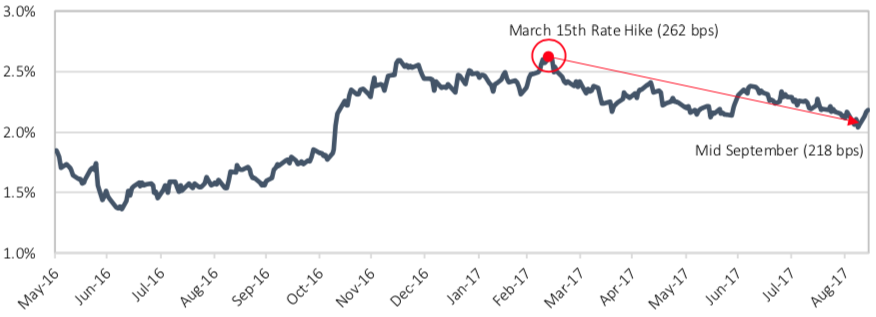
Fig 39.Signs of uncertainty in the market: Treasury yields have fallen more than 40 bps in 10 years. p.: Fed data
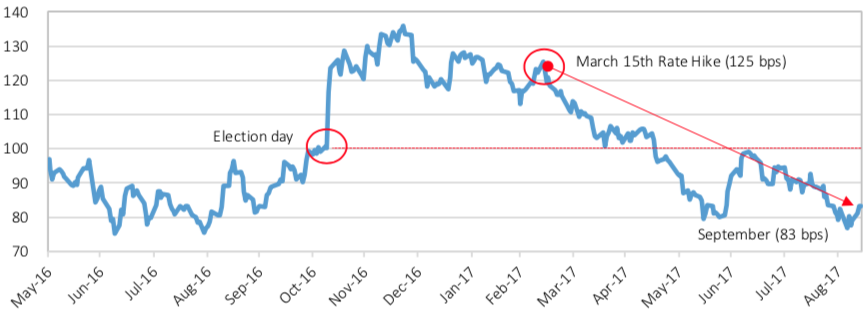
Figure 40. Signs of market uncertainty (continued): the breakdown between the 10-year and 2-year treasury collapse. : Fed data
After the election of Donald Trump, the market for the first timeFor almost a decade, he began to focus on fiscal reform as an economic stimulator, and not on monetary policy. Confidence increased, and so did bond yields, as investors sold them to go to the stock market. Distracted by the promise of tax reform, the rollback of regulation, including the Dodd-Frank Act and environmental protection, and the abolition of Obamacare, the market has lost sight of the Fed. Unfortunately for the market and for the Fed, fiscal reform cannot suddenly erase the mountain of debt generated by the sins of many decades. A deficit-financed tax cut that does not affect benefits and levels of long-term spending only contributes to a temporary and muffled increase in demand in return for an even larger public debt. The rollback of regulation may be generally positive, but it will not solve the existing imbalances between relative price levels and relative salary levels. Due to 30 years of incorrect policy and the current position of the Fed to tighten monetary conditions, the future prospects of the economy and the market depend on the Fed.
What's Next: Reverse Quantitative Mitigation - Fed Balance Reduction
The Fed unwittingly created a problem, and that problemworsens due to the constant movement of target landmarks, now closer, now further. If the Fed fully understood how sensitive economic conditions truly are to interest rates, it would not be signaling gradual rate hikes and certainly would not be discussing shrinking its balance sheet. Shadow banking system(~ $ 66 trillion assets / liabilities)is in credit dependence on the commercial banking system($ 16.2 trillion assets / liabilities), which is credit dependent on the Fed's balance sheet($ 4.5 trillion assets / liabilities).If the balance of the Fed is reduced, this will lead to a reduction in all its dependent balance sheets.
The connection will not be direct, but it will because-and-effect. If the Fed shrinks its balance sheet, there will be less bank reserves (i.e. liquidity) in the system. As a result, every dollar remaining in the system will become more valuable.(long-term interest rates will rise). When more dollars were created, an offerincreased, and the cost of dollar financing (interest rates) decreased. If the Fed cuts its balance sheet, the opposite will happen: the offer will fall, and the cost of dollar financing will rise.
Rising interest rates slows downpredisposition to loans and expenses. By raising short-term rates, the Fed actually motivates banks not to create credit, which slows down the speed of money circulation. In the same way, when the Fed ceases to reinvest its balance sheet, long-term rates will rise, which is why corporations, individuals and governments will less demand credit. In addition to the fact that the demand for a new loan will fall, as it will become more expensive, there will also be less dollars to pay off existing loans, and as a result, the number of delinquencies and defaults will increase, which will reduce the velocity of circulation and cause a sharper decline in GDP. With declining business and consumer confidence, savings will increase, while spending, investment and GDP will fall even further. It will be a cool feedback loop.
Increasing the money supply through quantitative easing allowed a credit-laden system to add trillions of dollars of debt, but the growth it generated was dismal.The reduction in the money supply will make the initial problems more obvious, provoking the initial stages of systemic deletion.As already discussed, systemic deleveraging is almostwill certainly lead to liquidity problems due to insufficient dollars to finance all existing obligations. As the Fed's balance sheet shrinks, perceived liquidity in short-term credit markets will evaporate.
Why the Fed does not see the approach of problems?Mainly because of the way shelooks at market liquidity and therefore financial stability, but also because the Fed believes the current state of the economy is stronger than the increasingly weak indicators suggest. From a liquidity perspective, the Fed treats the size and composition of its balance sheet as if its two main types of liabilities—bank reserves and currency in circulation—were more or less fungible, when in fact they are very different. Bank reserves provide the liquidity needed to finance liabilities in the banking system($ 66 trillion of debt, among other obligations). Currency in circulation represents physicalcash, which is almost completely outside the control of the banking system. This is cash in your wallet, under a mattress, in a safe, on the black market or sent outside the United States. Accordingly, the currency in circulation does not provide liquidity to the banking system to finance liabilities. As a result, if we talk about the stability of the banking system, the amount of bank reserves is much more important than the overall Fed balance sheet.
When most experts(including current and former Fed employees and macroeconomic experts with doctoral degrees)assess the impact of the upcoming balance sheet reduction,they do not make this distinction due to their focus on the expected impact on interest rates and financial markets rather than on liquidity and the real economy. Recall that the second and third quantitative easing was about achieving target interest rates to stimulate demand, and not solving the liquidity problem. According to the Fed, the liquidity crisis has passed. Therefore, when the Fed considers reversing quantitative easing, its goal is to raise interest rates to slow economic growth and control inflation. It doesn't focus on dwindling liquidity. The Fed considers liquidity generally excessive. This is the macroeconomic reason why the Fed does not expect the balance sheet contraction to have a significant impact on the economy, but instead believes it will simply slow demand.
From a more technical point of view, the standard argument for why a balance sheet contraction would have little impact has two parts:1) this will happen gradually; and 2) the balance sheet will not be reduced to pre-crisis levels.Firstly, after quantitativeWhile the Fed has all along maintained that it is the quantity of bonds purchased (balance sheet size) that matters, not the flows (actual purchases), it now argues that this will not have a significant impact because the rate of contraction (flows) will be gradual. Secondly, regarding the future size of the balance sheet, experts(including current Fed employees)suggest that the Fed's balance sheet after full normalization will shrink to only ~$2.5 trillion($ 2 trillion reduction from current $ 4.5 trillion)whereas before the crisis it was $ 900 billion.
The main reason why most experts claim that the balance will not be reduced to its original size is:currency in circulation will continue to grow. Here is how Ben Bernanke recently explained:
[41] “Here is a good description of the Fed's balance sheet beforecrisis: liabilities amounted to about $ 800 billion of foreign currency in circulation, and assets (almost all in US Treasury securities) were slightly larger. Today, the amount of currency in circulation has grown to $ 1.5 trillion. According to Fed officials, due to growth in nominal GDP, low interest rates, increased foreign demand for dollars and other factors, the currency in circulation will grow to at least $ 2.5 trillion in the next decade. In short, the mere increase in public demand for foreign currency indicates that the Fed will need a much larger balance (in nominal terms) than before the crisis.
Given the demand for currency, it would be prudentargue that the optimal Fed balance sheet size now exceeds $ 2.5 trillion and will reach at least $ 4 trillion in the next decade. In a sense, the US economy has "grown" to the Fed's $ 4.5 trillion balance sheet, which has reduced the need for its rapid reduction in the coming years. " - Ben Bernanke, January 2017
And this is where Bernanke's commentary on the TV show falls apart."60 Minutes" in 2010 that quantitative easing does not increase the amount of currency in circulation. Since 2007, banks have withdrawn more than $715 billion in cash—net, that is, minus deposits. At the end of 2007, banks had just $325 billion in cash, including reserves held at the Fed. Since the crisis, customers have withdrawn more than twice as much cash as existed before the crisis.This is actually equivalent to two full-blown banking panics. This would not have been possible without quantitative easing.Description by those involved in the Fed of currency growth inThe message - "the economy is growing, so the public's demand for cash is growing, so the Fed's balance sheet will be larger in the future" - is intellectually dishonest and glosses over the insolvency of the banking system. How $715 billion could be withdrawn from banks if they only had $325 billion to satisfy demands for withdrawal of funds and for lending is a rhetorical question.
Although it prints US Treasury dollars,actually the Fed creates them. She does this by first creating bank reserves. When the public goes to a bank to withdraw cash, these bank reserves turn into a currency in circulation. Then the US Treasury prints dollars to provide them to the Fed, which provides them to banks, and those to the public. As a result, the conversion of bank reserves into currency in circulation depletes the liquidity of the banking system, although it does so gradually. However, the current average annual amount over the past 4 years is about $ 90 billion, or 4% of current bank liquidity, while before the crisis, the average annual rate was less than $ 30 billion(here's the war on cash).
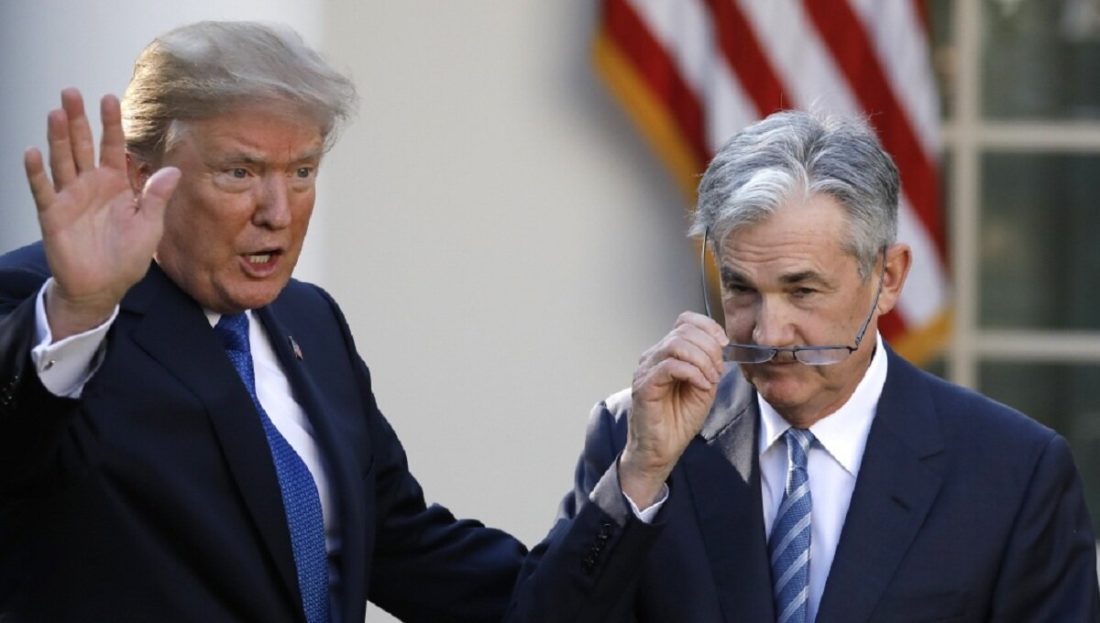
: Yandex Zen
Soon, the depleted reserves will be supplemented with a fullthe amount by which the Fed plans to reduce its balance sheet. The Fed cannot directly control the public demand for currency, but can only control the amount of reserves. Therefore, if experts believe that the Fed’s balance sheet will decrease by $ 2 trillion (~ 45%), this will lead to a reduction in bank reserves by about 90% and cash liquidity in the banking system by more than 80%, from $ 2.4 trillion to $ 400 billion. , though gradually. In a recent CNBC interview, Fed manager Jerome Powell presented it as if it was no problem.
[42] “It’s hard for me to imagine that the balance becomesless than $ 2.5-3 trillion, and this suggests that in the next 5 years we will normalize the balance and return to the relatively small amount of reserves. " - Fed Manager Jerome Powell in an interview with Steve Lisman of CNBC, June 2017.
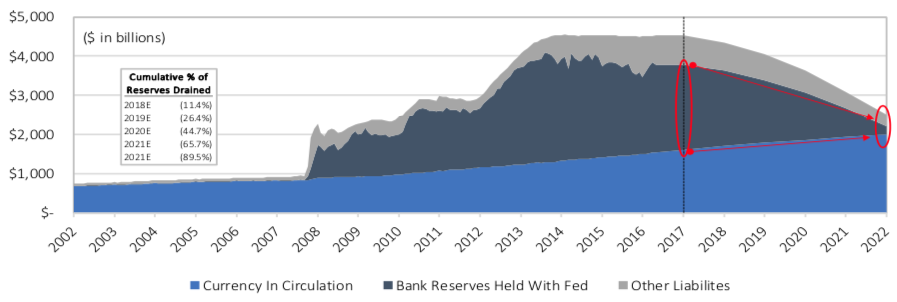
Fig 43.Reverse QE: Bank reserves will be depleted by ~90% based on Fed baselines. : Fed historical data
The problem with this scenario is that the $ 66 trillion of debt existing in the shadow banking system will hold only $ 400 billion of liquidity.In essence, leverage will be approximately 165:1, which is even higher than before the crisis. Despite this, the Fed is not predicting problems because it views liquidity in the context of depositor demand.(mainly corporations and households)for liquidity on a short-term basis inconditions of the status quo, where credit expands and debts are easily refinanced. In reality, the credit system will begin to contract when the Fed begins to shrink its balance sheet, not when the balance sheet is fully normalized. But it will not immediately become obvious that the reduction leads to systemic deleveraging.
To oversimplify, everyone agrees thatQuantitative easing caused a significant increase in financial assets, but no one is ready to admit that the opposite will happen when quantitative easing is reversed.When dollars were created through quantitative easing, the dollar value of financial assets increasedbecause there were more dollars.When dollars are eliminated through reverse quantitative easing, the dollar value of financial assets will fallbecause there will be less dollars. Again, this is too simplistic a description of the mechanism. From a practical point of view, most market participants believe that the Fed will tighten financial conditions only when it is sure that the economy has recovered sufficiently. Guided by a belief in the effectiveness of the Fed's policies, most see quantitative easing as an antibiotic rather than an addictive drug. If the economy is healthy, the antibiotic can be canceled; if the situation worsens, an antibiotic should be taken until it works. Unfortunately, since it contributed to the creation of additional trillions of fixed-term liabilities and debts, quantitative easing is more like cocaine rather than an antibiotic: the more it is applied to the financial system, the more dependent it becomes on it and the worse it will be if cancel it.
The decrease in the value of financial assets actuallywill occur due to the financing gap that the Fed will create, by ceasing to reinvest part of the securities, in particular treasury bonds, which have expired. Thanks to this mechanism, real interest rates will finally rise. Due to exorbitant leverage in the credit system, already weakening fundamental indicators will deteriorate even more as interest rates rise and the liquidity available to finance liabilities decreases. A cascading effect will be observed, as investors in bonds will receive higher returns and at each link in the value chain the credit spread will increase. When holders of investment-grade corporate bonds and emerging market government bonds switch to US Treasury bonds, the spread between these types of bonds will increase. When holders of high-yield bonds switch to investment-grade bonds, the spread between these bonds will also increase. In the end result, it will be increasingly difficult for a loan of lower quality to find liquidity for refinancing obligations.
Since we can be sure that the shortageThe US federal government will only grow in the coming years, the cumulative funding gap created by the gradual reduction of the Fed's balance sheet and the increase in the budget deficit will have to be covered by resources that are now used in other market sectors, in particular in financing higher-risk government bonds(bonds of developing countries)and private sector(high yield bonds and investment grade bonds).
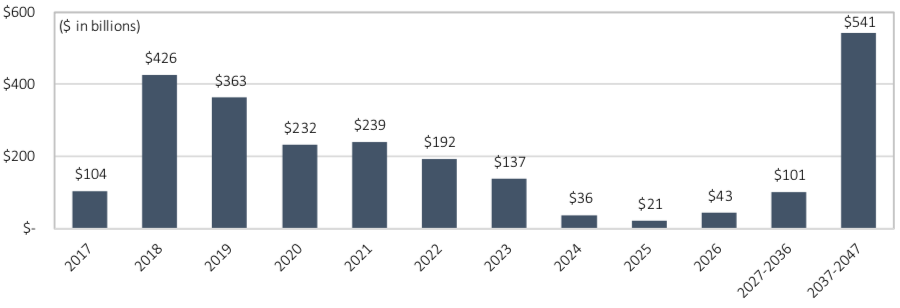
Fig 44.Maturity schedule for Treasuries held by the Fed: Currently reinvesting at 100% of maturities. : Fed data
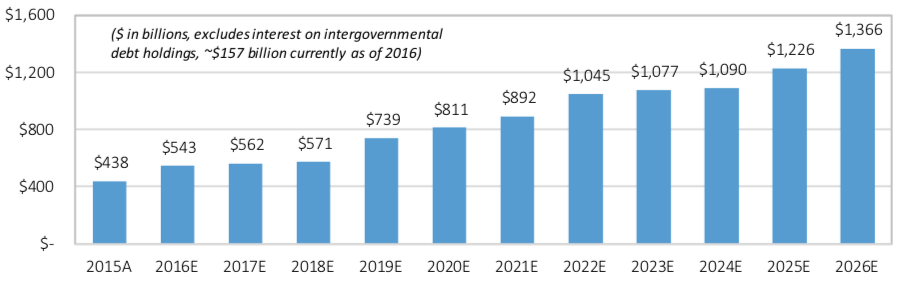
Fig 45.Federal budget deficit: $550 billion per year and rising due to increased mandatory spending. : Fed data
Conventional wisdom holds that most of the deficitfinancing will be covered by foreign buyers. The reality is that foreign buyers have significantly reduced their purchases of US Treasury securities over the past three years and were actually net sellers of more than $200 billion in 2016. Even if foreign buyers increase their purchases, this demand must come from some then other financial assets, as overall dollar liquidity will decline(as a result of the actions of the Fed). The consequence will be an increase in the spread between risky and risk-free assets and an increase in nominal interest rates on risky assets(corporate bonds and stocks).
When profitability rises, while market liquidityto finance liabilities, it will become less, corporate refinancing will become more complicated, fewer loans will be issued to consumers, and delinquencies and defaults will become more frequent. Savings will increase as consumers and businesses will need dollars to finance commitments that will expire in the future. Costs, investments and corporate profits will fall. The Fed will change course, but only when it becomes apparent that financial markets and economic activity are deteriorating.
Although it is unclear at what stage of the balance sheet reductionThe Fed will reach critical mass, the force pulling risk assets down will resemble gravity, even if it acts gradually at first. Because the market focuses on fiscal reform rather than monetary policy, and because markets do not understand the impact of balance sheet contraction on liquidity and the real economy, the risk is greatly underpriced. The Fed will likely step in and change course to avoid a 2008-style crisis, with the Fed most likely to respond with more quantitative easing, aggressively, and faster than most think. Likewise, we can expect with a high degree of confidence that the Fed will be able to stabilize markets before a real liquidity crisis sets in(Fed probability of success is 90 +%). However, the Fed will have to reactively respond tomarket downturn, instead of proactively changing course in response to a deterioration in fundamental indicators. If the Fed ceases to reduce its balance sheet and reverts to an easy money policy when markets are still at historic highs, it risks losing credibility when it is most needed.
Therefore, deterioration in fundamentals is not enough to change the Fed's course. This should become evident in the financial markets(falling stock prices and rising credit spreads). In a scenario where the Fed’s actions will worsen the market, but not so much that a full-fledged crisis ensues, stock markets are likely to adjust by 10-20%(and high-yield credit markets - by 20-30%)before the Fed becomes concerned(depending on the ordering of the early steps).
There is a saying that markets can stayirrational longer than you are able to remain solvent. Therefore, the key to neutralizing the unpredictability of timing and market efficiency. Instead of shortening stocks, which, in the long run, can suffer the biggest losses, shortening credit on a relative basis is the most effective way to manage risk(both in terms of timing and market value)also providing asymmetric profit. In early 2008, credit spreads increased significantly, while stocks remained neutral, as credit instruments remained more closely and sensitively associated with initial changes in interest rates. In addition, shortening the index of bonds traded in aggregate above face value has a lower risk of decline and volatility than shortening stocks, where price increases over longer periods may diverge more and more from fundamental indicators.
We hope you have mastered this material, which givesquite a lot of food for thought. This concludes this series of articles. If you missed the previous parts in the series, be sure to check them out - links in the table of contents for this article.
Parker Lewis research paper can be downloaded here.
Follow the news. We have planned a lot of interesting material in the same way, approximately.
</p>