This week, regular Technical Roundup contributors discuss the continued lack of volatility oncryptocurrency markets: consolidation below $20K in BTC/USD and continued range at $1300 in ETH/USD. The issue ends with a review of the S&P500 ahead of the month's close.
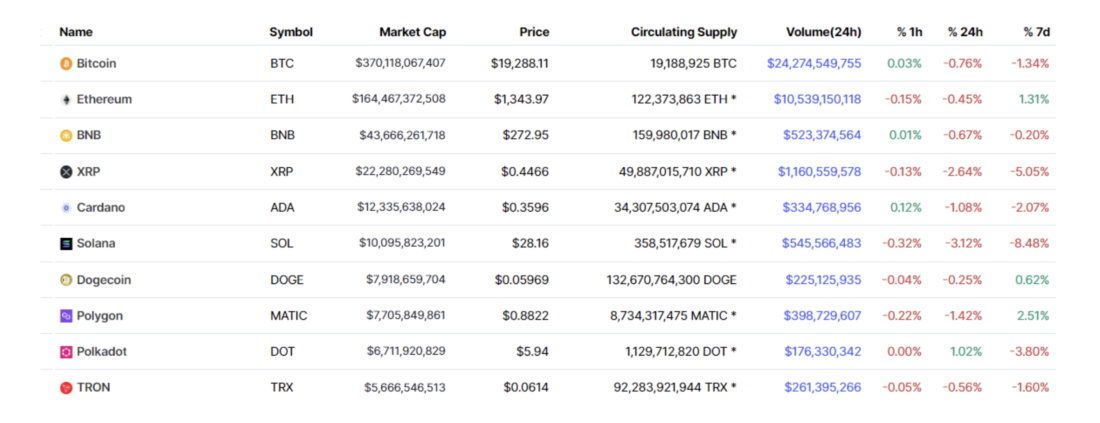
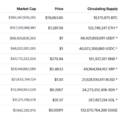
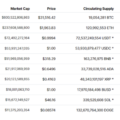
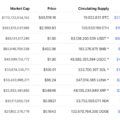
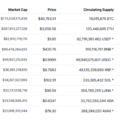
https://coinmarketcap.com/coins/views/all/
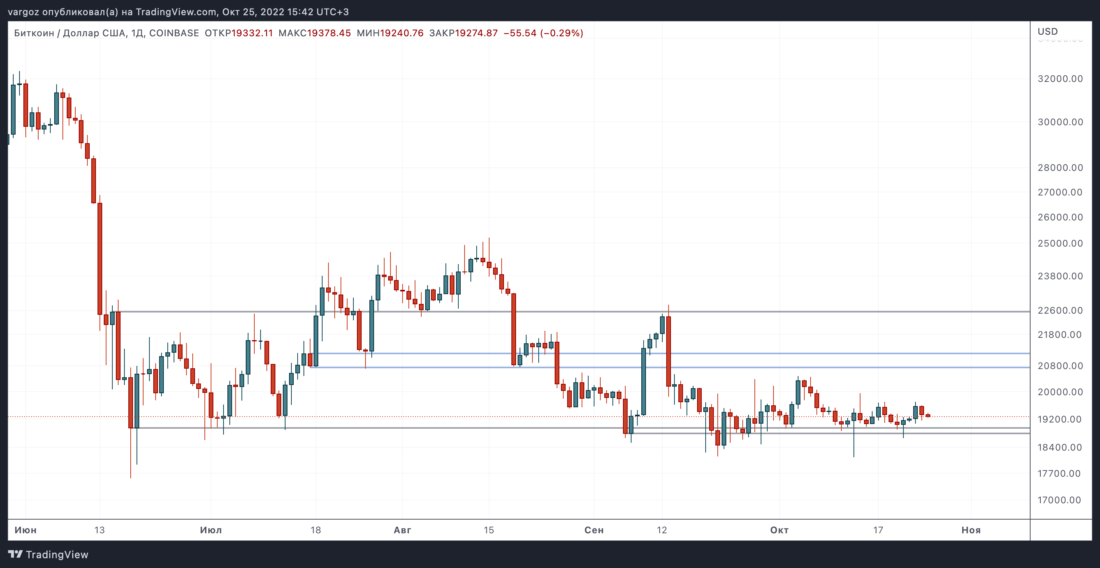
$20k continues to act as resistance
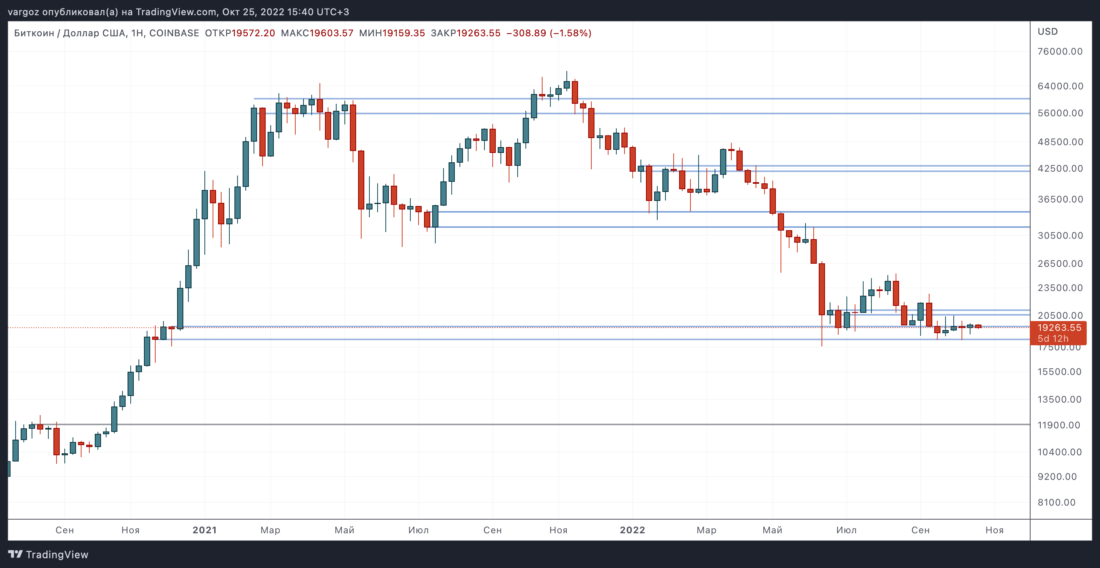
Writing today's review is quite difficult.In fact, according to our time frames and for our system, the market did not move at all. Bitcoin/USD is still below $20-21 thousand. ETH/USD is still below $1400. The S&P500 is still in the monthly resistance area of $3710–3760. The markets we are interested in are either below key levels or at resistance.
Our view of bitcoin/dollar boils down to three main components.
First, the move above $21K.in our opinion it would look attractive. This would mean a larger high on the daily timeframe and a recovery to the level of the previous cycle's peak. After that, either continuation of the momentum or perhaps a small pullback with a larger low towards ~$20k could present an attractive positioning opportunity for strength.
Secondly, an unsuccessful break below $18-19 thousand.(with a speedy restoration) would also look attractive in our eyes. This would indicate that there are buyers willing to enter the market below the low of the current range. Accordingly, a recovery to the previous range after a failed downward breakout will be a bullish signal and a sign of market strength.
Finally, any force in the crypto market must bothat a minimum, keep up with risk indices, and ideally exceed them. I would not like the S&P500 to continue to show strength, and Bitcoin/dollar to lag behind this trend. Unfortunately, this is exactly what the situation has looked like over the past couple of weeks, and now we would like to see signs of the relative strength of cryptocurrencies.
The broader context continues to becompression of volatility in cryptocurrency markets. Again, volatility in BTC/USD has dropped below the S&P500. Less volatility and relative weakness do not look like an attractive combination. Historically, the momentum from such subdued levels of volatility has been quite strong, so when the market moves, trying to play against it is likely to be quite reckless. We wrote about this in more detail a couple of weeks ago.
Ethereum as a stablecoin pegged to $1300
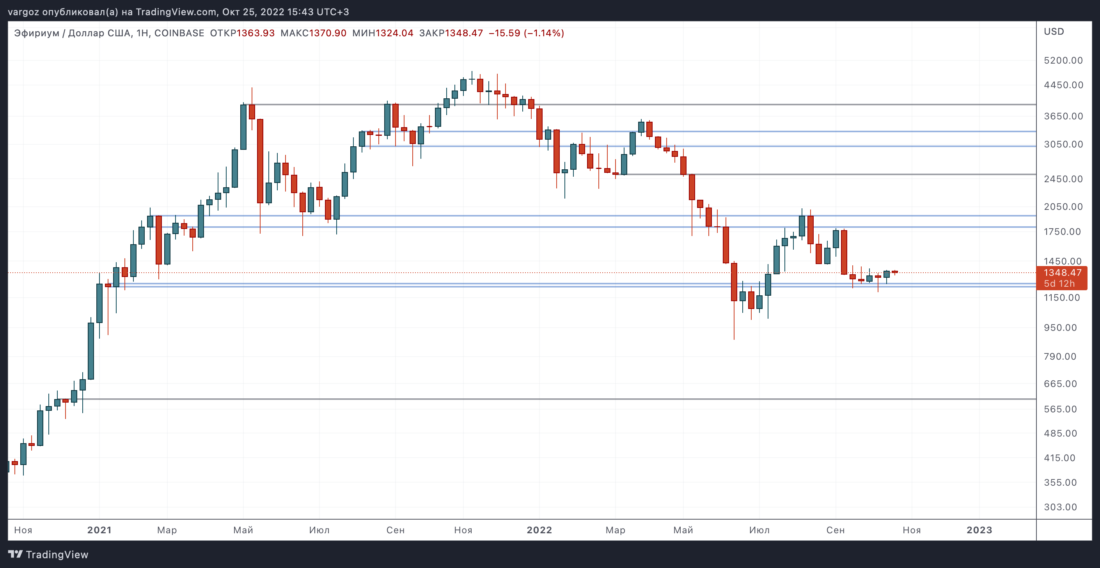
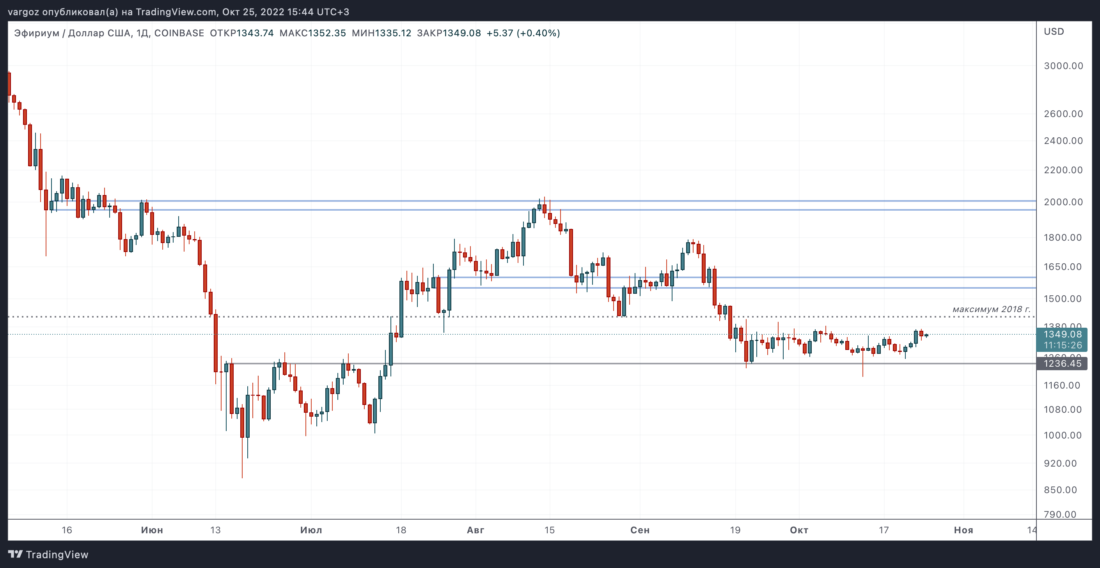
The ETH/USD rate is still firmly glued to $1300.
$1400 - nearest resistance and levelthe maximum of the previous cycle. The nearest support is $1200. $1,300 is the middle of the range, capable of taking all your money before the market hits much more significant levels.
There is nothing surprising in the fact that here alsoall of the considerations outlined above for bitcoin apply: recovery above last cycle peak = good, failed break down = good, nothing else interesting.
Some traders have found it worthwhile to move into more detailed analysis and cut out a much tighter trading range to capture current moves.
In the case of ETH/USD, the intraday range issomewhere between $1270 support and $1380 resistance. It's about $100 or 8% edge to edge. In practice, given that you are unlikely to be able to capture these levels exactly, this figure can be safely rounded down. And don't forget to subtract commissions.
Opportunities for discretionary traders to extractat least some profit from such parameters is very modest. If trying to trade this short term, position sizing should reflect reduced margin for error and reduced volatility.
Active scalpers here, maybe there is something forget hooked, but we're writing a weekly review from a swing trading perspective and our vision hasn't changed. This is a consequence of the fact that the market simply did not budge. And we certainly hope that this will change soon.
S&P500 rises above resistance
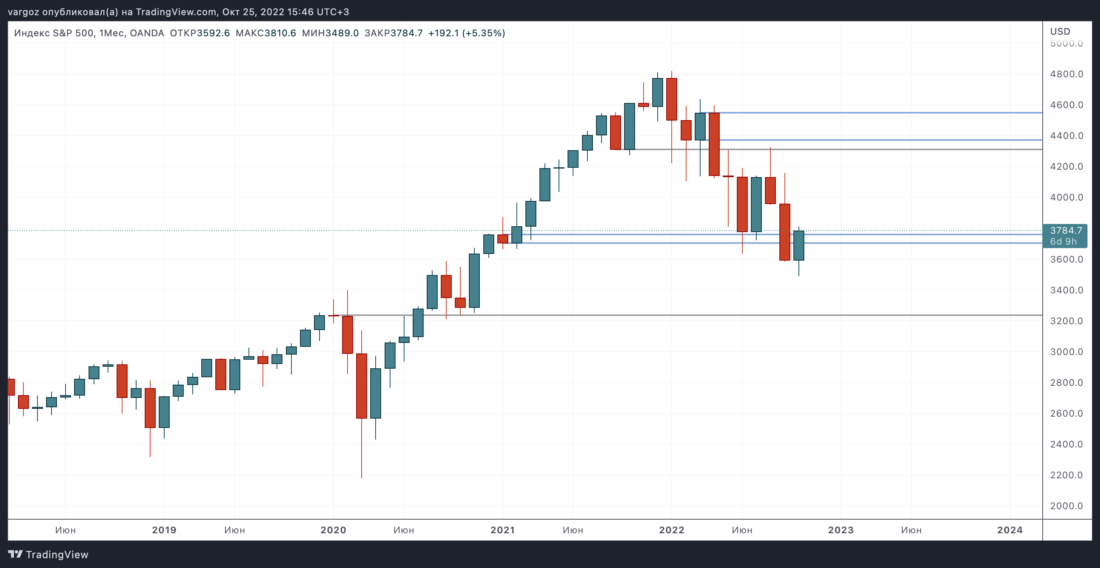
The S&P500 is trading above resistance in the last trading week of the month.
Apart from technical levels, we are still waiting forrisk appetite in crypto markets will keep pace with the S&P500. While strength in stock indexes alone means fewer headwinds for the crypto market, that will be much less helpful if our merry internet ponzis don't join in on these rallies.
As we wrote last week, the downwardthe trend in the S&P500 was very consistent and «technical» («respected» technical levels). After a breakout to the downside, a recovery into the previous range rather than a successful test of resistance would be the first significant change in this trend.
In this case, this means a monthly close above the upper boundary of the resistance cluster ($3760).
Of course, we are not fans of opening positions.right before the close of the month (especially when the market is trading at technical resistance), but hopefully the close itself may bring some clarity.
The bearish factor, on the other hand, couldto be an unfortunate break above the recent daily high ($3800), which by the end of the month would have brought the market back into the resistance cluster. Aside from the close itself, our focus this week will be on whether a higher high on the daily timeframe in this area will succeed or not.
In conclusion, we suggest looking at the newspaperheadlines this week, maybe a little more carefully. In particular, US GDP data and important earnings reports are on the way. A full list of major events for the coming days can be found here.
Good luck everyone and thanks for reading!
BitNews disclaim responsibility for anyinvestment recommendations that may be contained in this article. All the opinions expressed express exclusively the personal opinions of the author and the respondents. Any actions related to investments and trading on crypto markets involve the risk of losing the invested funds. Based on the data provided, you make investment decisions in a balanced, responsible manner and at your own risk.
</p>
Read this:
 Noise | Technical review October 19, 2022
 With resistance, but with what prospects! — Technical review dated October 5, 2022
 Local resistance instead of long-term support - Technical update October 11, 2022
 High Time Frame Weakness - Technical Brief June 1, 2022
 It is necessary to correct the situation on the weekly chart - Technical review of April 26, 2022
 Muddy structures and a couple of gambling bets - Technical review of April 20, 2022