Continuing consolidation in the BTC/USD pair, as well as Ethereum showing relativeweakness in the pair against USD and stuck in resistance in the pair against BTC - in another review from Cred and DonAlt, authors of the Technical Roundup mailing list.
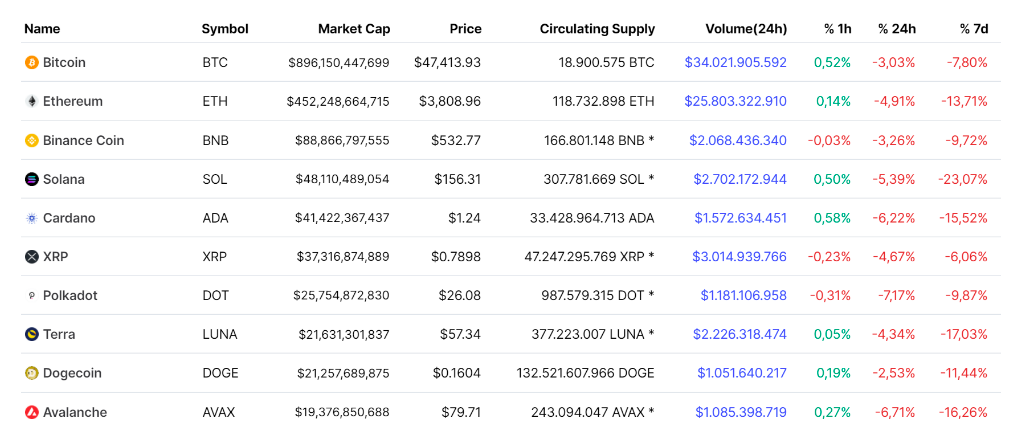
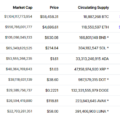
https://coinmarketcap.com/coins/views/all/
Bitcoin: Continued Consolidation
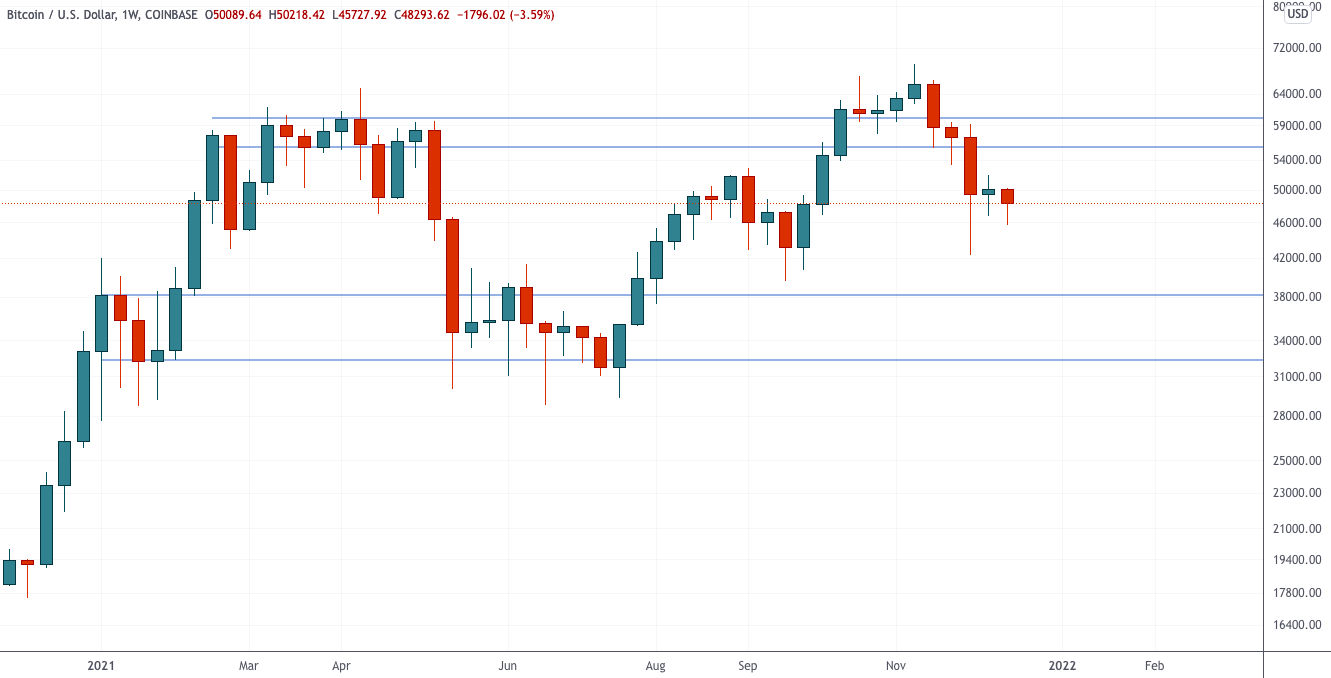
Chart executed in TradingView
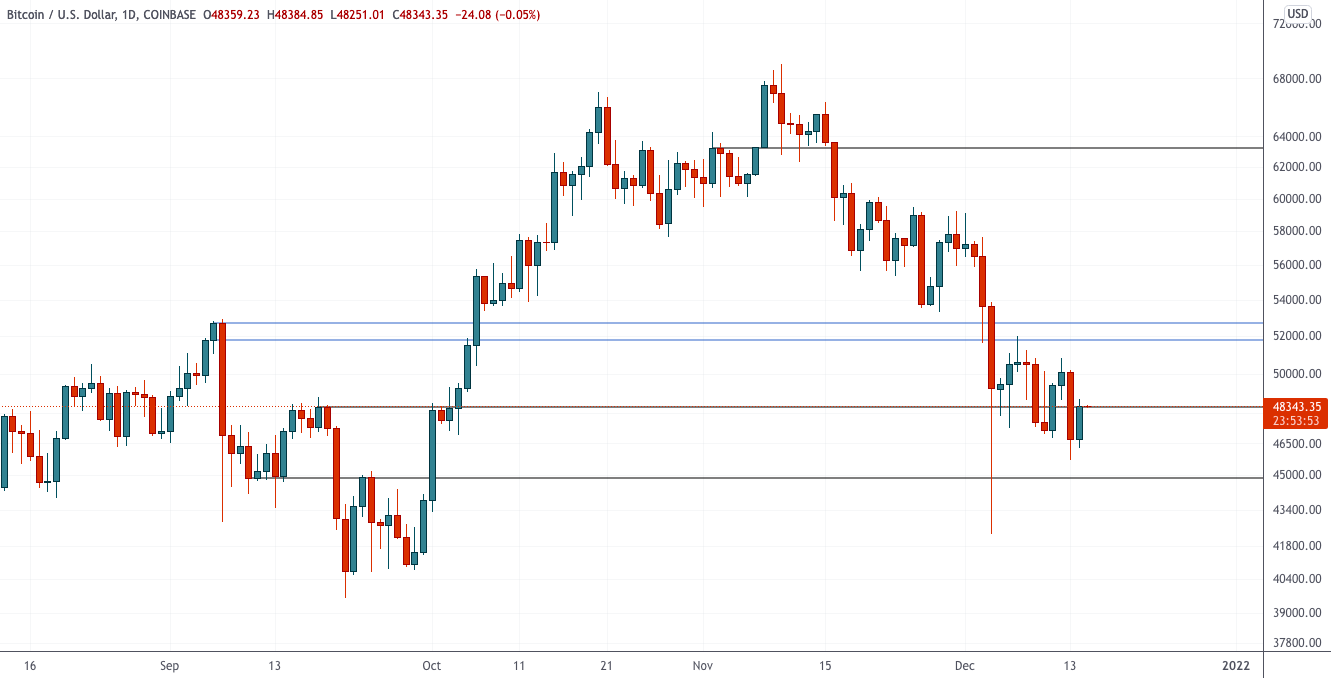
Chart executed in TradingView
BTC/USD is still trading in a range between $46k and $50k.
Not much has changed since last week.
In particular, our argument was that, asExperience has shown that after cascading liquidations, markets tend to trade in a relatively narrow range and that appropriate range trading setups are better suited to such conditions than trend trading techniques. In many ways, this is what happened over the past week, as the market failed to recover above $50K.
If we take a slightly broader context, thenthe market is still in the middle of the macro range with the top at $56-60K and the bottom at $32-38K. Bitcoin is currently trading around the middle of this range, having failed to hold above its high. Often, although not always, an unsuccessful breakout of one of the range boundaries signals a price movement towards its opposite boundary.
But be that as it may, now we are dealing withpost-liquidation "haircut" in the middle of the macro-range. Technically, the market is at support, but both of these factors indicate that this is not an area that would favor a strong positioning in the market.
Support remains for short-term tradingabout $44.8 thousand. This is a technical level, but it would also imply filling/retesting the liquidation “wick”, which generally happens quite often. But even in this context, this is hardly the simplest transaction, given that liquidation wicks are often exaggerated in length, which makes calculating risk much more difficult. The round number $50K is resistance, with a clearer technical level around $52K in the event of strong momentum or short squeeze.
The big picture at the moment does not look likeour eyes are attractive. Price swings after liquidation sales are usually quite awkward to trade for a while, especially when you consider that the market is in the middle of the macro range. If you are comfortable trading short-term average retracement setups, then there is probably something for you to profit from here. In the absence of this, we have adjusted our filters for the quality of setups for a more serious dropout and we plan to trade only the most obvious of them. Hurrying into the long line without more filling / retesting the liquidation wick does not seem like an attractive idea to us.
So far, we remain in our opinion, predicting the continuation of trading in the range as the most optimistic scenario.
First Signs of Ethereum Weakness Around $ 4000
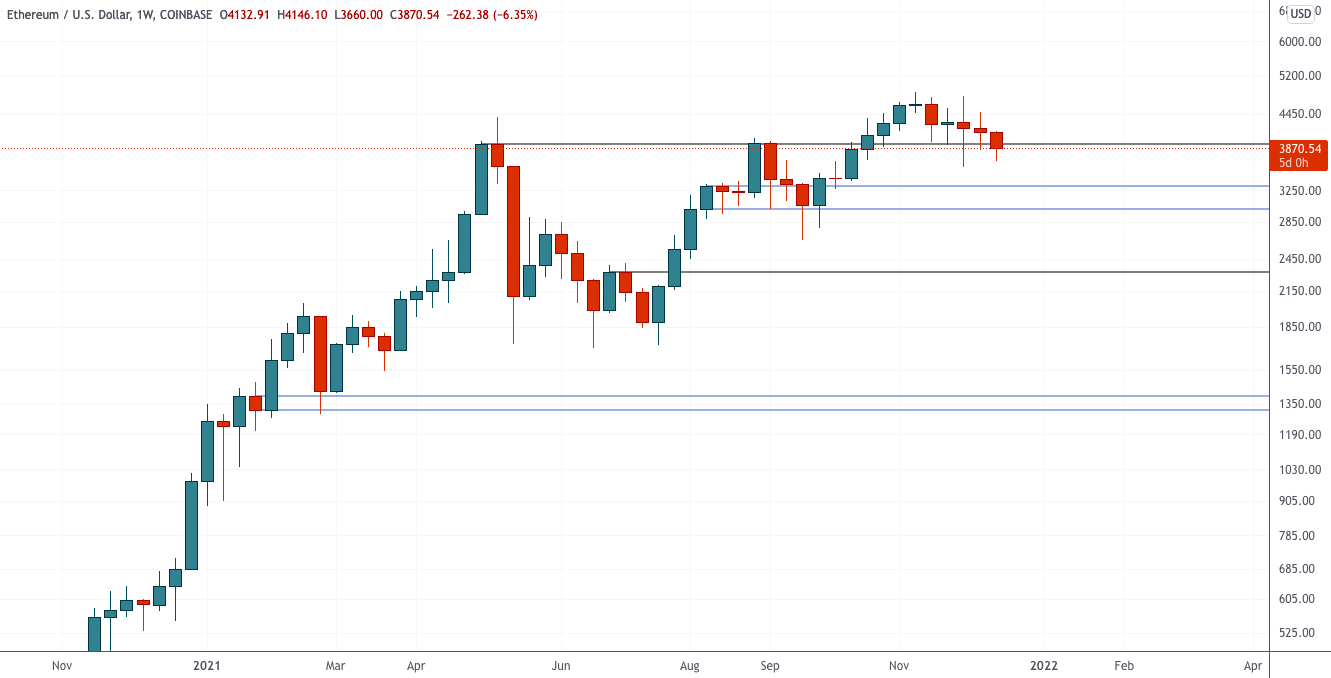
Chart executed in TradingView
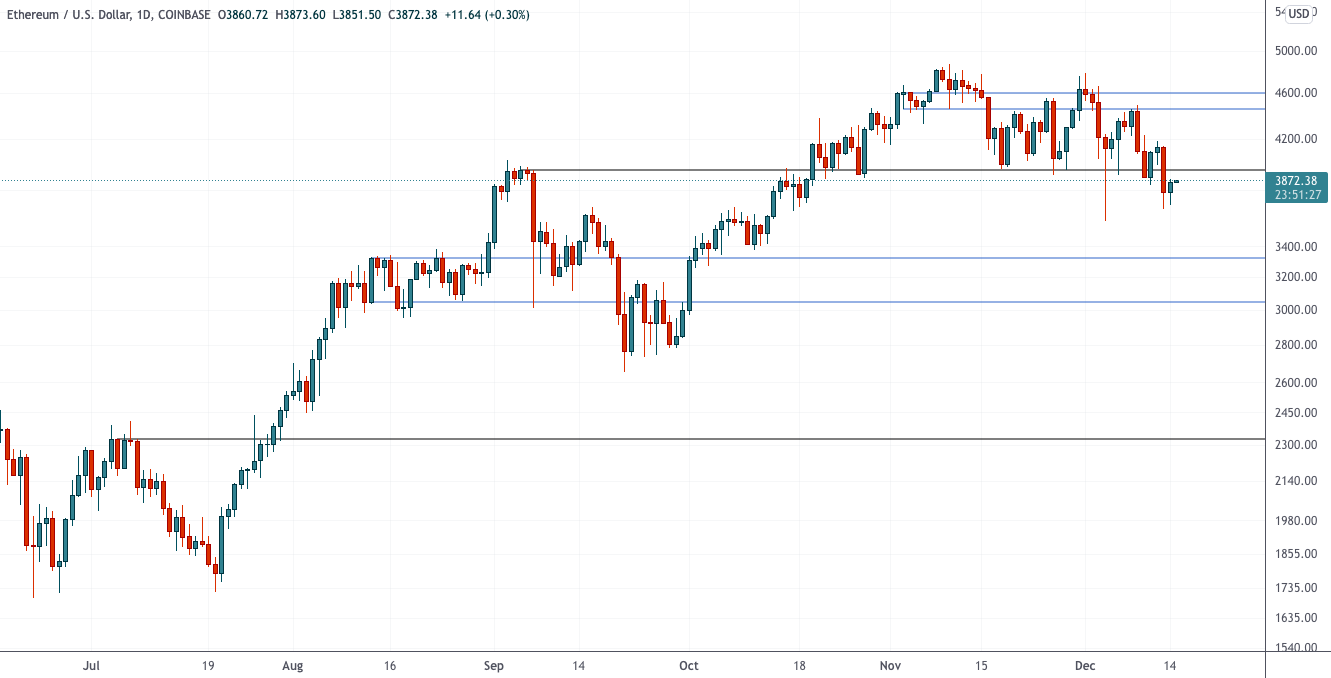
Chart executed in TradingView
Ethereum has been the flagship and the main source of short and medium-term optimism in the crypto market in the past few weeks, but it has begun to show signs of weakness.
The technical levels look pretty straightforward: $ 4000 is the most important border, and a price return below it is bad news.
The premise itself is simple.$4000 is the upper limit of the trading range on higher timeframes. Losing this level, like losing $60K in BTC/USD, means a failed breakout, which is a bearish pattern.
And although the weekly closes have still beenacceptable, rebounds were weak. The market is stuck at the daily resistance mentioned last week ($ 4480). When bounces off support on a higher timeframe reverse with resistance on a lower timeframe, it is usually a sign of weakness.
In addition, on the daily chart, the price closed below $ 4000. This means a breakdown of the daily structure (lower low) and a temporary loss of support.
This schedule can still be saved.If the $ 4,000 level recovers impressively this week, it could give us another bullish setup. In other words, it can still result in an unsuccessful breakout of support within the week and create a reasonable buying opportunity.
But so far there is little evidence of this and the graph looks weaker than a week ago.
If this is indeed a loss of the $ 4000 level, then wewe expect a correction to ~ $ 3300 - the support level on several timeframes. If the decline is accompanied by liquidations and deleveraging, then we can expect a "wick" and below this level.
In summary, at the time of writing, ETH / USD is below $ 4000technically not of interest to buy. A convincing retracement above $ 4,000 could form a buy setup with some risk, but this opportunity has yet to materialize. We are serious about this breakout of support until the reverse setup is confirmed and if there is no recovery this week, our next interest level is in the $ 3,300 area.
ETH / BTC stuck at resistance
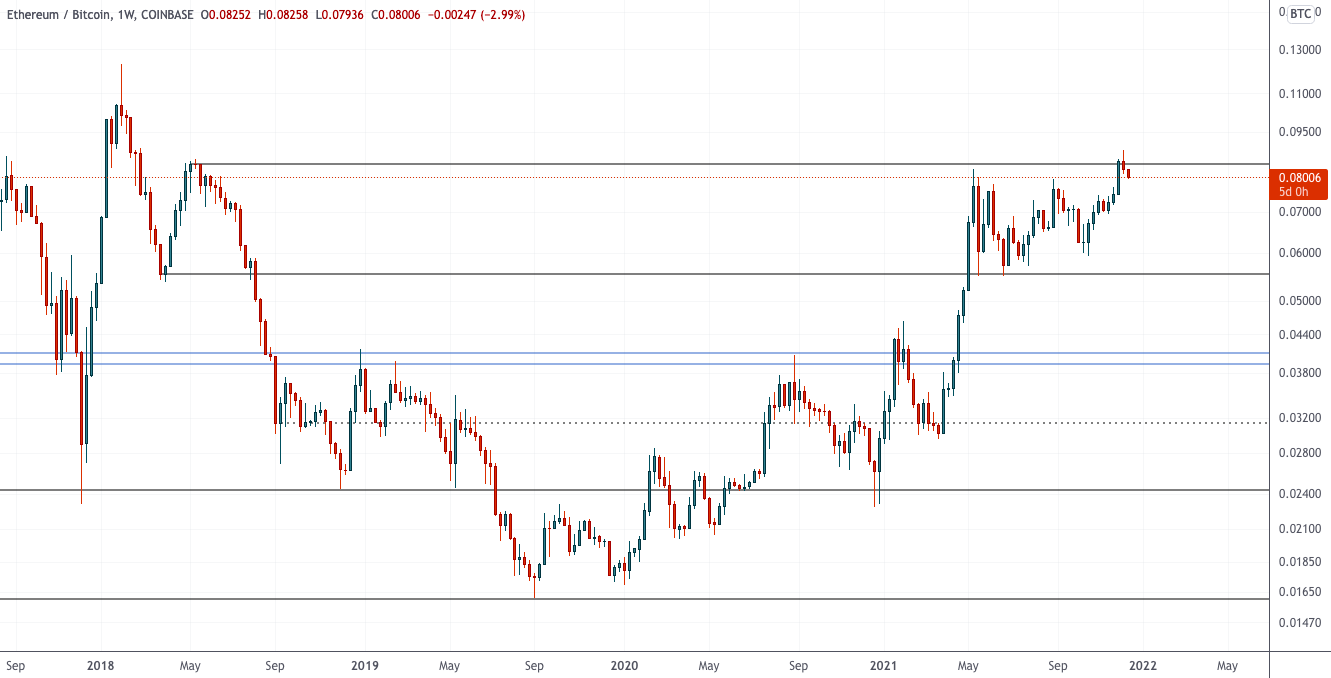
Chart executed in TradingView
ETH / BTC is retreating from the high of the range (₿0.084).
From a TA point of view, the graph looks prettypresentable. Reacting to resistance isn't the worst thing in the world. The chart remains decent as long as the mid-range support between ₿0.084 (upper bound) and ₿0.056 (lower bound) remains in place. It can be viewed as a breakout level of ~ ₿0.07.
In more general context, this setup is less attractive than the graph alone might suggest.
ETH / BTC optimism pays off betterjust when the market is in an uptrend and Ethereum's growth outstrips bitcoin's profitability. This game looks much more risky when the market as a whole collapses and ETH / USD shows the first signs of weakness.
In the first case, you buy a stronger assetin an uptrend that acts like a tailwind blowing in your back. In the second case, you are either betting on a major paradigm shift and disengaging ETH from bitcoin, or playing musical chairs (where there are fewer chairs than participants). These two scenarios have completely different risk profiles.
In summary, ETH / BTC looks average in terms ofonly by TA. The rate has reversed at the resistance, which means that it is probably better to either wait until this resistance is restored (above ₿0.084), or retest the support around ₿0.07. The current values have an unfavorable risk / reward ratio. In the absence of a recovery in BTC / USD and / or ETH / USD, the argument about the strength of ETH / BTC becomes more far-fetched, unless you are willing to put money on the paradigm shift thesis and dissociate ETH from BTC.
BitNews disclaim responsibility for anyinvestment recommendations that may be contained in this article. All the opinions expressed express exclusively the personal opinions of the author and the respondents. Any actions related to investments and trading on crypto markets involve the risk of losing the invested funds. Based on the data provided, you make investment decisions in a balanced, responsible manner and at your own risk.
</p>
Read this:
 Ethereum Prepares for a Breakout - Technical Review Dec 1, 2021
 Bitcoin at Support, ETH / BTC Accelerating - Technical Review Dec 8, 2021
 Record Highs Reached - Tech Review Oct 27, 2021
 Benchmarks in the Current Decline - Technical Review November 17, 2021
 Correction to Support Levels - Technical Review September 8, 2021
 Fully Prepared for High Volatility - Technical Review October 20, 2021