After my arrest on October 1, 2013, the price of bitcoin rose from $100 to more than $1,000 in a short time.After which bitcoin entered into the mostToday's longest bear market. In just over a year, it dipped by ~ 86%, to $ 175. I did not pay much attention to this, completely focusing on my business, but from time to time I either caught the eye of the chart, or someone mentioned the price. Even with these meager data at the level of ~ $ 175, I had a clear intuitive understanding that the bearish trend had come to an end and Bitcoin would continue to grow rapidly.
However, then I kept my thoughts to myself. I doubted myself because of the small amount of information and did not want to mislead anyone with my guesses. My guess turned out to be true, and Bitcoin switched to the strongest bull rally, at the peak of which its price rose to ~ $ 20,000. As they approached this peak, more and more people began to ask me how to invest in bitcoin and other cryptocurrencies. This was devoted to articles in magazines and radio shows. The hype around Bitcoin accompanied me all the time, until the arrival of the special regime in prison. And again, I had a clear understanding - now that the long-term price maximum was almost reached. This time I shared my thoughts with some of the people close to me and managed to help them withdraw money almost at the very top.
Then I began to wonder how Imanaged to predict with such accuracy the last two turning points for the price of bitcoin. I realized that my forced distance from the market in this sense is more a blessing than a curse. After all the daily news and market information was filtered out, I only had a general picture, and therefore I had a chance to hear the voice of my intuition. It also helps that my favorite market analysis method, based on the Elliott Wave Theory, is perfect for bitcoin. This provided the right context for my semi-intuitive conclusions.
I do not think that we are now in a turninga point of the same scale as in the case of my two previous signals, but, nevertheless, I have a few thoughts on the possible routes that the BTC price may go in the coming months and years. I am not a financial advisor and this is not a financial recommendation. I am not responsible for any actions that you may or may not take based on the information provided. Nevertheless, I hope you find it useful. To begin with, I will outline in general terms the Ralph Elliott wave theory, so that those who are not familiar with it will understand what I will talk about. In the next post, we will move on to considering Bitcoin price charts in the context of this theory.
Elliott Wave Theory is a conceptdescribing how prices in speculative markets change over time. It combines the psychology of masses and the field of mathematics called fractal geometry. But don’t worry: we won’t do anything here that goes beyond basic arithmetic. It’s worth a little time, because Elliott’s theory provides an excellent basis for understanding the dynamics of bitcoin prices to this day and how it can move on.
Elliott Wave Theory Built on Statementthat the driving force behind price fluctuations in speculative markets is investor expectations about prices in the future. This makes sense, because investors buy only if they think that the price will rise in order to sell the asset with a profit later, and when they buy it, it pushes the market higher. Thus, investor optimism moves the price higher.
The psychology of the masses begins to act whenother investors see rising prices and also come to an optimistic view of market prospects, so that they also enter the market, and this pushes the price of the asset even higher. As more and more investors are attracted, a feedback cycle is established between price increases and optimism. In the end, there comes a situation in which everyone who could enter the market already did this, and the stream of money, pushing the price up, runs out. Then the downward pressure on the price from the side of sellers begins to prevail, and this moves the price back down. As the reverse trend develops, optimism is replaced by pessimism and a cycle of negative feedback arises. Pessimism leads to lower prices, which contributes to increased pessimism.
Time after time, peaks of optimistic and pessimisticsentiment coincides with the main peaks and dips on the price chart. Thus, buying an asset when you - and everyone else - is optimistic about it (at high prices) and selling it at the peak of pessimistic sentiment (at low prices) leads to a loss of money.
Elliott waves, as a result, lead tothe opposite result. It is profitable - albeit unpopular - to be pessimistic when others are convinced of the great prospects for the asset, and to be optimistic when everyone around has written it off.
Many people, trying to understand why prices go up or down, and to form their understanding of the prospects of the market, rely on the news.But this is counterproductive, since the news is subject to the same cycles as investors, so the news background and the published forecasts will beThey are the most rosy and optimistic at the price peaks and the most depressed at the price lows.It's like a blind man leading other blind people, because no one really knowsOf course, Elliott Waves are not the "Grail" or a miracle cure, but they do helpTake a step back to see a bigger perspective and not succumb to the general mood.
Elliott wave theory also usesfractal geometry to track these waves of optimism and pessimism as they form. Fractals are called shapes that have small elements inside larger ones, while smaller elements look similar to large ones. In nature, there are many examples of such patterns, such as ferns with leaves in leaves or clouds consisting of many smaller similar formations. Fractal patterns often arise in chaotic systems, which are speculative markets such as Bitcoin.
In these markets, fractals are made up of waves.inside the waves inside the waves of optimism and pessimism, pushing prices up and down on any timeframe and time horizon, from seconds to decades. A wave is simply a steady price movement, upward or downward. The basic pattern consists of five ascending and three descending waves (see Fig. 1).
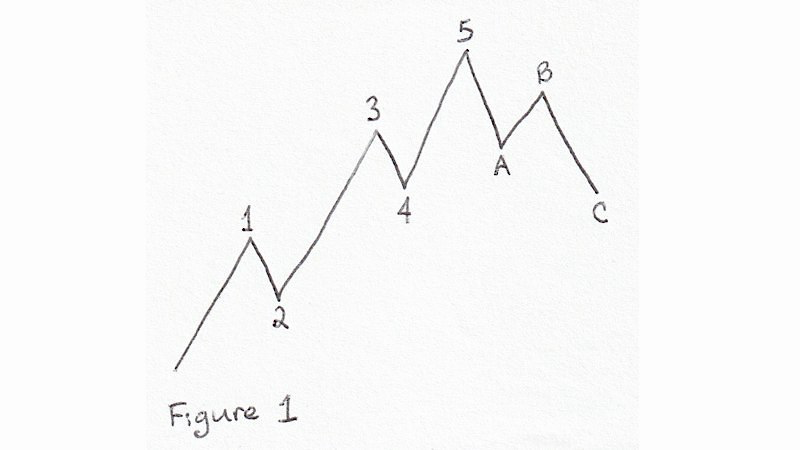
Fig. 1
Waves forming towards a largerTrends are called impulses. They are numbered at the end points and consist of five smaller waves (1, 2, 3, 4 and 5 in Fig. 1). Waves that move against the next larger trend are called correctional. They are marked with letters and usually consist of three smaller waves (A, B and C in Fig. 1). This pattern is not accidental. This is the minimum number of waves needed to describe both cycles (upward and downward) and trends (steady movements) within the framework of fractal price dynamics. This is a fairly effective, and even elegant, form of market description.
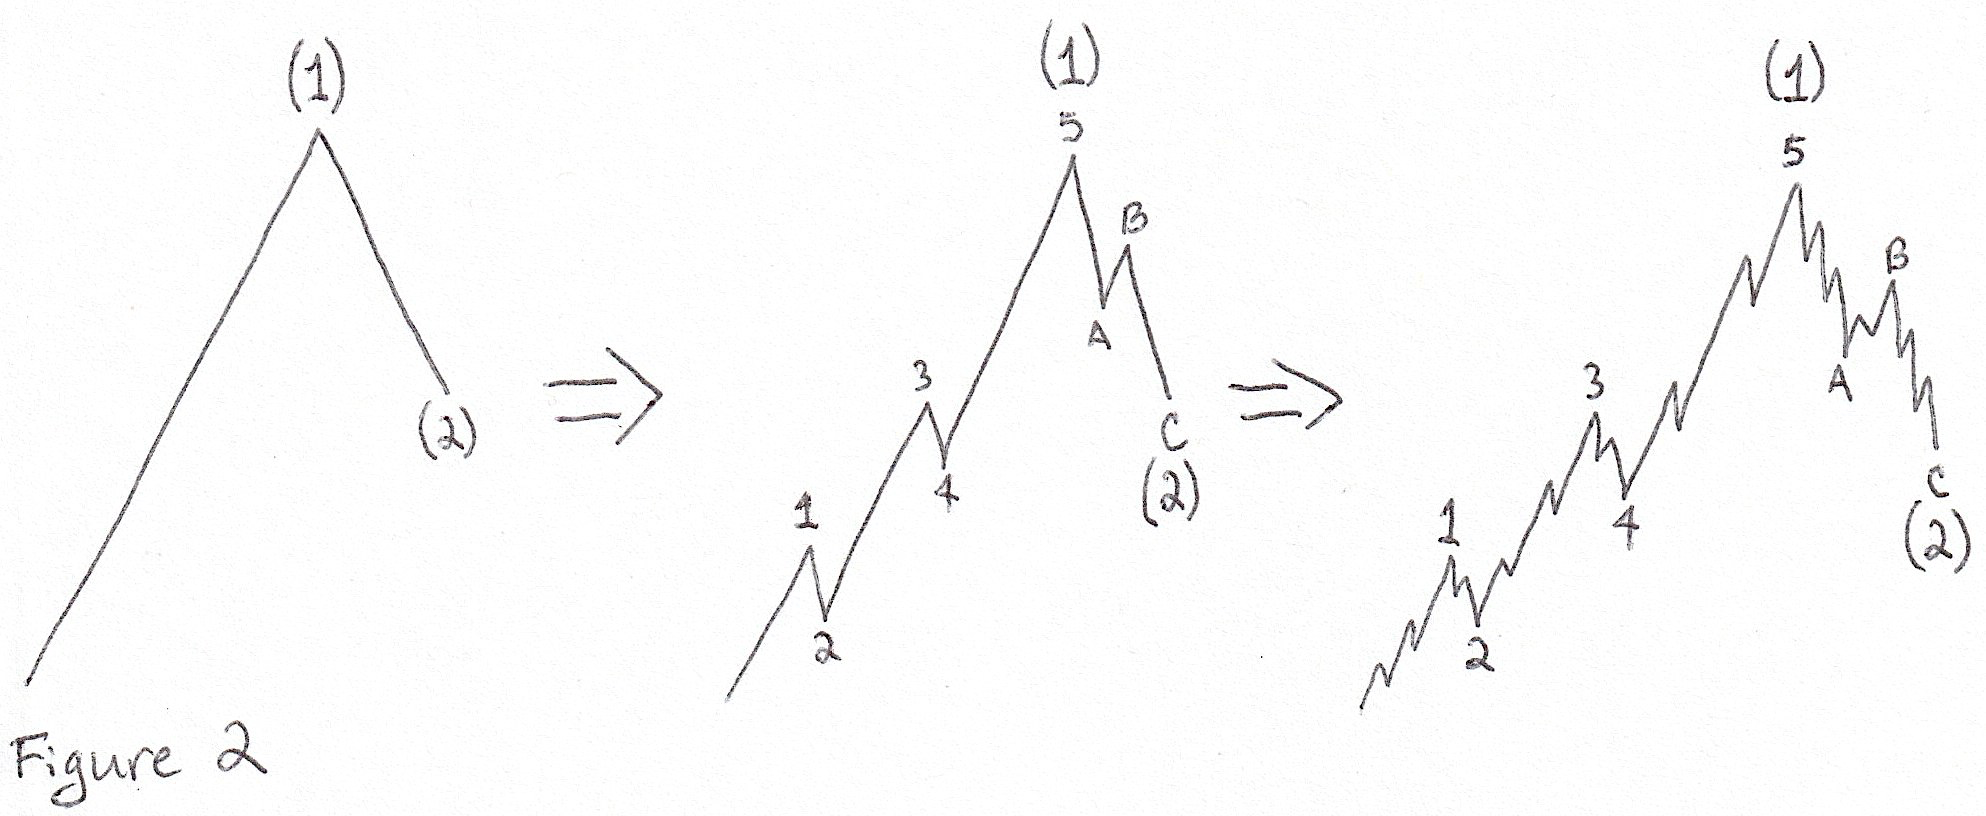
Fig. 2
Each wave at the same time is part of morea large wave and itself also consists of smaller waves, as shown in Fig. 2. In this figure, the trend is upward (the price at the end of the cycle is higher than at the beginning), then wave (1) is impulsive, because it is directed upwards within the framework of a larger trend. Wave (2) is corrective, because it is directed downward, against a larger trend. Waves (1) and (2) consist of smaller waves, the same as in Figure 1, and those, in turn, are also subdivided into the same smaller waves. Waves 1, 3, and 5 move in the same direction as wave (1); therefore, they are pulsed, and, therefore, consist of five smaller waves. Waves 2 and 4 move downward, against the direction of wave (1), therefore they are called corrective, which means they are divided into three smaller waves. A and C are the components of the wave (2). They are directed downward, like the wave itself (2), and therefore are pulsed and, in turn, are divided into five smaller waves. And finally, wave B is corrective and consists of three waves, because it is directed upward, against the direction of wave (2). Thus, then, of how many smaller waves - three or five - a wave consists of, it depends not only on its direction up or down, but on its direction with respect to the parent wave.
There are a number of rules on how to count.these waves in real markets. There are a lot of materials and books on the Internet about Elliott waves, so here I will not go into details and tell only about a few principles that I consider to be the most important.
Rule 1:The end of wave 2 in an impulse cannot be lower than the beginning of wave 1.
Rule 2:The end of wave 4 in the impulse cannot be lower than the beginning of wave 2.
Rule 3:Wave 3 is never the shortest wave in an impulse.
Note 1:Corrections, as a rule, look chaotic, have a faint structure, and are difficult to count.
Note 2:Impulsive movements tend to look more dramatic, have a clearer structure, and are easier to identify than corrections.
There are much more details and subtleties in the Elliott waves than I mentioned in this post. I will supplement them as necessary in future posts in which we will move on to analyzing the Bitcoin market.
Combining investor psychology sensations(optimistic or pessimistic) with a clear count of waves can help for a moment to gain confidence in the future direction of price movements, but this requires patience, humility (no one can be right every time) and decisiveness in the implementation of decisions made.
In the next post, I will talk about the charts that I will use to analyze the price of bitcoin in the context of Elliott waves.
and: 1, 2