Elliott waves can be a powerful tool for trading cryptocurrencies. For example, on Monday (16December) waves helped our Crypto Pro Service analytic team detect a bearish setup - and alert subscribers in time.
On Tuesday, after our bearish forecast, Ripple fell 13% in one day.
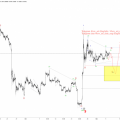
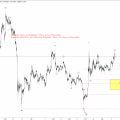
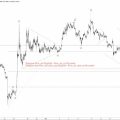
Take a look at this Elliott wave chart and see what happens next with XRP, as well as with key price levels.
Published on Monday, December 16, 2019.
A decrease in wave (2) is assumed.
")
Key levels: 0.21939, 0.31490
Although 0.20013 has not yet been violated, a breakthrough seems inevitable, and therefore we foresee it and allow a further minimum to complete the wave (2). Ideally, he will find the bottom in the range of 17-19 cents. A rally above 0.21939 would be evidence that the bottom has already been made.
translation from here
Now the handbook for wave enthusiasts, “The Elliott Wave Principle,” can be found in free access here
And don’t forget to subscribe to my Telegram and YouTube channels.