Last week, Bitcoin hit new all-time highs and then fell ~20%. This was accompanied by manyexplanations about Coinbase listing, hash rate drop, and billions in liquidations in the derivatives markets. How does the current situation look in terms of on-chain metrics?
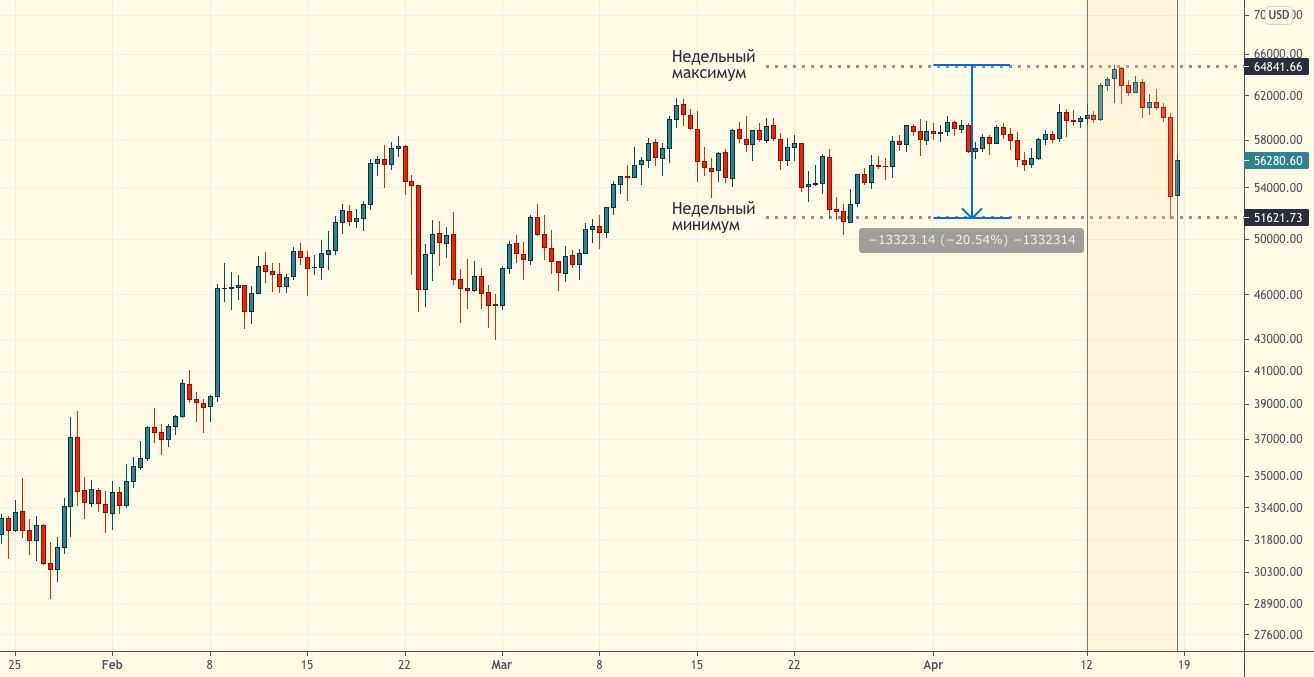
Last week Bitcoin showed significantvolatility, especially in comparison with the relatively calm consolidation that the market entered at the end of February. Ahead of Coinbase's highly anticipated direct offering, the price of BTC reached a new all-time high of $64,717. However, the rally was short-lived as it was followed by a sell-off that peaked on Sunday with BTC falling -20% to a low of $52,829.
Versions to explain and rationalizeThis volatility has been voiced by all sorts of things, from mismatched expectations regarding Coinbase's placement of reality to more than 40% drop in Bitcoin hashrate and multi-billion dollar cascading liquidations in an overheated futures market. Here, we analyze these narratives in terms of the on-chain data available to us, and also talk about the accelerating trend of new entrants into the bitcoin market, seemingly mainly retail.
Hashrate Drop
One of the main narratives circulatingaround the Sunday sale on crypto markets, there was a reaction of participants to a sharp drop in the hash rate in the Bitcoin network (although the Sunday sale happened later than the change in hash rate became known, so this was hardly the main driver). The hash rate cut began on the evening of April 15 and is believed to be related to a coal mine accident and blackout in Xinjiang province, a major hub for bitcoin mining.
Average block spacing, targetwhich is 600 seconds, began to rise in the evening of the 15th, and two days later reached a peak of 1300 seconds (21.6 minutes). Since then, the hash power of the network began to recover, and the interval between blocks began to decrease again.

Average block spacing. (Link to interactive graph)
At the same time, the estimated network hash rate fell from 203.37exahesh / sec. to a minimum of 114.27 exaches / sec., which is equivalent to shutting down about 43.8% of the network's calculated hash power. By mid-Monday, the hash rate had recovered 33% to 151.97 exahs / sec.
It is important to note that the network hashrate is notexact value, it is calculated based on the current mining difficulty and observed intervals between blocks. Given the naturally occurring fluctuations in the block interval, especially over short periods of time (<1 week), calculated hashrate values usually vary somewhat depending on the source and time period used in the calculations. Thus, block intervals are usually a more meaningful and accurate metric for tracking mining market mechanics, and estimated hashrate values should be viewed in that context.
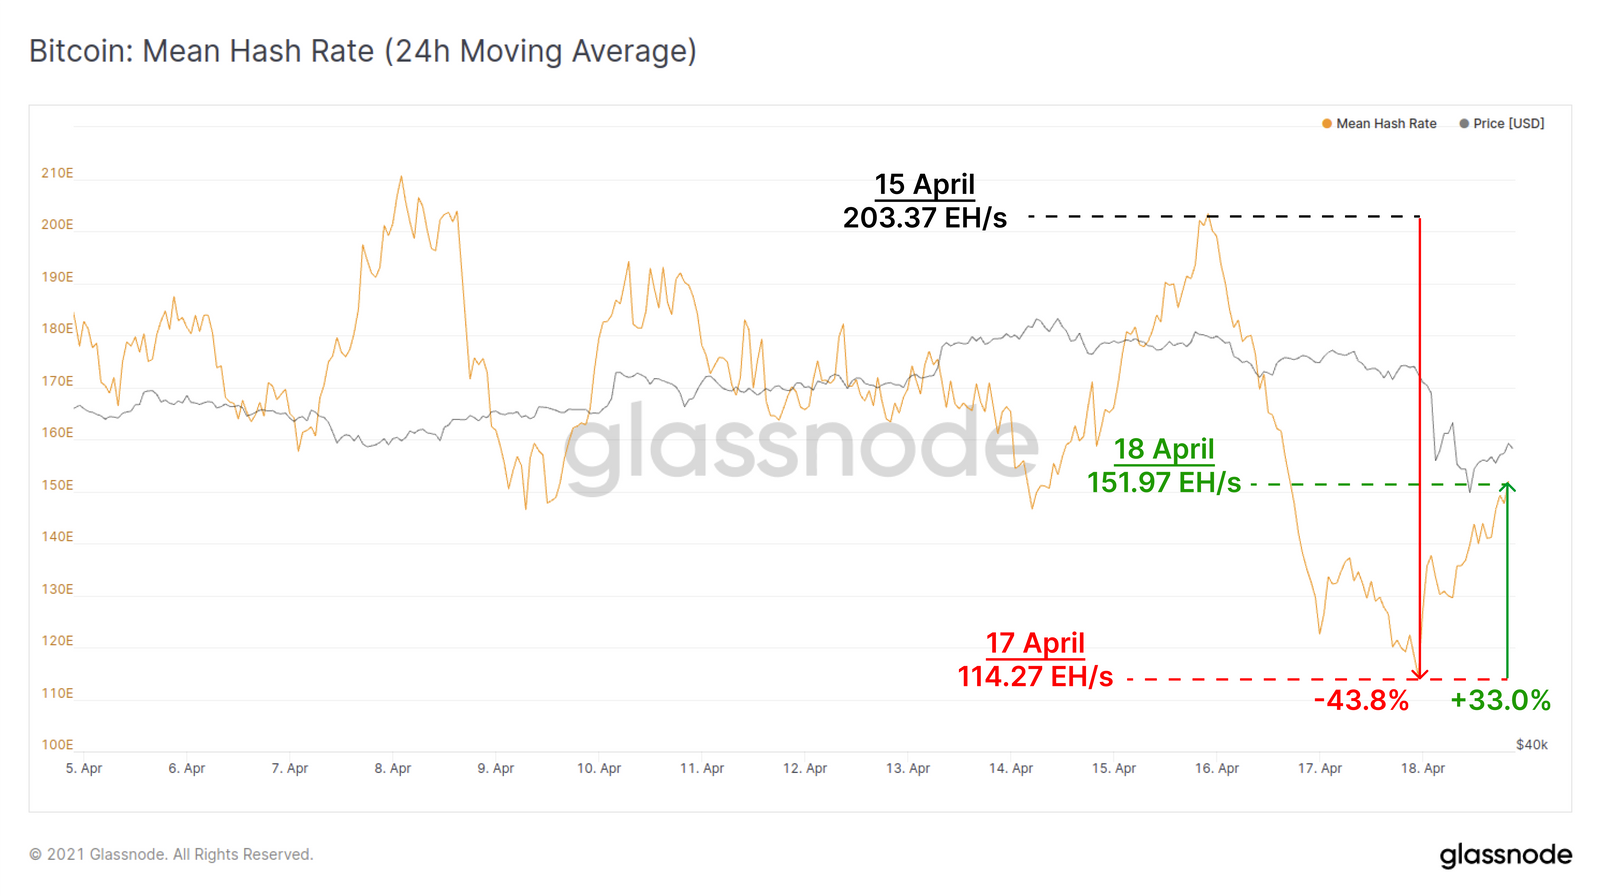
Average hash rate (24-hour moving average). (Link to interactive graph)
Washing away excess leverage in the derivatives market
As is customary in the bitcoin market, excessiveleverage is reset on rapid price movements, and this week was no exception. As many traders have increased the amount of credit in their positions - likely pending a Coinbase listing - this has significantly increased the risk of long squeeze and cascading liquidations.
As the price of BTC rose to new highs,Open interest on derivatives exchanges also set a new record of $27.4 billion. However, by Sunday afternoon, a total of $4.9 billion in futures contracts had been closed, with the majority coming on Sunday.
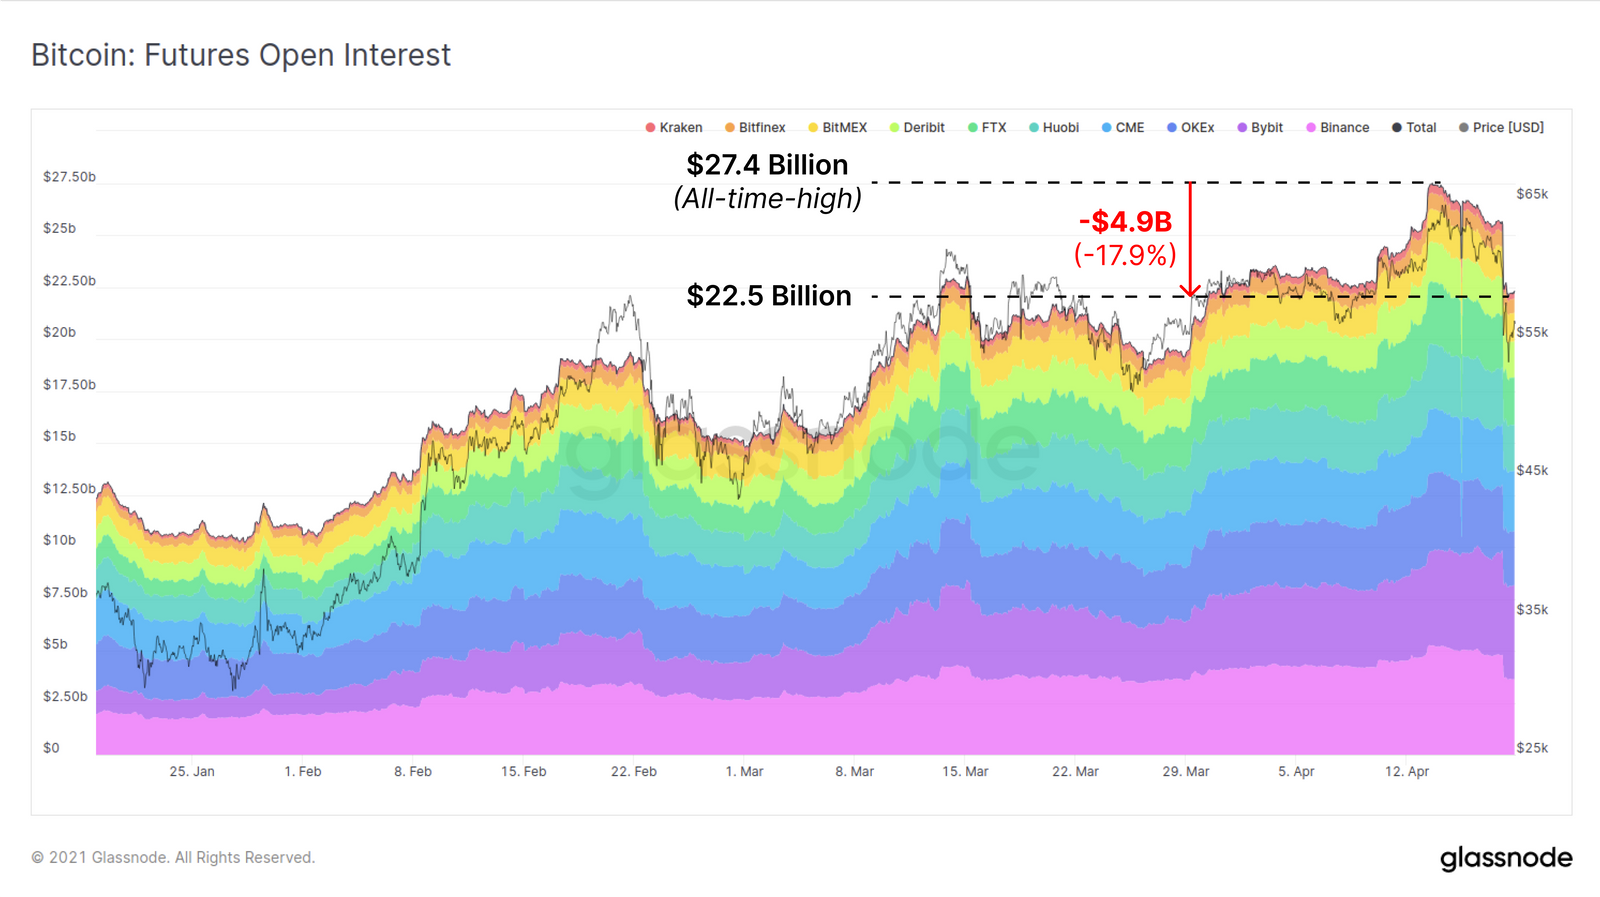
Open interest in BTC futures. (Link to interactive graph)
Volume of liquidated longs on Binance, BitMEX andOKex reached $1.847 billion, almost doubling (+95%) from the previous record high set on February 22nd. It is remarkable how quickly the derivatives market shed this excessive leverage—the vast majority of liquidations were completed within one hour.
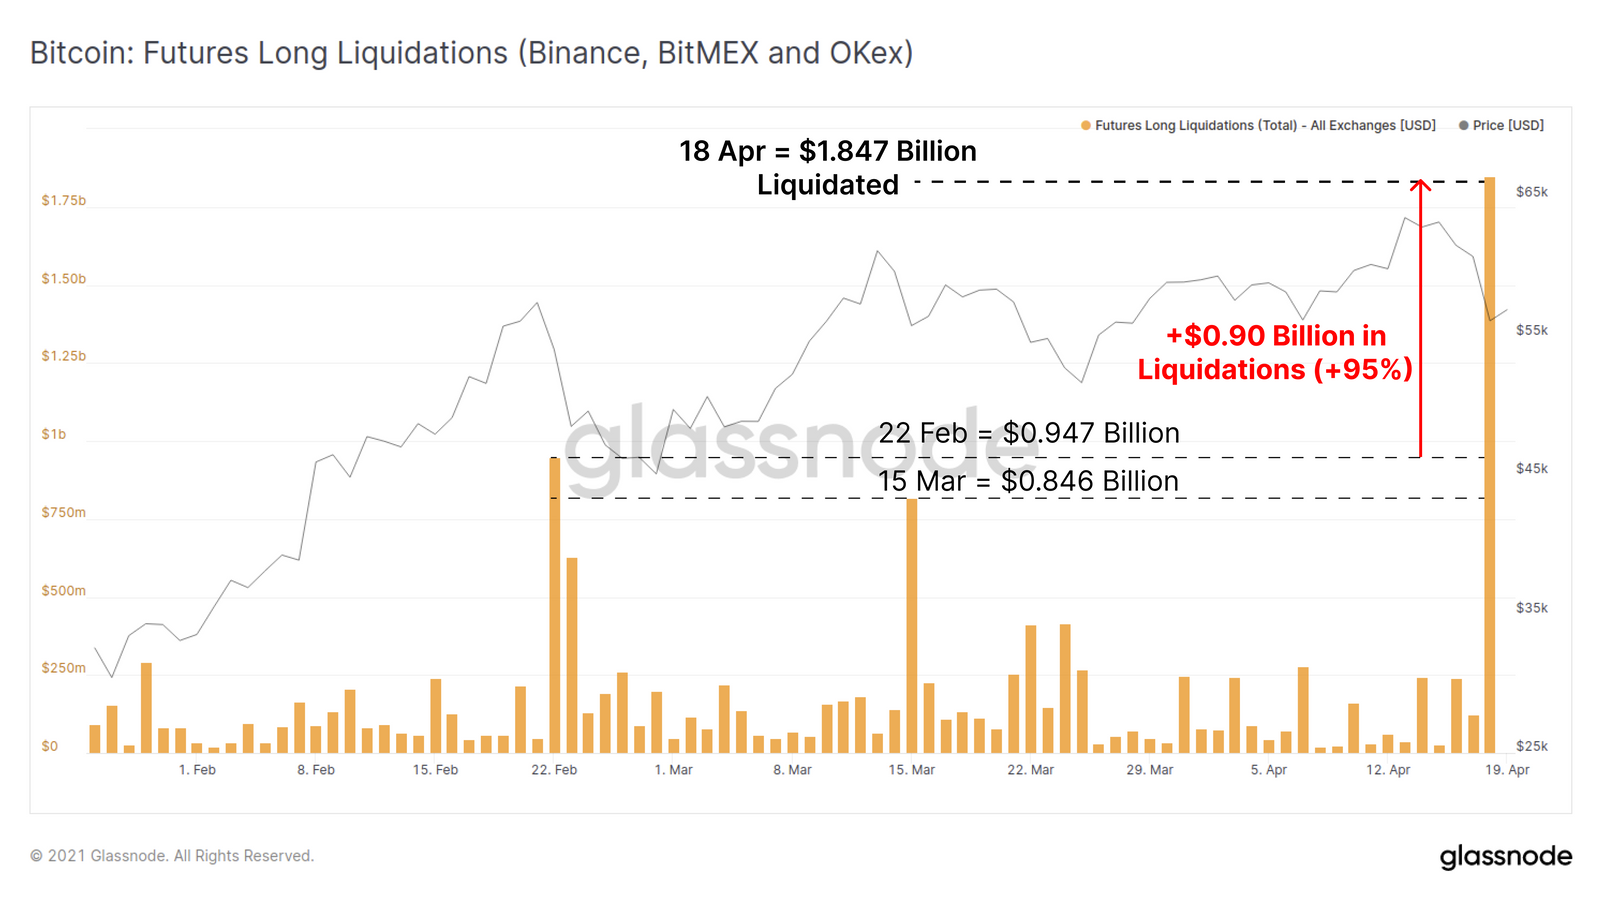
BTC long liquidation schedule. (Link to interactive graph)
Perpetual Swap Funding Ratefell to negative values and set a new low for the current bullish cycle at -0.017% (average value weighted by the exchange's open interest). Previous instances of the futures funding rate dropping to zero or negative values indicated a significant washout of leverage, and this often proved to be a constructive factor for price movements in the coming weeks.
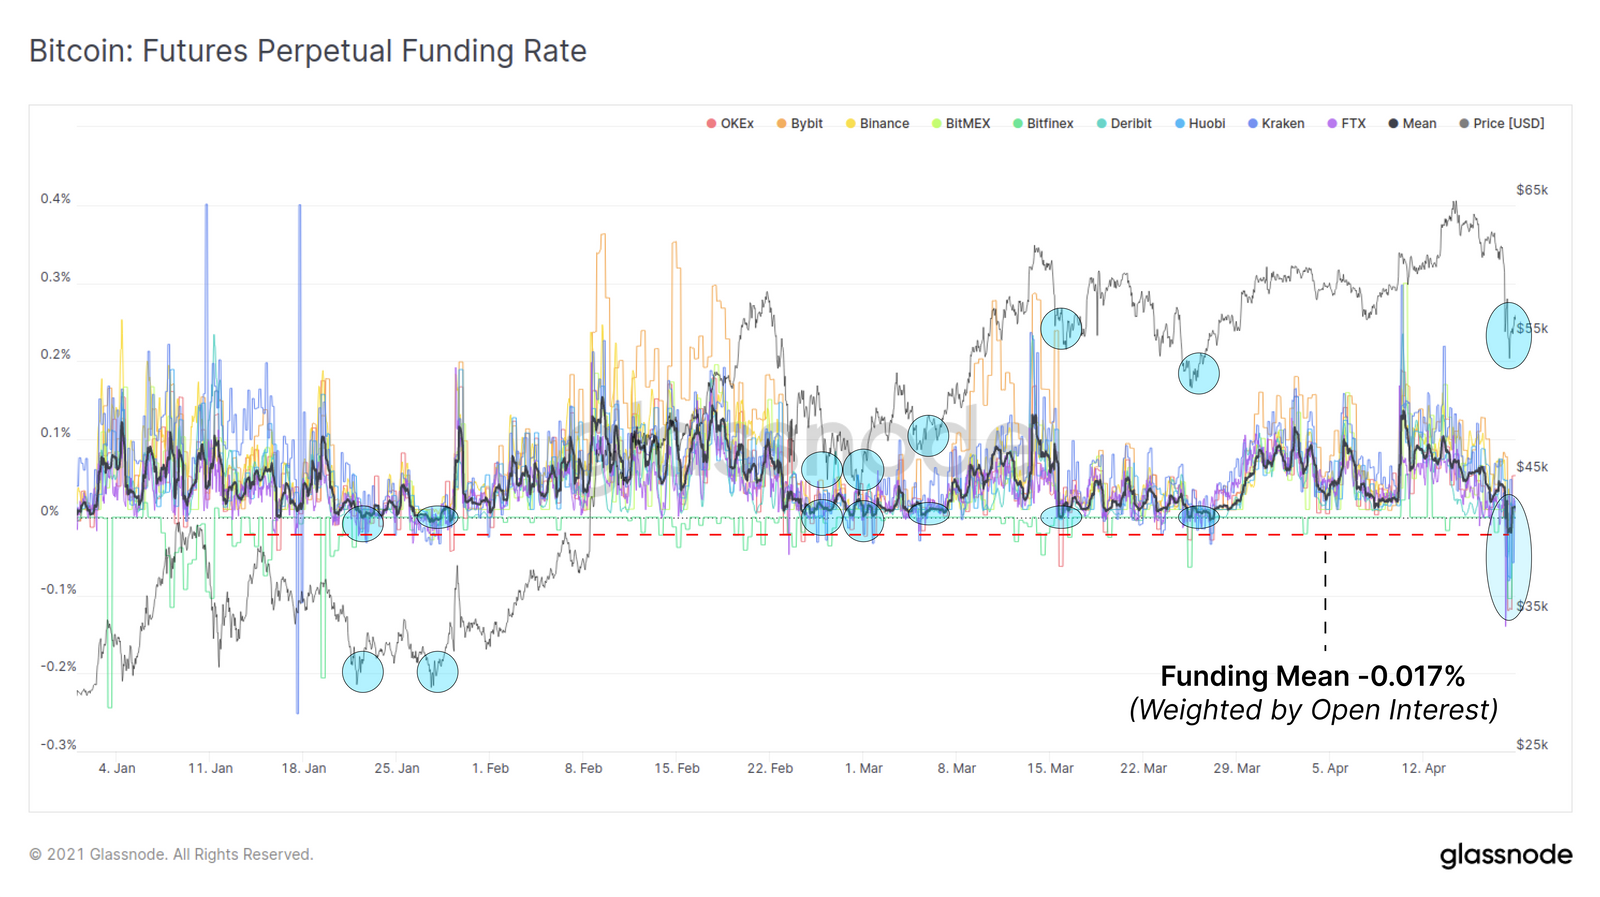
Funding rates for BTC futures. (Link to interactive graph)
Market Sentiment Review
Speaking about on-chain indicators, the meaningSOPR (spent exit profitability) ratio for short-term holders, STH-SOPR, was also dropped to less than 1.0, the lowest since January's drop to $29K. This metric tracks the amount of profit (SOPR > 1.0) or loss ( SOPR < 1.0) received from the sale of coins on-chain, but only takes into account short-term owners (holding the coins being moved for less than 155 days).
An STH-SOPR value below 1.0 indicates thatsome of the short-term owners suffered a loss during this fall. However, the low SOPR also signals that short-term owners who are in profit have not been shaken out of their positions, which indicates the strength of the market.
Similar to the futures funding rate, resetting the SOPR during bull markets has historically had a constructive effect on the price of BTC.
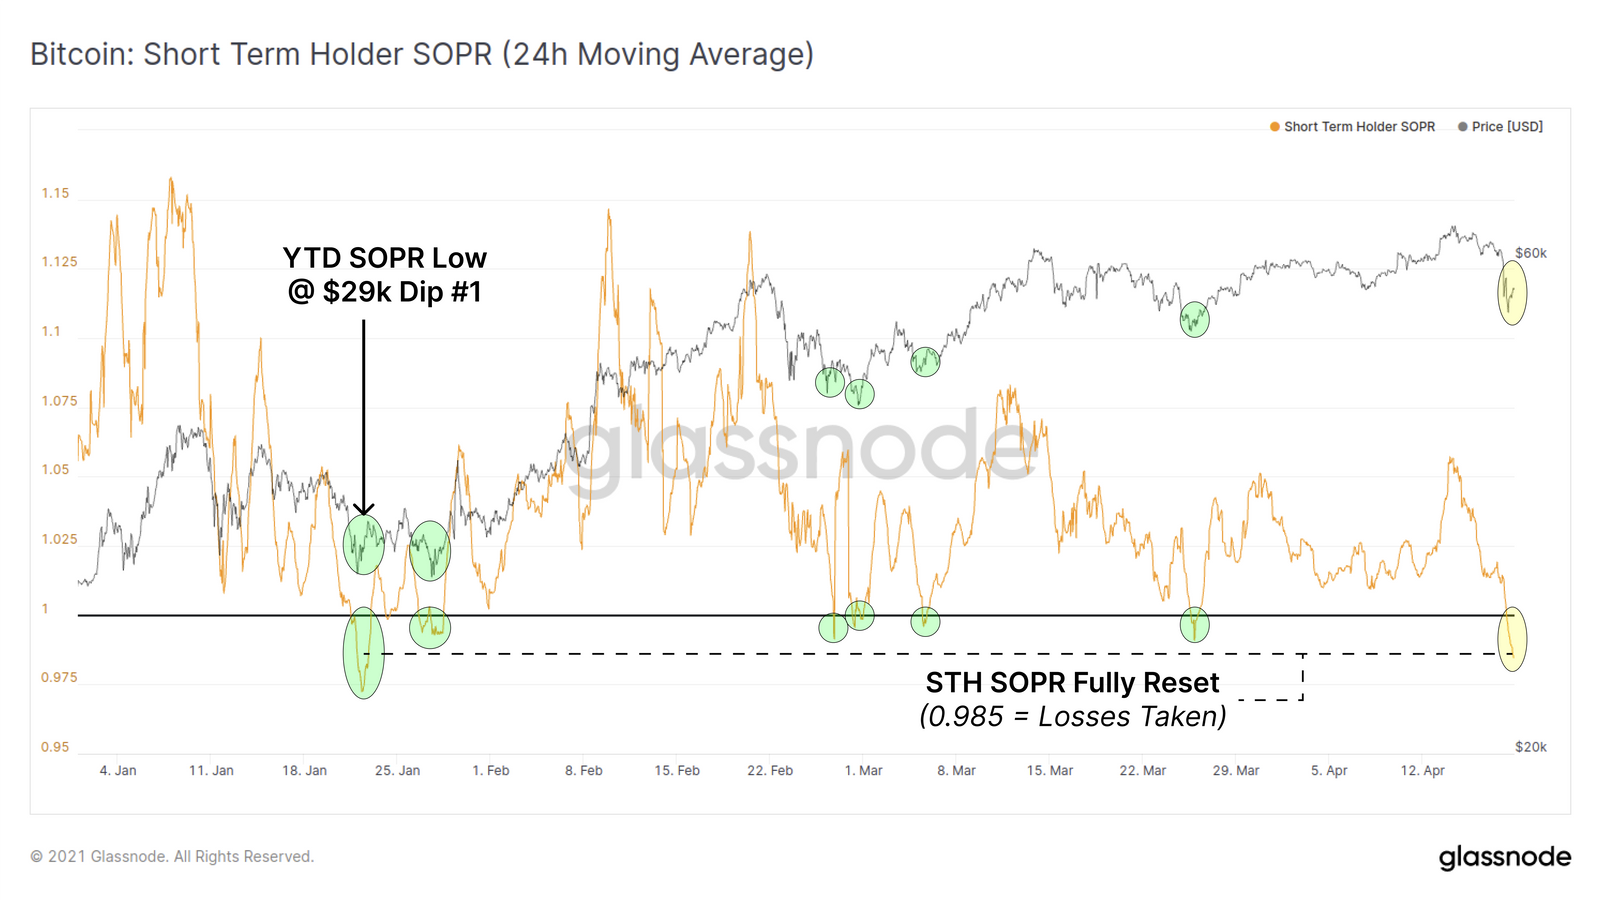
Bitcoin STH-SOPR (24h MA). (Link to interactive graph)
As for the "older" coins, Coin-DaysDestroyed, and Average Dormancy (a metric of the average downtime of coins) have increased slightly over the past week, but are in a relatively stable range, established since mid-January. Both of these metrics track the “age” of coins spent, and their value increases as “older” coins move around the chain. The development of an upward trend in them is worth watching, since a significant increase in these metrics may indicate an increase in profit-taking by long-term owners.
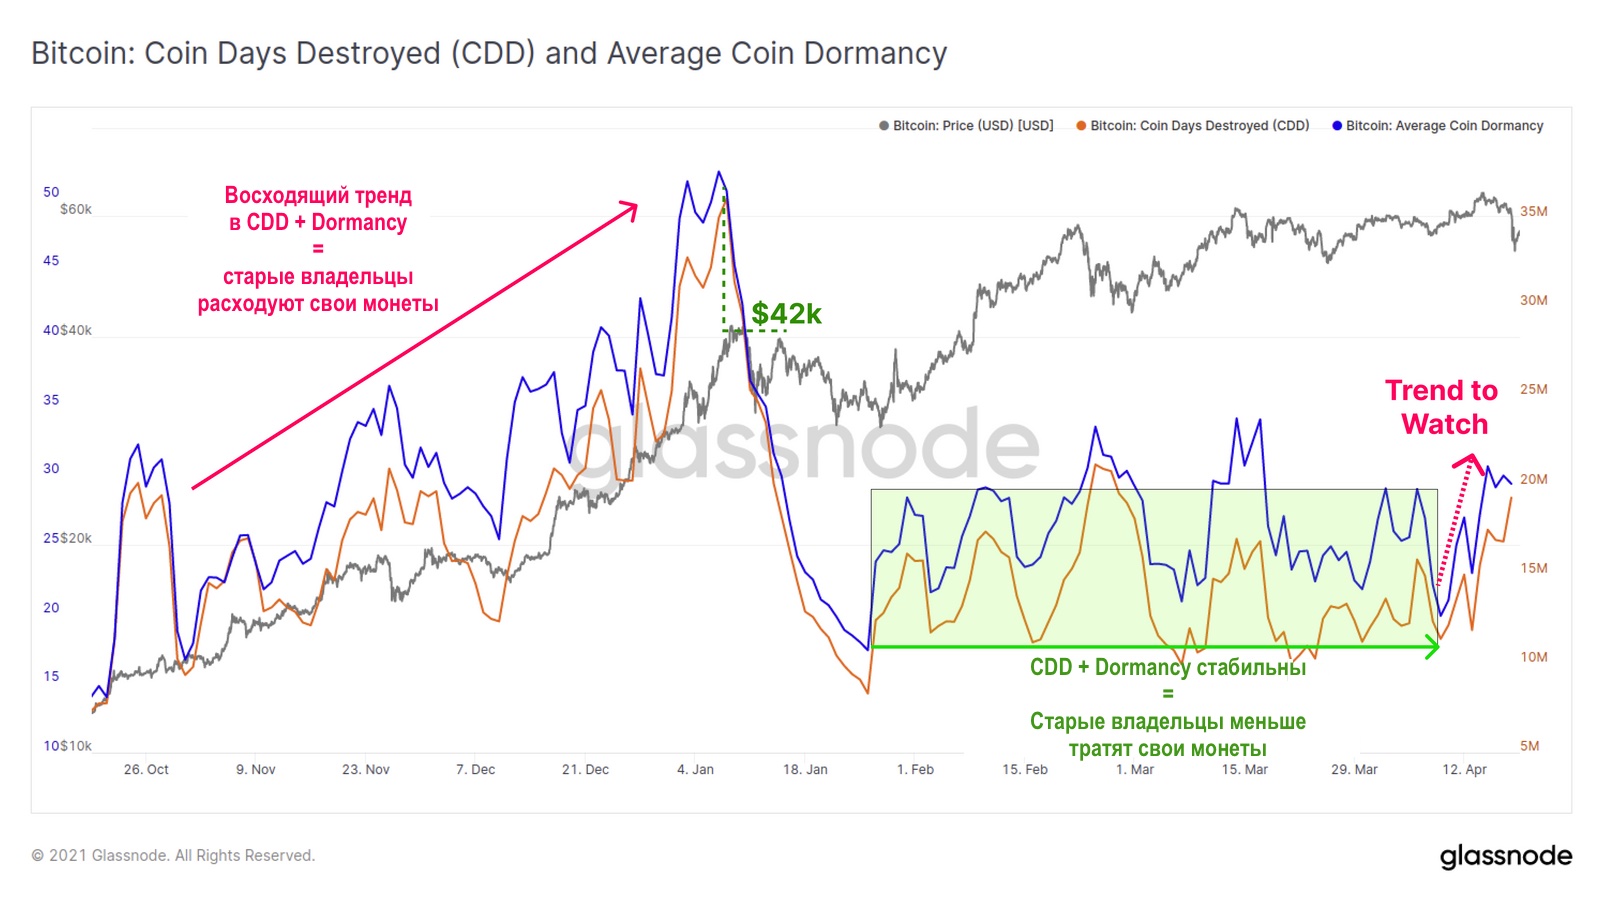
Coin-Days Destroyed and Average Dormancy. (Link to interactive graph)
LTH-SOPR (SOPR for long-term owners)paints a similar picture, showing that the "old" coins gradually took profit during the March-April consolidation. Periodic surges in LTH-SOPR indicate that long-term holders are making a profit, who can increase the liquid supply by returning long dormant coins to active circulation.
However, during this weekend's salelong-term holders seemed to be in no hurry to dump their BTC. The LTH-SOPR ratio has also returned to relative lows, last seen near the local low of $43k set in late February.
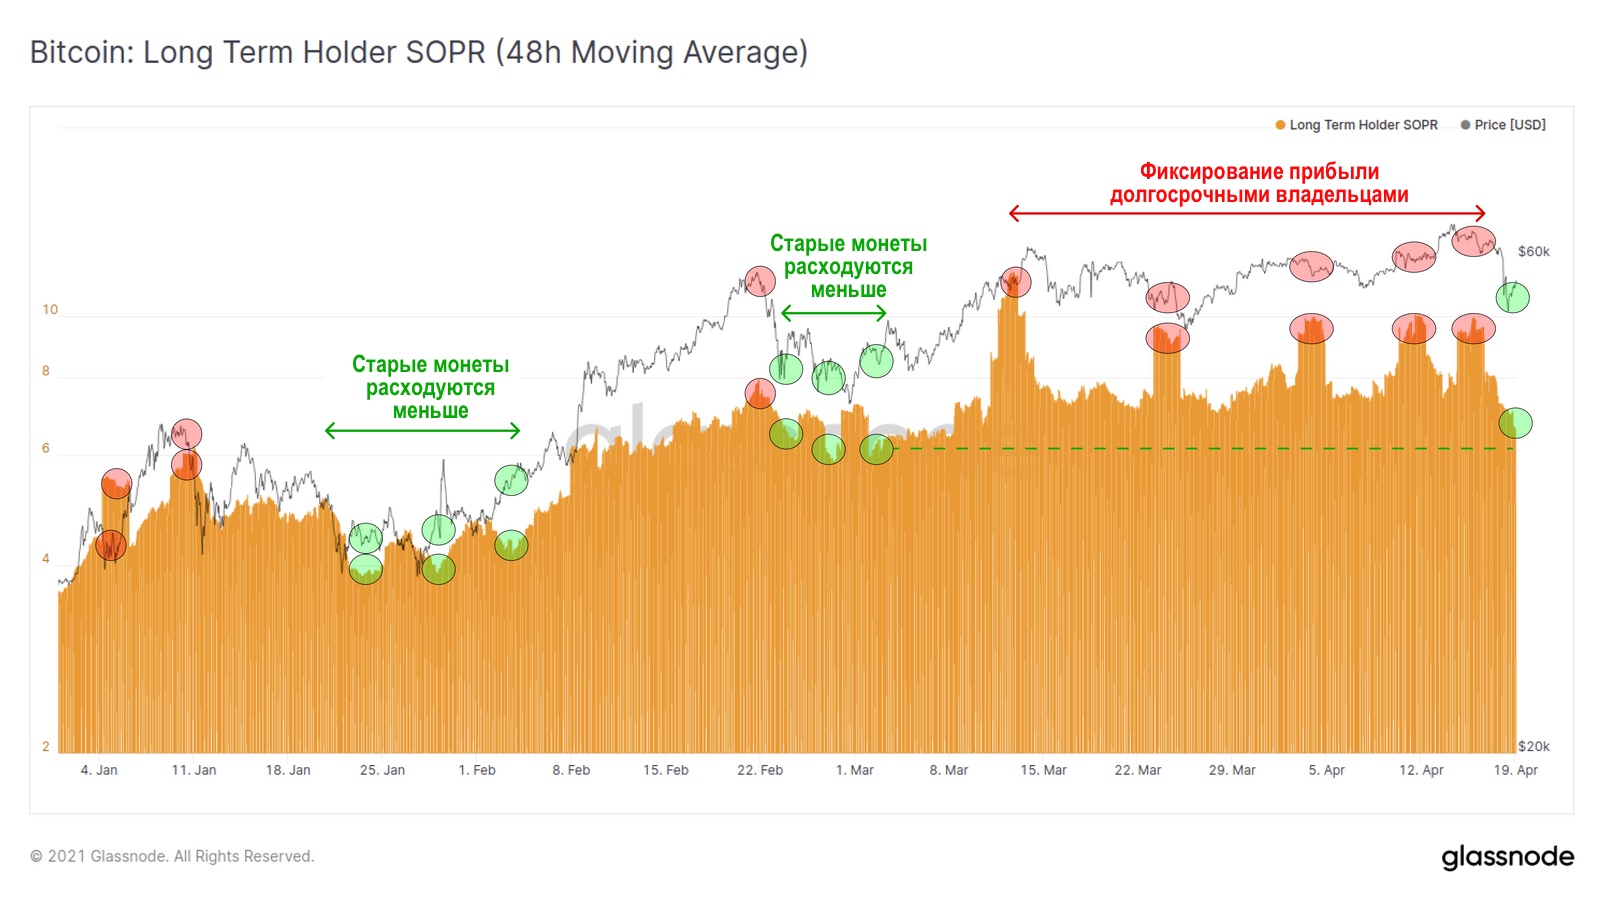
LTH-SOPR (48h MA). (Link to interactive graph)
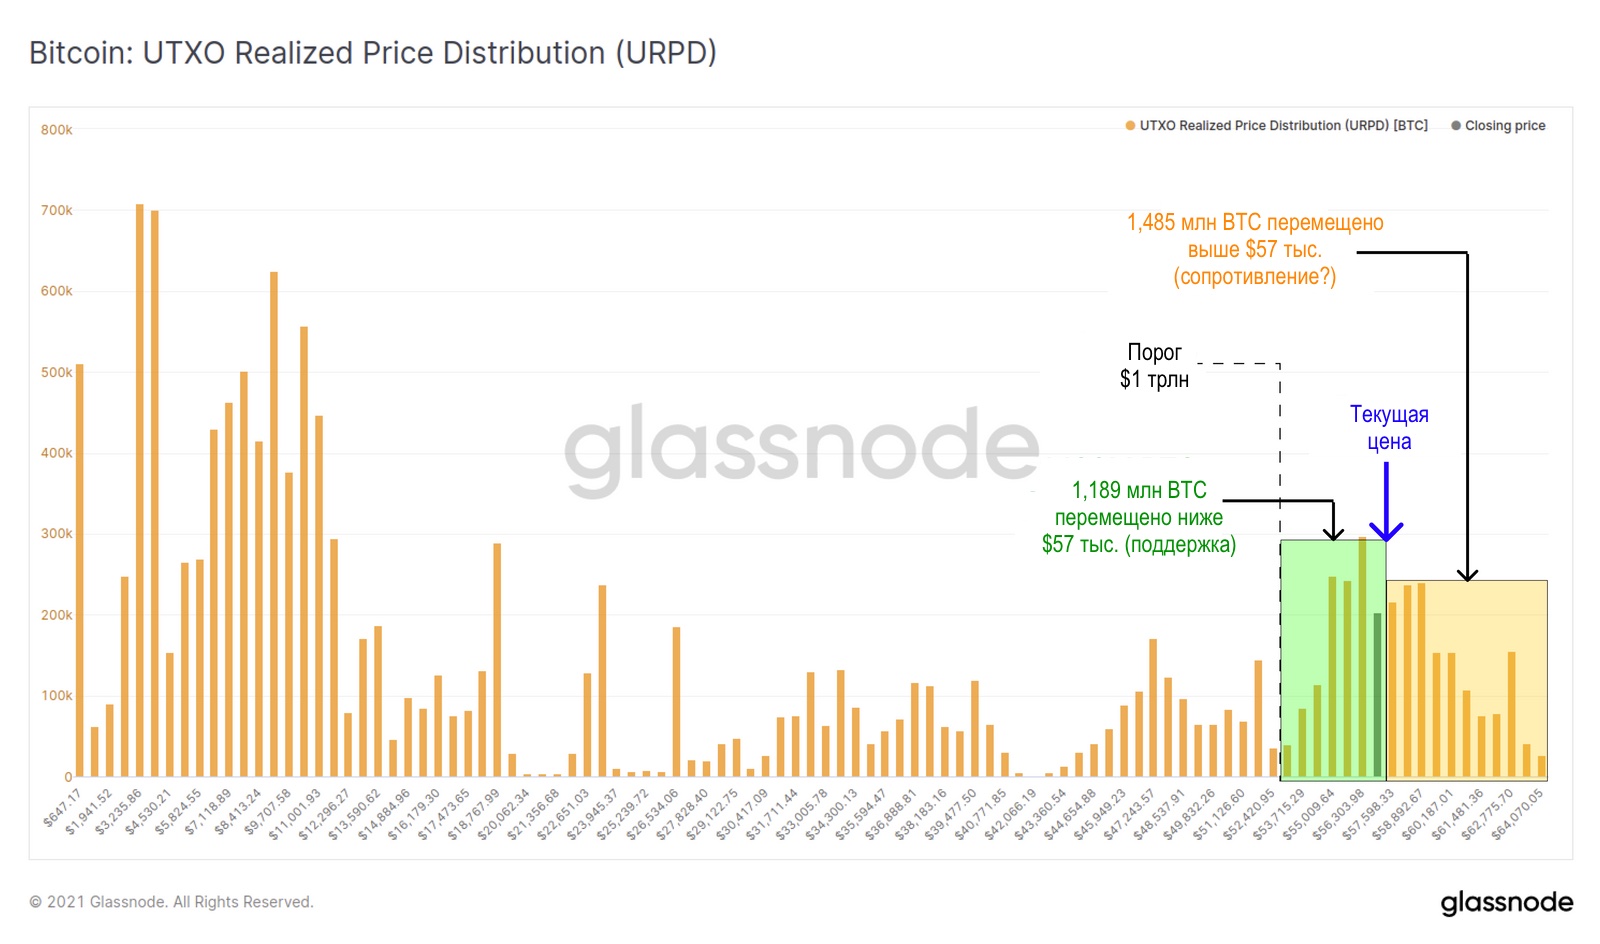
Potential risk associated with the incidentweekend sale, is that the price, with its aggressive movement, somewhat undermined the stability of the $53.5 thousand level, corresponding to the psychological capitalization level of $1 trillion.
However, the price made a strong rebound andclosed well above this level, which puts the market back within a strong cluster of on-chain transaction volume. So far, a volume of BTC equivalent to 14.32% of Bitcoin's circulating supply has moved at prices above $53.5K.
This cluster of on-chain volume appears to becould provide strong price support and help protect the $1 trillion capitalization level (at least it appears to be doing so for now). In this support zone above the $53.5K level but below the current price of ~$57K, 1.189 million BTC (6.37% of the circulating supply) were moved on-chain.
However, this zone may also determine the baseprice for a significant part of the market, and it is quite possible that if negative sentiment increases, some of these coins will increase the active supply. A larger amount of 1.485 million BTC (7.95% of the circulating supply) was moved on-chain above the current price. And this volume profile, along with indicators of spending of older coins, are perhaps the key on-chain metrics to watch during the current correction.
UTXO realized price distribution (URPD) for BTC. (Link to interactive graph)
Topic of the week: new market participants
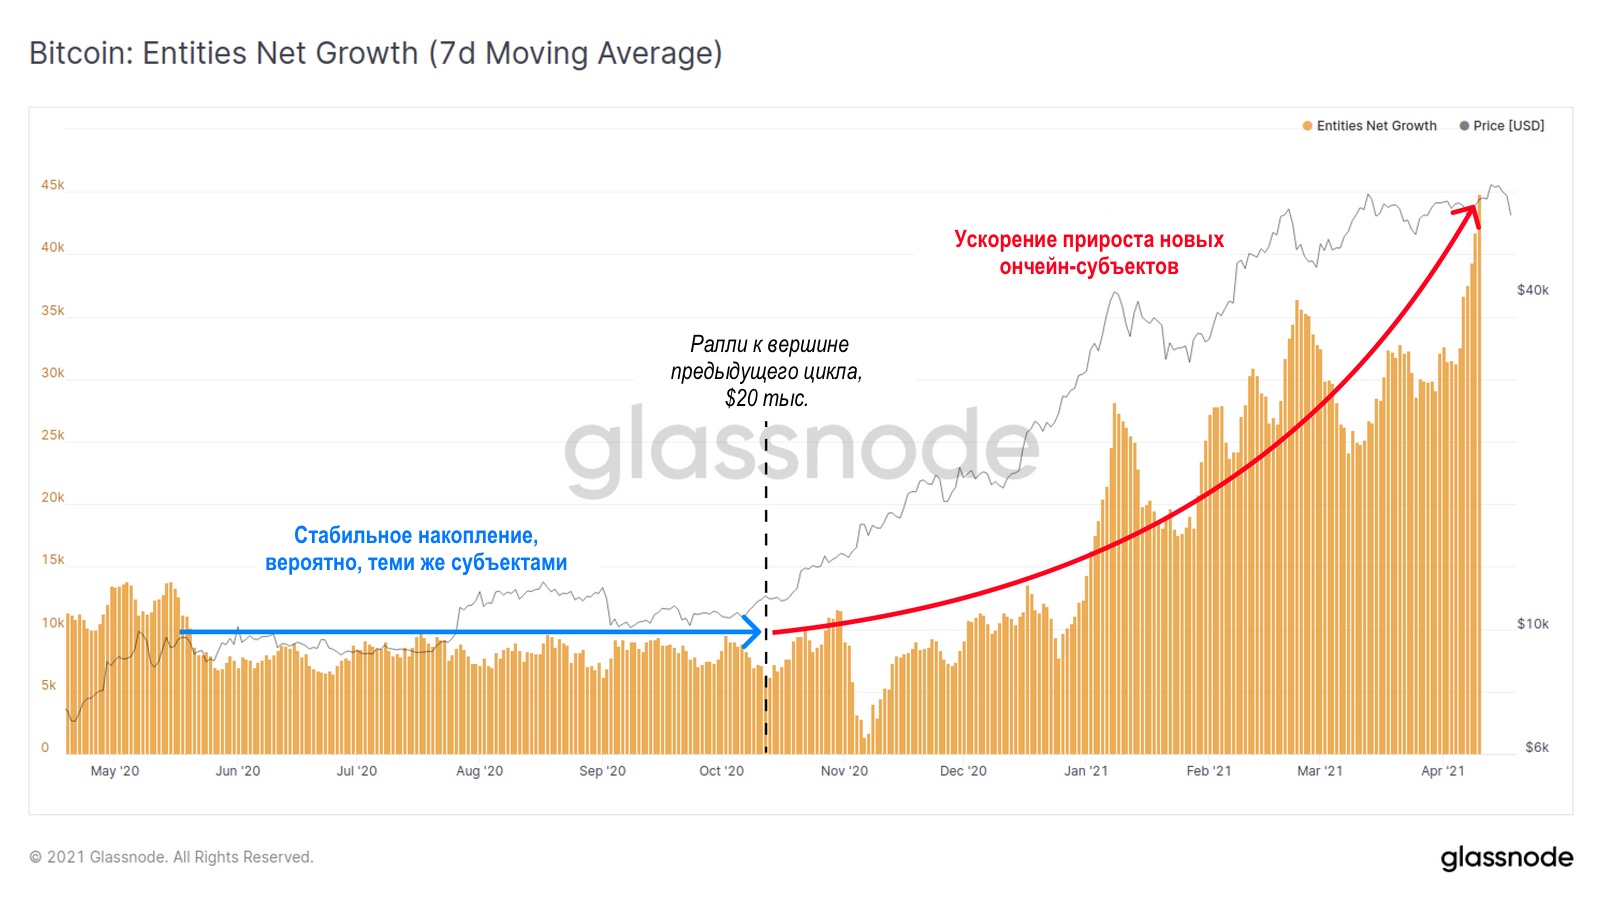
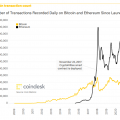
The tendency of participation in the market of retail investors inlast week, it continued to accelerate with a parabolic growth in the number of new on-chain entities. We determine the growth in the number of network entities by changing the created unique clusters of addresses (new UTXOs) in comparison with the destroyed unique clusters (spent coins).
Until November 2020 (before the rally to $20 thousand., the high of the previous bull cycle), the net growth of network entities - most likely mainly ordinary users who accumulate satoshi on a regular basis - has been relatively stable. Since November, we have seen a parabolic increase in the number of new network participants, and new growth highs were set earlier this week.
Growth in the number of network entities (7-day MA). (Link to interactive graph)
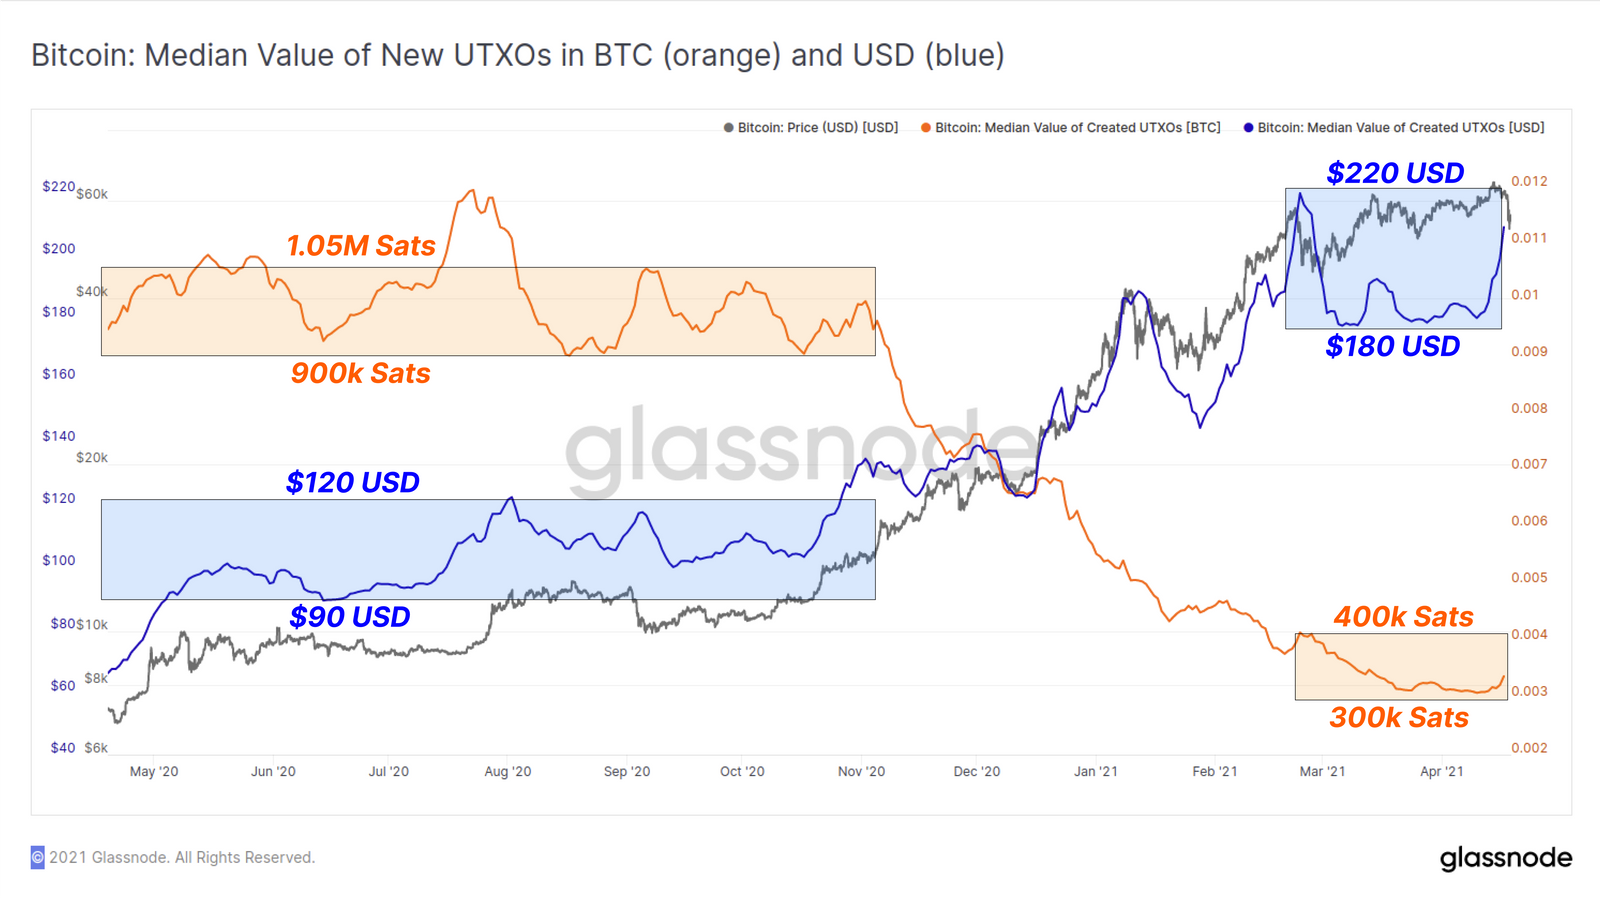
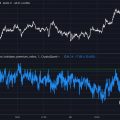
After analyzing the average size of new UTXOs,created on the network, one can roughly estimate the average investment size of new participants. It can be seen that during the accumulation phase at the end of 2020, the median UTXO value was around 1 million sats. (0.01 BTC), equivalent to $90–$120.
As the price and number of network entities increasesThe median value of UTXO in satoshi decreased three times, to 300–400 thousand sats, but in dollar equivalent it was $180–220. This represents a ~600% increase in the purchasing power of BTC, while the average fiat investment size has doubled compared to the end of 2020.
Median value of UTXO in BTC (orange line) and USD (blue line). (Link to interactive graph)
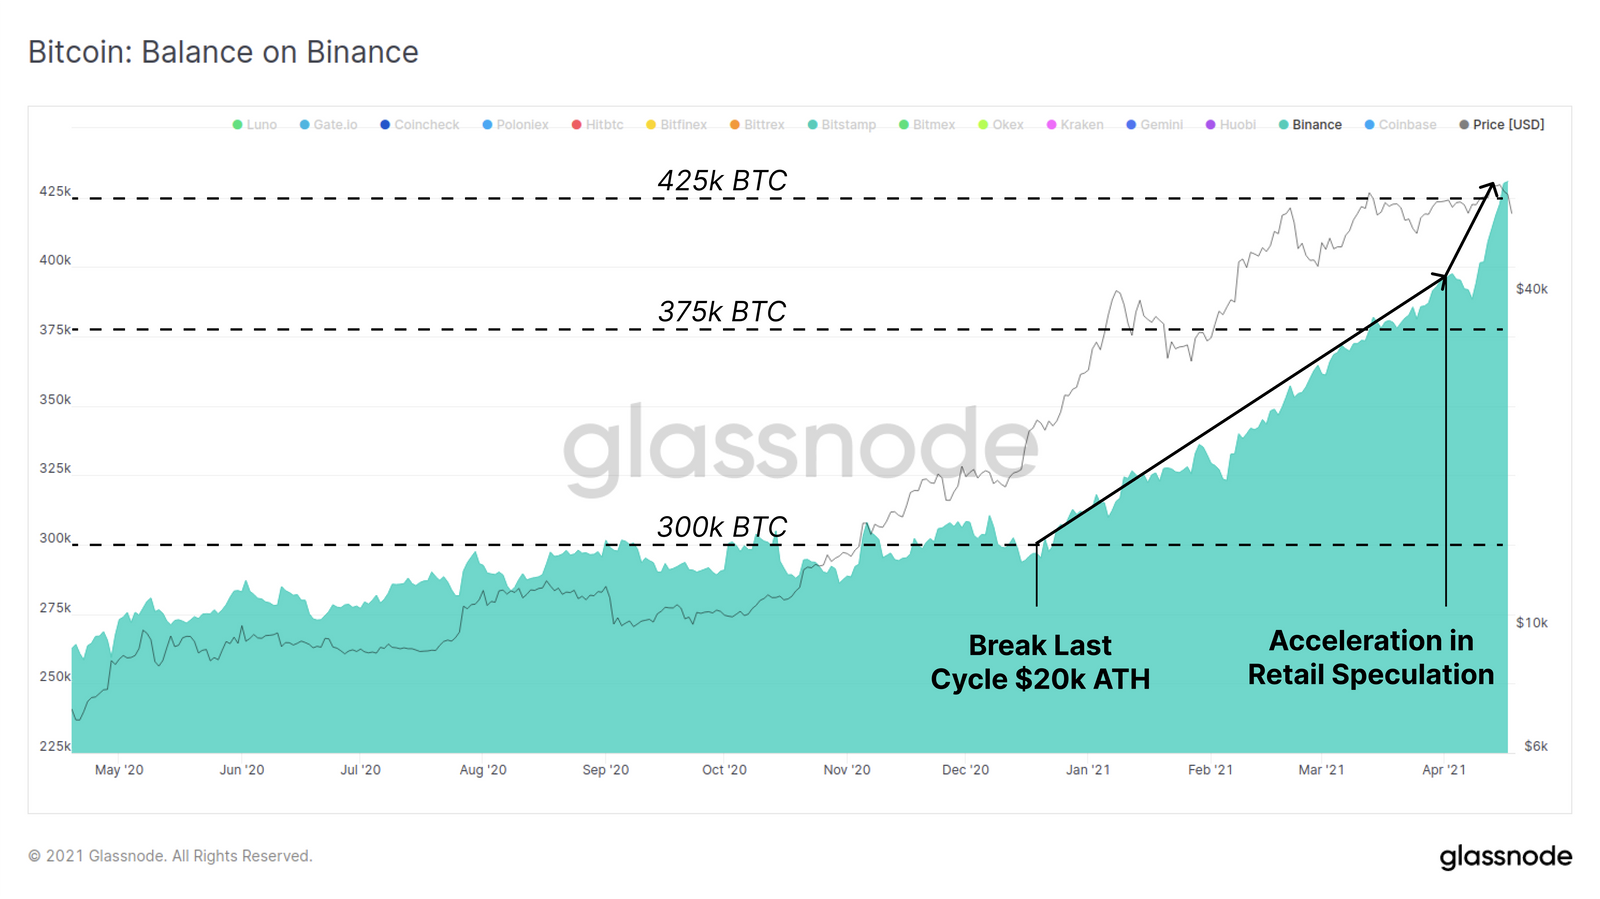
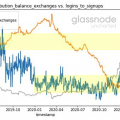
Finally, the speculative activity of retailInvestors appear to be on the rise, as evidenced by the recent performance of a significant portion of the altcoin market. One of the favorite trading platforms for retail investors and traders is Binance, which accounts for the most significant BTC influx of any major crypto exchange.
BTC balances on Binance addresses have been growing steadily since the price topped $20k, but the growth has accelerated in the past two weeks, also indicating that retail speculation is on the rise.
�
</p>Read this:
 Analysis of data on-chain transactions: the innovation of cryptoassets
 Analysis of onchaine metrics tells about the increase in the price of BTC by 10 times
 Report: on-chain activity of bitcoin increased by 21% in May
 The history of on-chain data research by Nick Carter
 Why some on-chain analysts are predicting a bearish scenario for BTC in the short term
 Structural Analysis of the Bitcoin Market | 15 March 2021