Final review for September 2021 – on the state and prospects of the Bitcoin market and its definingmacroeconomic factors.
Content
- On-chain analysis
- Change in liquid supply
- Hodler behavior
- Exchange balances
- Derivatives
- Annual moving basis
- Perpetual Futures Funding Rate
- Leverage Ratio
- Bitcoin mining
- Hashrate recovery
- Difficulty adjustment
- Miners' daily income
- Macro environment
- Evergrande, China debt / GDP
- Consumer price index growth, inflation
- US will have to print, debt / GDP
- Bonds, negative yield
On-chain analysis
“It may make sense to simply postpone a certain amount of bitcoins in case it takes root. And if enough people think this, it will become a self-fulfilling prophecy. ”
- Satoshi Nakamoto.
As many people know, Bitcoin is the most transparentmoney technology the world has ever seen. Thanks to a completely transparent ledger - blockchain - everyone can view and analyze capital flows in the system. Unsurprisingly, from this data, you can get a great idea of what is happening in the bitcoin market. In general, what can now be observed is the growth and formation of the world's first perfect money network, taking root all over the world - "gradually, then suddenly."
But let's take a closer look at the current picture.
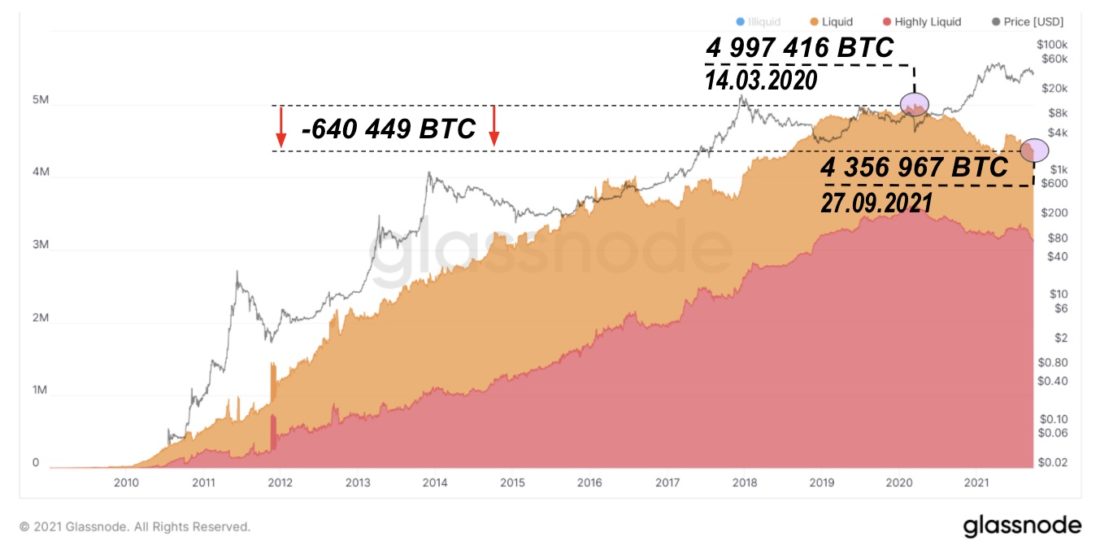
Bitcoin: liquid (orange area) and highly liquid (red) supply
Let's start with a liquid offer.The trend here is clear: the Bitcoin market has changed since March 2020. As an indicator of the liquidity of a network entity, L, we use the ratio of the total outflow to the total inflow of funds at the addresses controlled by the entity during the entire life of the corresponding cluster. The trends in liquid (aggregate balance of entities with 0.25 ≤ L < 0.75) and highly liquid (aggregate balance of entities with L ≥ 0.75) supply changed dramatically 18 months ago. Since then, the supply of liquid and highly liquid Bitcoin has decreased by 640,449 BTC, even as the total circulating supply increased by 559,056 BTC over the same period. We wrote more about assessing the liquidity of the Bitcoin supply here.
Simply put, the past 18 months have seen the largest accumulation period in Bitcoin history.
Another illustration of the same trend is thismetric of the 30-day change in the liquid supply of Bitcoin. While a significant reversal could be seen in May, with 276,106 BTC moving from illiquid to liquid entities, this was followed by a massive re-accumulation, leaving the figure at -104,707 BTC month-on-month at the end of September. Despite the price consolidation, the “smart money” is very actively accumulating BTC.
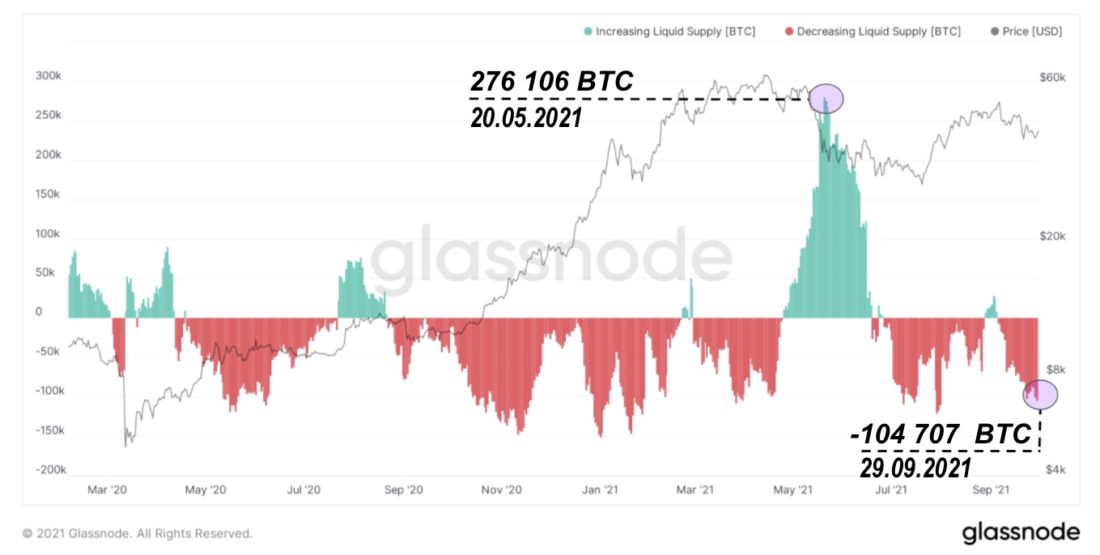
Bitcoin: changing liquid supply
Many traditional investors or financialMainstream media observers love to talk about the reasons why the price of bitcoin rises or falls on a given day, but the funny thing is, often these price swings have nothing to do with any of the thoughtlessly reproduced narratives about bitcoin. But why?
The bitcoin market has global liquidity andincludes not only a robust spot market, but also a derivatives market traded on many exchanges that offer up to 100x leverage. This means that often the price movements “on the news” have nothing to do with the news of the day.
Long Term Price Trends Actuallydetermined by stakers and hodlers, and by no one or nothing else. Often "news events" lead to a short-term price jump, but it quickly regains and levels off, because these events and risks have long been "embedded in the price."
Especially in the past six years, the factor that has really driven the market cycles of bitcoin has been long-term holders, and this is clearly evident in the data below.
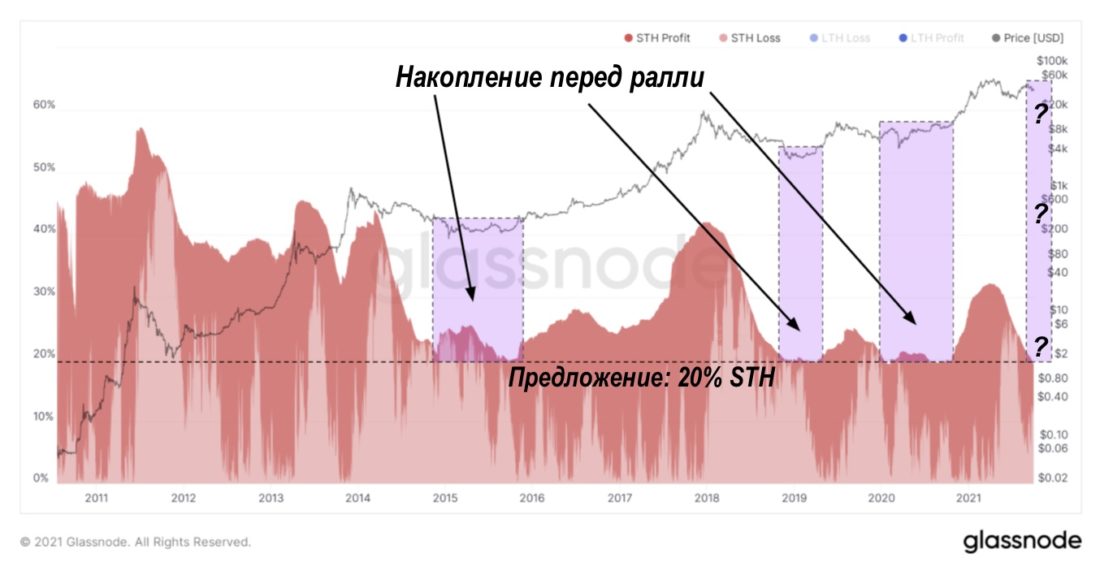
Historic low of BTC supply held by short-term owners
Since 2015, before every parabolic movementthe number of bitcoins in the hands of short-term owners reached a minimum of 20% of the circulating supply as a result of the gradual flow of coins from short-term speculators into the hands of longer-term and committed investors. Corresponding accumulation zones are highlighted in purple on the chart.
It's simple:Hodlers and stakers are forming a support for the price, and now it looks like a new support level is forming at $40K. For perspective, $40K is 300% higher than the price at which Bitcoin was trading just a year ago!
Another metric that reflects what is happeningBitcoin's shrinking supply is HODL waves for coins older than three months. To date, 84.87% of bitcoins have not moved for more than three months, the highest in the entire history of the network. I think the overall theme of this report regarding Bitcoin's blockchain performance is pretty clear, but I want to add a little more perspective and dimension to this picture.
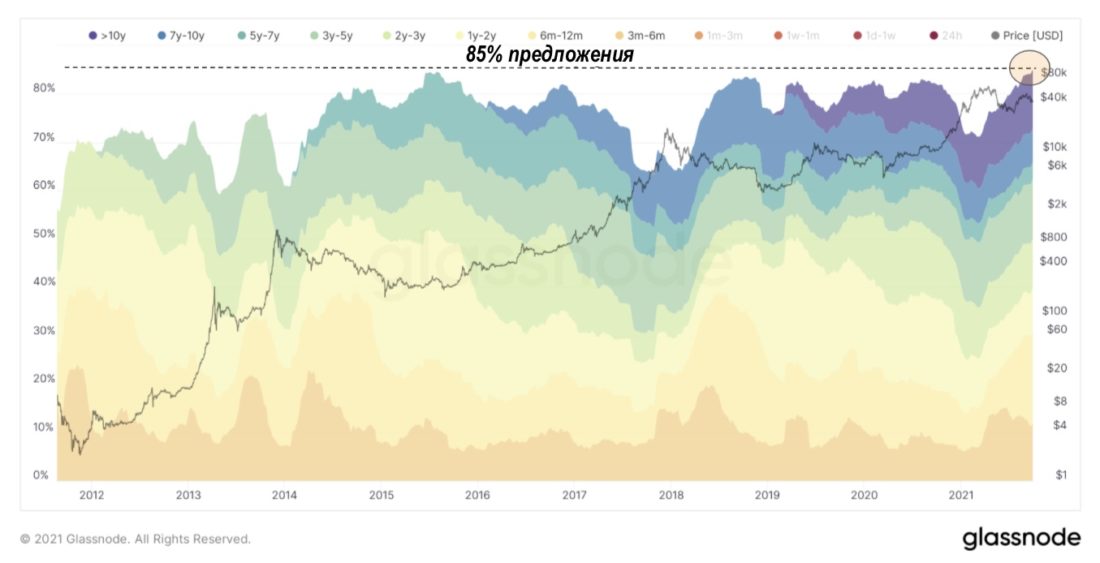
All-time high (84.87%) percentage of BTC held > 3 months
Compression sentences:the next wave of large capital allocators- Wall Street, corporate treasurers, sovereign wealth funds, insurance companies, etc., who come into this market will be unpleasantly surprised to realize that they cannot build an adequate position without triggering a significant increase in the market.
Additionally, when looking at overall BTC exchange balances, as of September 29, exchanges have the lowest amount of Bitcoin available in over three years since August 2018—2,457,418 coins.
Although this is still a fairly significant figure,constituting 13.05% of the circulating supply, the balance of BTC on the exchanges is another indicator of supply with a trend that has sharply changed since March 2020, and everything indicates that the current downtrend will continue in the future.
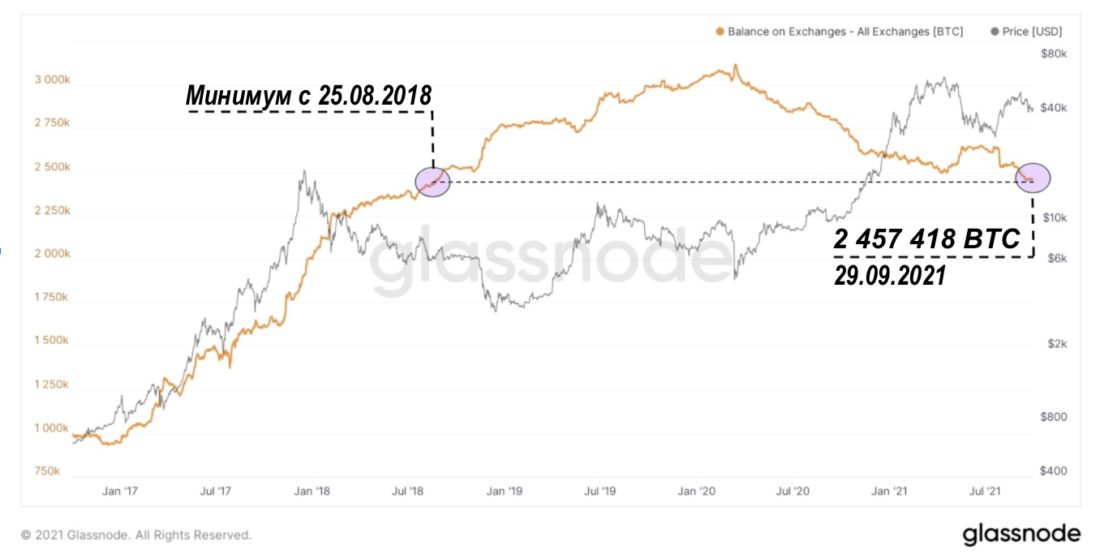
Bitcoin: exchange balances
In addition, the analysis of the percentage of OTCand the illiquid BTC supply from March 2020 shows a striking correlation. While this strong correlation was not observed between the two until March 2020, the trend reversal in both BTC's liquid supply and balance sheets was the result of an unprecedented worldwide monetary and fiscal easing that forever changed the global macroeconomic landscape. This has served as the ultimate rocket fuel for Bitcoin, which is why the correlation between illiquid supply percentages and price is so significant. We talked in detail about the correlation between the OTC supply and the BTC price in this article.
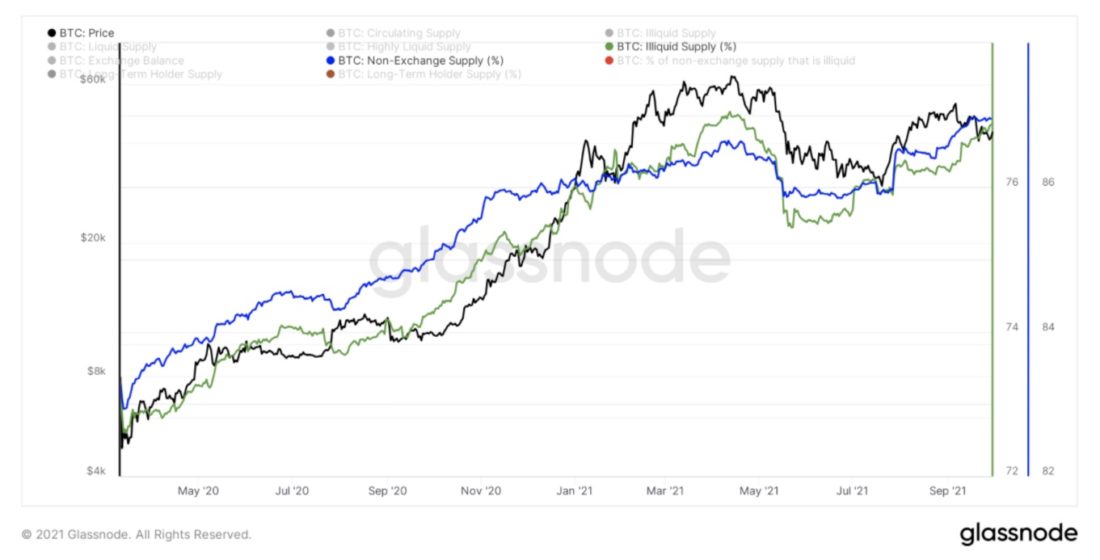
Bitcoin: percentage of illiquid (green) and non-exchange (blue) supply
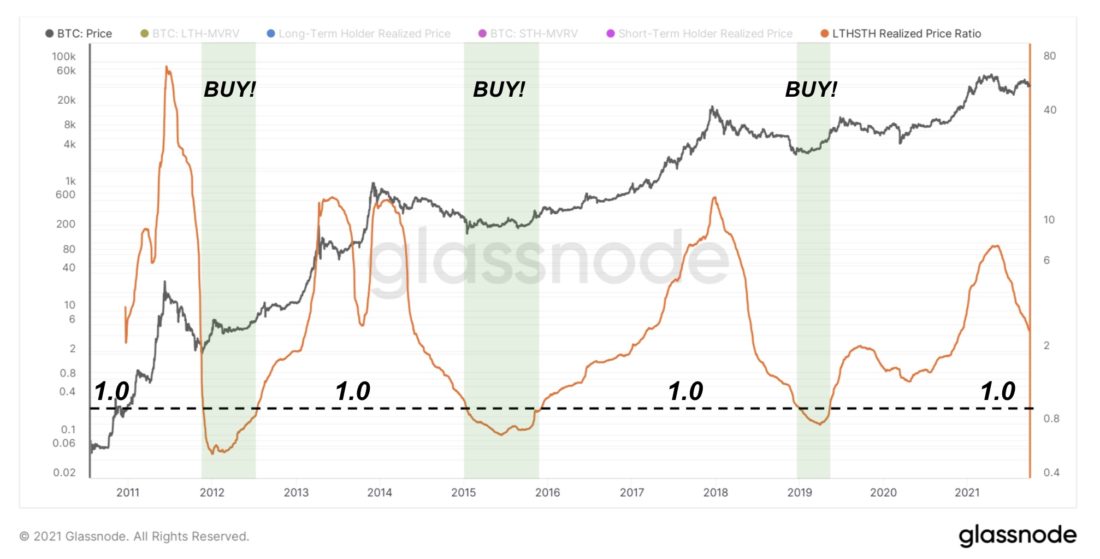
Bitcoin: Realized Price Ratio for Short-Term and Long-Term Holders
Finally, there is the ratio of the realized price forshort-term (STH) and long-term (LTH) holders, which gives the ratio of the average cost basis for two classes of bitcoin investors. The higher the realized price ratio for STH and LTH, the more overheated the Bitcoin market becomes, and from this point of view, the current market situation looks extremely encouraging. The steady rise in the cost base for long-term investors, coupled with the beginning of its decline for short-term owners, opens up significant room for the price of bitcoin to grow in 2022.
Bitcoin derivatives market
The derivatives market is one of the leastunderstandable aspects of the Bitcoin market, especially for those accustomed to working with traditional financial markets. Bitcoin derivatives are a tool for speculating on where the price of BTC will go in the future. There are different types of these Bitcoin-based financial instruments: quarterly, perpetual futures, options, etc. What they all have in common is that the value of these contracts is determined by the underlying Bitcoin spot market.
Often vertical movements of the price chartBitcoin, whether up or down, are the result of imbalances in the derivatives market, which this movement corrects. As an example of a possible situation with Bitcoin derivatives, if you have 1 BTC, you can open a position worth 10 BTC using 10x leverage, but if the market moves against you by 10%, your position will be forced closed and the deposit will be used to cover the loss - this is called liquidation.
Perhaps the most popular type of derivatives onbitcoin is "perpetual swaps". These are derivatives native to the crypto market, similar to regular futures contracts, but extended indefinitely.
However, the subtlety with perpetual swaps isin that to tie their value to the price of the underlying asset, the funding rate is used, which is paid out and reset every 8 hours on most exchanges. If the perpetual swap is trading above the spot market index, the funding rate will be positive, that is, traders wishing to keep longs open will have to pay a certain percentage of their position size to traders in the opposite market position, shorts. Consequently, the financing rate can be used to assess the expectations of the derivatives market participants at a particular point in time.
It is important to note that, all other things being equal, the rateFunding for perpetual futures is usually slightly positive as traders tend to be bullish on the most profitable asset in human history.
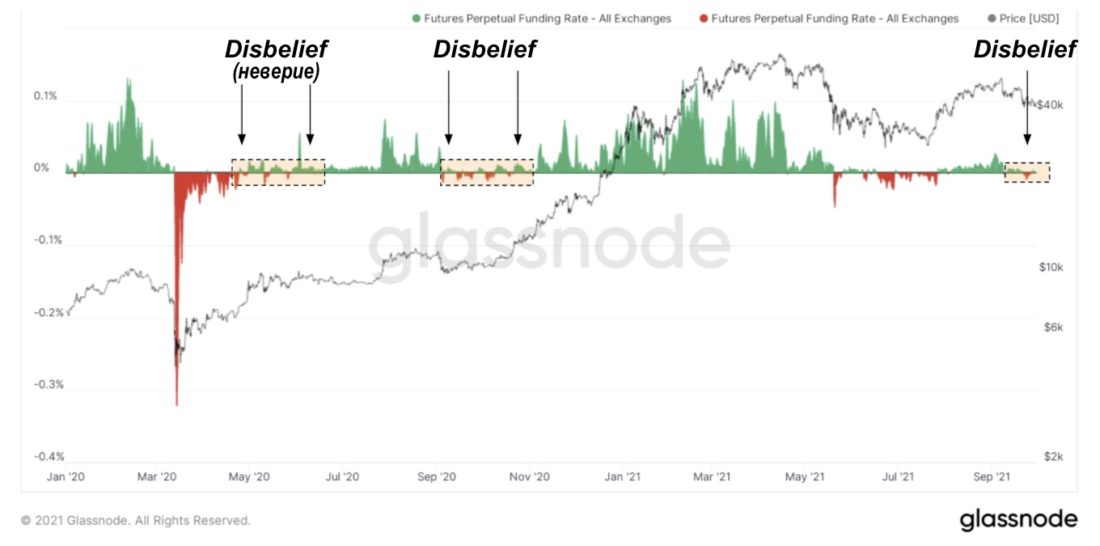
Bitcoin Perpetual Futures Funding Rate
Looking at the market in recent days and weeks,Funding for perpetual swaps ranges from slightly positive to slightly negative, which is in stark contrast to when bitcoin first hit today's levels. This is consistent with our belief that the price of BTC is supported by strong demand in the spot market, and this is a much healthier situation than when price movements are driven by excessive leverage in the derivatives markets, which is fraught with deep drawdowns and cascading liquidations like those in May.
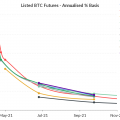
You can also look at the annual moving basis.futures, reflecting the return that can be obtained by simultaneously buying spot bitcoin and selling a futures contract. In this case, a 3-month interval is used. In early 2021, many started talking about bitcoin's contango, and many in the traditional financial system began to pay particular attention to this, including J.P. Morgan, which published a detailed report on Bitcoin market dynamics in April.
As it turned out, the release of the report and a flurry of interest withWall Street hit the top, and leverage-fueled futures curve bets soon came to naught. Paradoxically, the futures basis collapsed not because of Wall Street arbitrage, as many had predicted, but because there was too little spot buying to support the overleveraged bulls betting on continued gains.
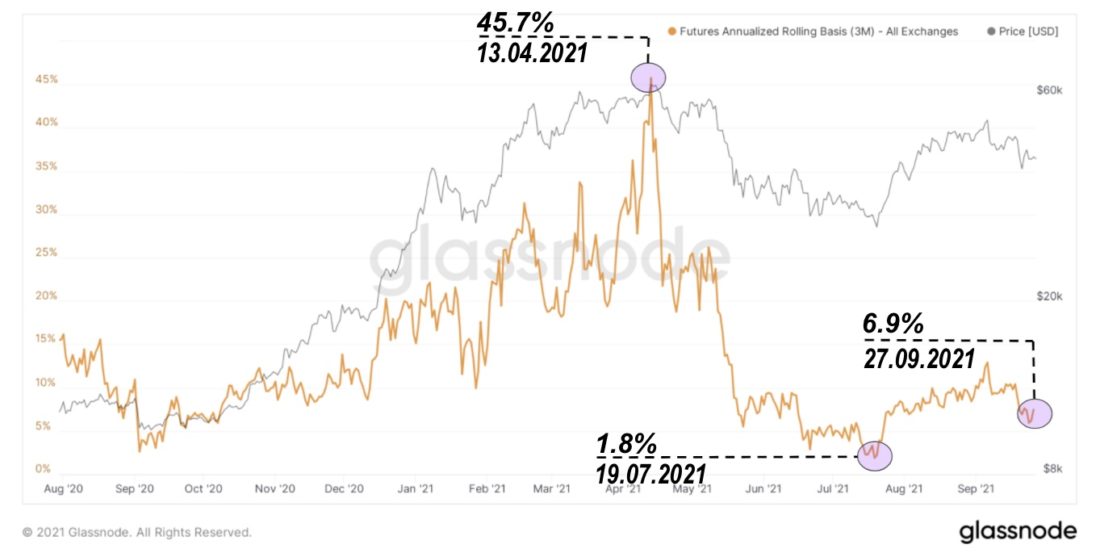
3-month annualized Bitcoin futures rolling basis
Many might expect Wall Street to simply "flatten the curve" with delta-neutral (risk-free) arbitrage, selling futures and buying spot until yields are driven to zero.ifWall Street had a reliable spot instrumentfor placement or a derivatives exchange settled in Bitcoin, but the reality is that the US public capital markets still have neither.
So something else happened:in the crypto markets, the influx of new money on the buy side, sufficient to support such a high leverage in longs in the derivatives market, simply "dried up" and the basis collapsed. Now that the basis for 3-month futures contracts is only 6.9% year-over-year, the arbitrage mania seems to have all but disappeared, with the price reflecting strong spot demand for bitcoin.
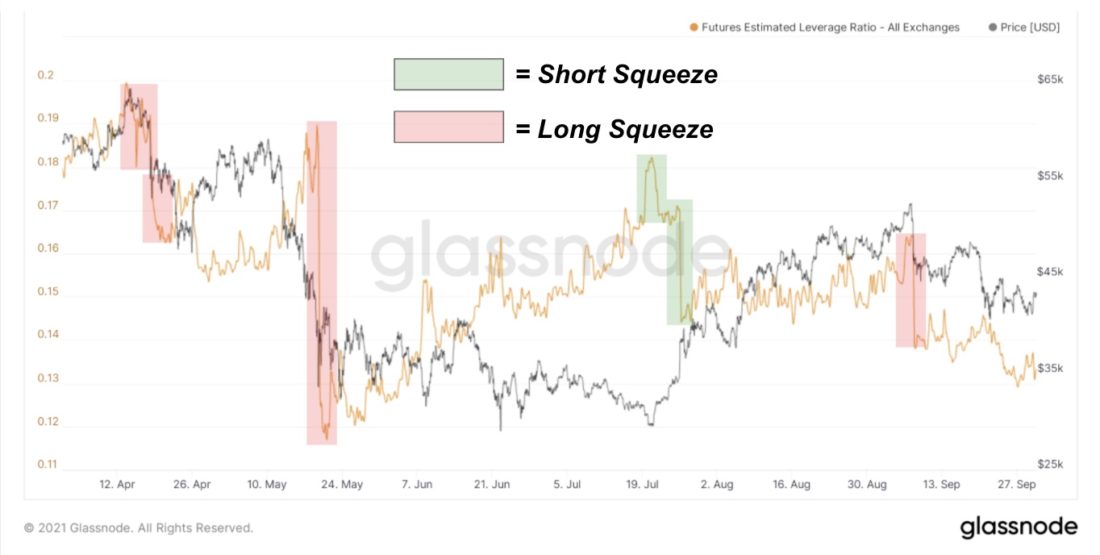
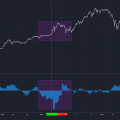
Leverage Ratio for Bitcoin Futures
Using the leverage ratio,taking into account the general open interest in futures contracts on derivatives exchanges, and the corresponding balance of bitcoins on the addresses of these exchanges, one can visualize liquidations on the side of both longs and shorts.
On the way up, the growth of the level of leverage in the marketbitcoin always resembles a staircase, and on the way down there is an elevator (in terms of the leverage used, not the price). The highlighted areas are liquidations that occur in the derivatives market when the spot market disagrees with the prevailing direction of high leverage rates. This is what happens below the surface almost always when you see the bitcoin price move 10 percent in a short period of time (or any significant spike in volatility). This is natural and beneficial, and volatility is also a function of the natural determination of prices.
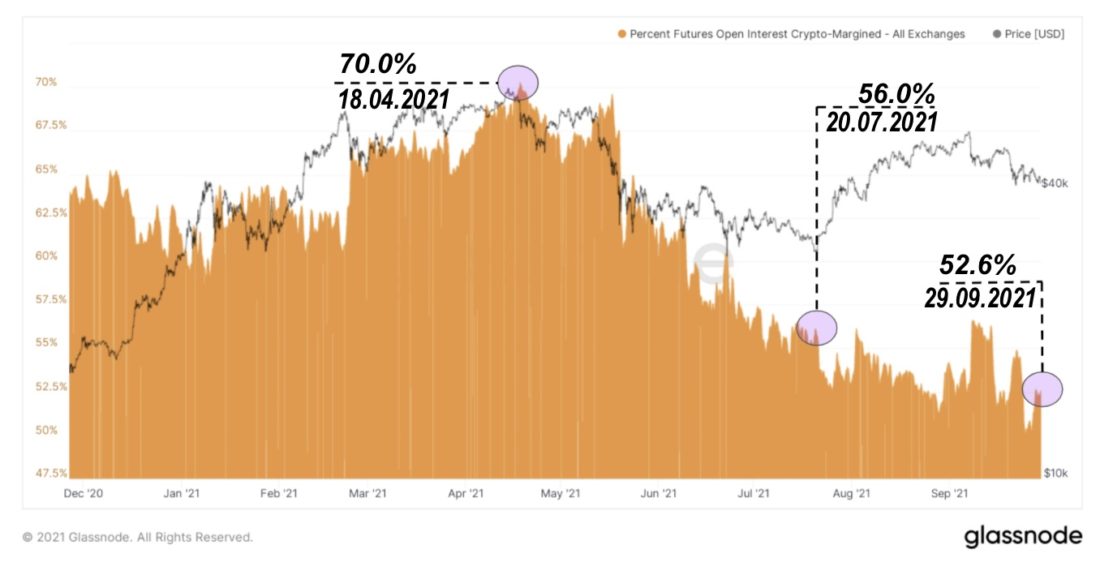
Bitcoin: Percentage of total open interest for futures with BTC margin
In the structure of the bitcoin derivatives market withThere was an important change in the time of the April local top. In a nutshell, the increase in the number of futures contracts margined in stablecoins instead of bitcoin has made the market much less susceptible to large liquidations on the long side due to the negative bulge that occurs when longs are opened on bitcoin with BTC margin.
It is probably worth warning that for 99% of people,with an interest in bitcoin, the strategy of simple accumulation and hodling is quite sufficient and has the highest expected return. Leveraged speculation and volatility trading with options is a losing game, while the expected profitability of owning an asset during its initial monetization is still very attractive.
But whatever option you choose for yourself, you must remember that younevershould not put themselves in a position in whichyou risk losing everything due to a spike in volatility. Well, yes: you will never be liquidated if you store your private keys yourself and your satoshi in a cold wallet.
Bitcoin mining
Network resilience
This year, due to the massive exodus of minersfrom China, we witnessed the largest stress test ever for the Bitcoin mining network. The shutdown of so many hashpower was accompanied by a record 28% downward adjustment in difficulty, and this historic moment was closely watched by everyone to see how resilient the network really was. If Bitcoin wants to compete with other currencies as a global money network, it must be able to absorb market shocks of this magnitude while maintaining hash rate over the long term. It is this ability that the network has proven in practice.
In response to this test, the network hashrate continuesrecovering at an exceptional rate, reaching more than 140 Thesh/sec in less than three months from the July lows. The network was not interrupted for a second, since significant amounts of hashing power were distributed throughout the world.
As a consequence of the hashrate recovery, we sawfive consecutive upward adjustments in difficulty, for a total of 38.94%, and the 13.24% increase in September is one of the most significant in the chain's history. Even with a shortage of semiconductor chips and a lack of available mining capacity, this is a compelling answer demonstrating the power of innovative decentralized engineering solutions and protocol incentives.
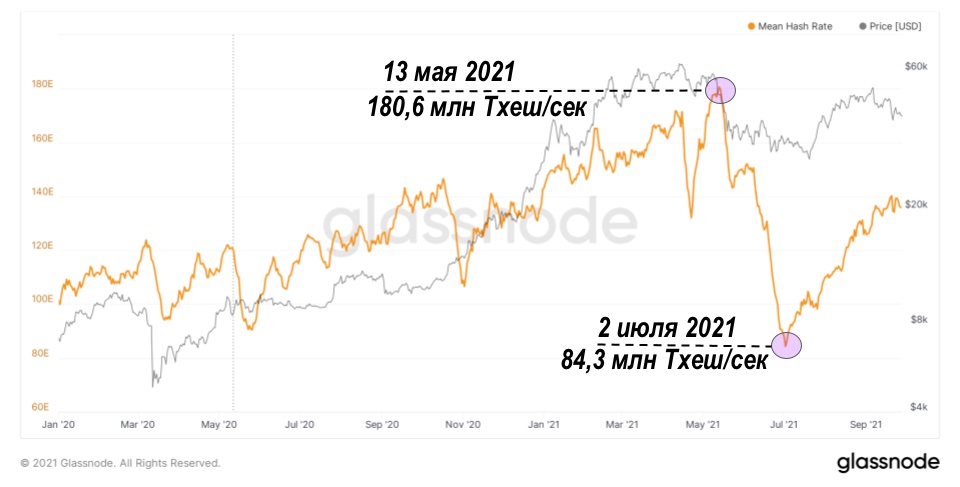
Bitcoin Hashrate (7d MA)
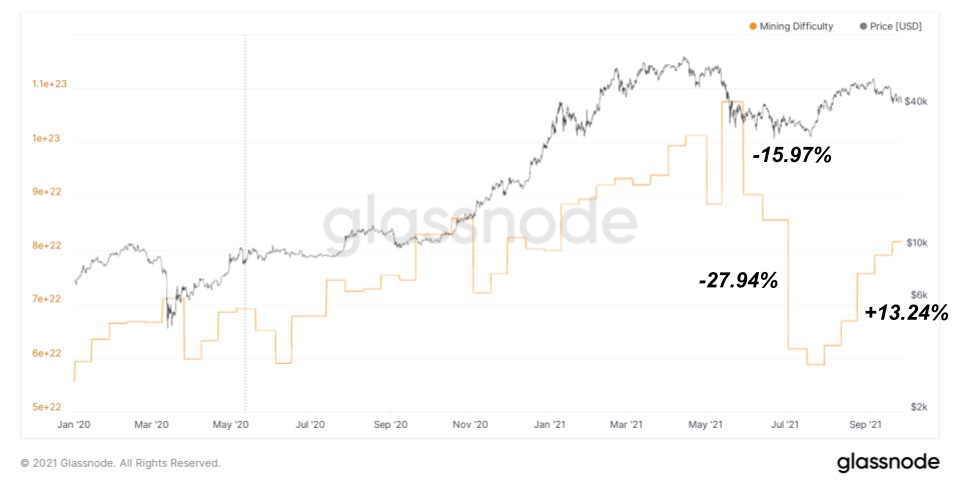
Bitcoin: Mining Difficulty
Miners are now generating $39.32 million per day, whichimplies an annual industry turnover of more than $14 billion. Publicly traded North American mining companies have seen exceptional year-to-date growth of 140%, signaling positive and growing investor demand for participation in this emerging industry.
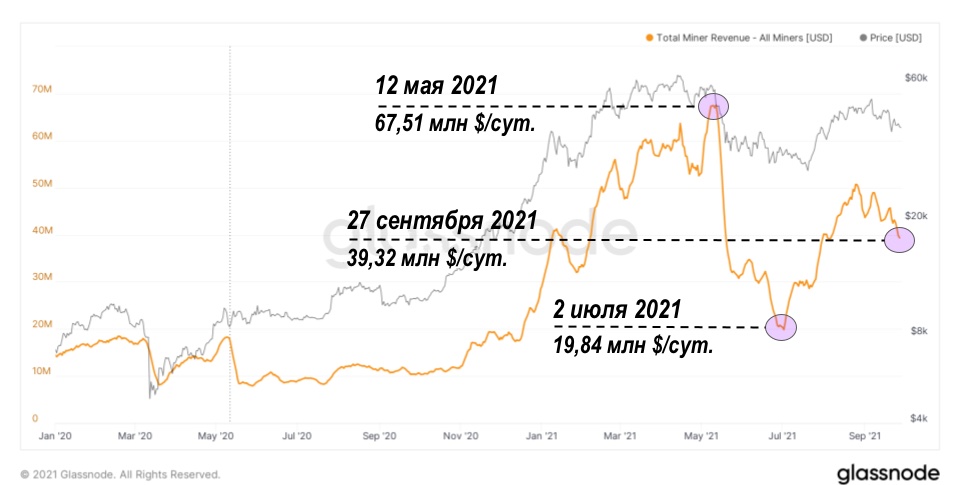
Bitcoin Miners Daily Return (7d MA)
At the same time, we have seen that bitcoin miners are notscrapping or scaling back their plans to rapidly ramp up production until 2022, also demonstrating a stronger commitment to bitcoin hodling, signaling that healthier hashrate growth is just beginning. Huge fluctuations in daily mining profitability, up to 3.4x per day, seem to have little impact on the market. This summer's events appear to have significantly strengthened the mining network by eliminating weak players in a process comparable to liquidations in the derivatives market. Only the strongest and most well-managed businesses will remain in the most competitive market in the world.
Macroenvironment
Evergrande
The main macroeconomic topic of the last monththe collapse of China Evergrande Group and whether it will have consequences comparable to the bankruptcy of Lehman Brothers in 2008. As for the impact on world markets, no comparable consequences have yet been observed. We wrote about the immediate short-term impact on global markets here.
Structurally Evergrande - Statea venture that borrows funds from state banks to build real estate in China, so for now the impact of the company's collapse seems to be limited to the Chinese real estate sector and the economy. But if the entire real estate sector and the construction industry slows down for an extended period, this will become a serious problem.
To cope with the crisis and increased demand for liquidity, the People's Bank of China (PBoC) injected 460 billion yuan ($71 billion) of short-term cash into the banking system.
At the same time, the Chinese governmentasked other state-owned companies to buy Evergrande's assets to enable them to pay off debts. Just last week, a Chinese state-owned enterprise bought Evergrande's $1.5 million stake in another bank, and Guangzhou City Construction Investment Group is close to completing a deal to acquire Guangzhou Football Club's stadium for $1.9 billion, suggesting a state-led rescue of Evergrande rather than direct assistance.
The Chinese Communist Party is making it increasingly clearunderstand that their new goal of "common prosperity" will prevent powerful capitalists from exerting greater influence over the population. Providing direct government support to the second largest real estate developer in the country in a situation of a hot housing market with frenzied prices, already under scrutiny by the government, would be the wrong signal.
In addition to the Evergrande situation, China has moved torationing of electricity for household and industrial consumers due to the lack of coal. This could have a greater short-term direct impact on global markets as China's largest manufacturing centers face downtime and capacity constraints, further slowing global supply chains.
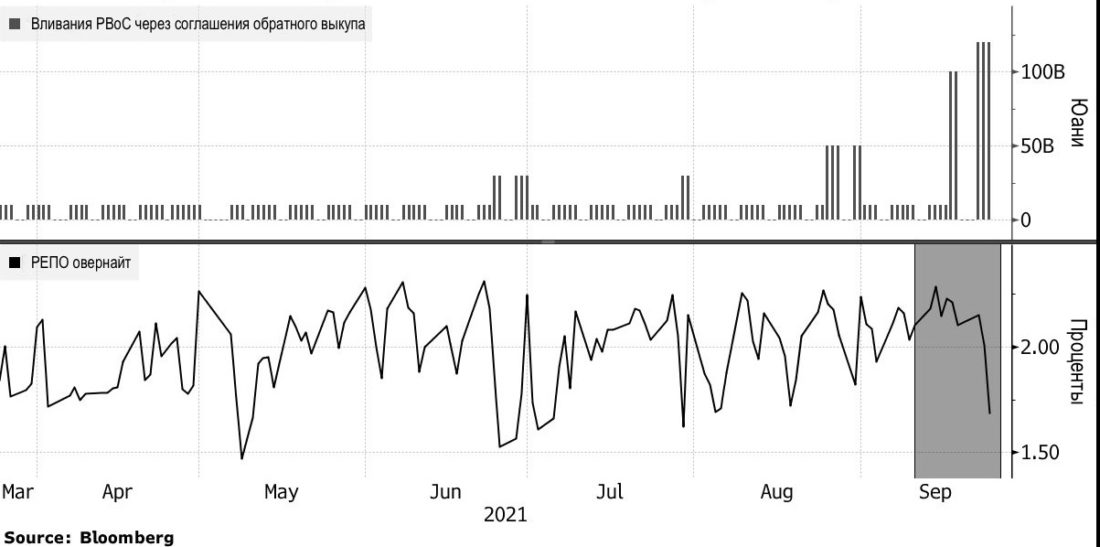
Liquidity support: Lower borrowing costs in China amid large PBoC cash injections.:Bloomberg
Regardless of the potential impact thatemerging in the coming months, what Evergrande reflects is symptomatic of a bigger problem - the economic model of an overly indebted sovereign state that, in the face of declining gross domestic product growth, seeks high growth at any cost by increasing debt issuance. China's total debt to GDP ratio has grown from 172% in 2008 to over 300%.
“Users are forced to trust banks instorage and electronic transfer of their money, but they use users' money to issue loans, leaving only a small part of them on their accounts and provoking waves of credit bubbles. We are forced to trust them in matters of confidentiality of their data - in the fact that attackers will not be able to use our personal data to withdraw money from bank accounts. Their huge overhead makes micropayments impossible. "
- Satoshi Nakamoto.
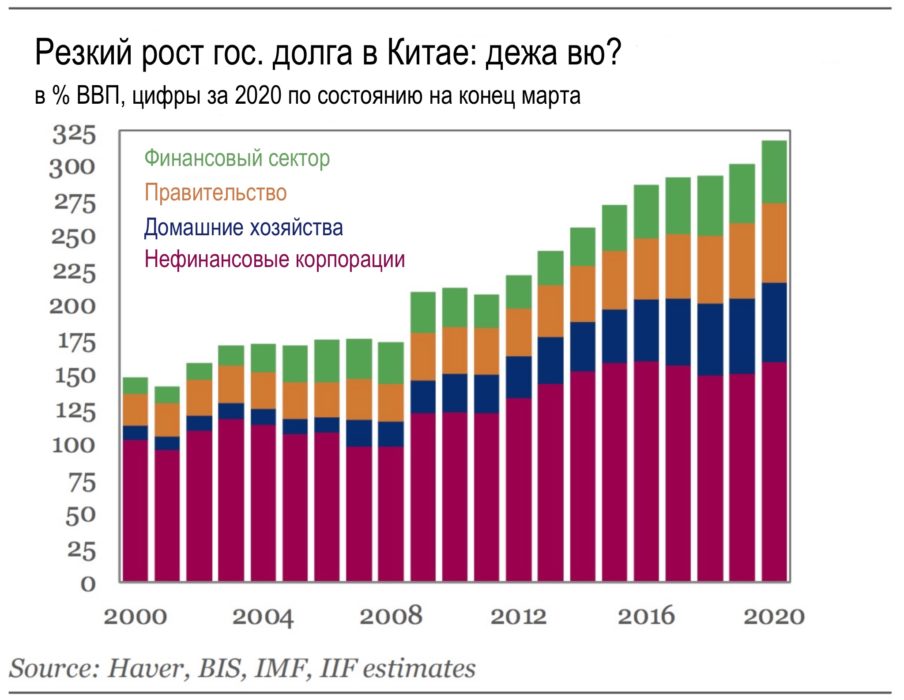
:IIF
Consumer price index growth
At the last meeting of the Federal Committee forOpen Markets In September, Jerome Powell and the Federal Reserve announced likely cuts and tightening of monetary policy starting in November. This comes just after the largest annual percentage change in the CPI since 2008. They were going to tweak their inflation knob a bit, but they may have pressed the ON button instead.
The market is still being told the narrative of“Temporary” inflation, attributed mainly to bottlenecks in supply chains, is largely justified. But with supply chain problems emerging, the risks posed by the collapse of Evergrande, and the unfolding energy crisis with skyrocketing prices, there are strong externalities beyond the Fed's control when it comes to containing inflation in a globally interconnected market.
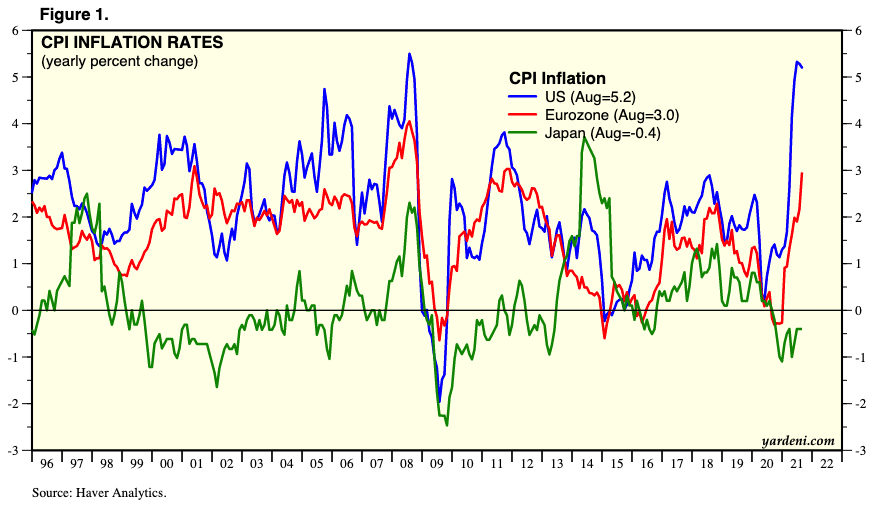
CPI inflation, annual change in%.:yardeni.com
It should also not be forgotten that in relation toinflation tactics we are in uncharted territory. What we have seen for the first time in the past two years is “helicopter” payments provided through fiscal policy, while interest rates have been purposefully kept at record lows through monetary policy.
This reproduces in detail the scheme described in the article (PDF, eng.) BlackRock Institute from 2019, titled "How to Cope with the Next Downturn: From Unconventional Monetary Policy to Unprecedented Political Coordination."
This article was written by Stanley Fischer et al. Fisher is a former vice chairman of the Federal Reserve, former governor of the Bank of Israel and mentor of Ben Bernanke.
The article outlines a program of action forovercoming the next economic downturn in unprecedented ways. The authors formulated the problems and challenges that arise when trying to generate just enough inflation and not overdo it:
"This represents the main problem«helicopter» payments: how to put the inflation genie back in the bottle after it is released. As noted above, history is replete with examples of central bank money printing leading to runaway or hyperinflation. At the same time, we have little experience in using «helicopter» payments to create just enough inflation to achieve price stability. History, as well as theory, shows that large-scale cash injections are simply not a tool that can be tuned to moderately increase inflation.”
I would not seriously expect that in the currentmarket conditions, we can still manage inflation and keep it at reasonable levels with this particular recipe for coordinated monetary and fiscal policy, without risking a runaway inflation.
USA will have to print
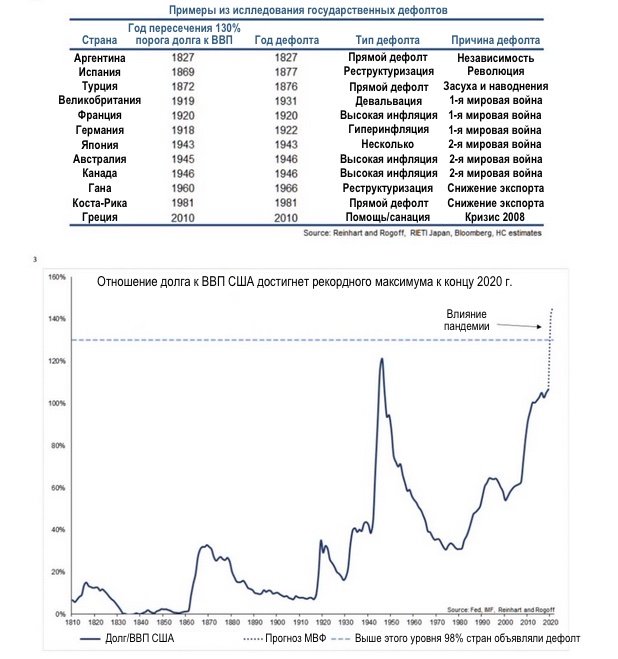
If you zoom out and look at a more generalthe picture, it is clear that the more important goal is still to try to solve the problem of 130% of the debt-to-GDP ratio of the United States through an implicit default. Without a truly miraculous increase in economic productivity, the United States will not have the means to pay off this level of debt.
The United States Can Resolve Its Crisissovereign debt, only by printing more money. Cutting costs is also an option, but politically, it will be nearly impossible for Congress to cut spending on the largest federal commitments in welfare, medical care, and US military spending.
These obligations and interest payments on debt inaggregates already account for 106% of estimated tax contributions to the federal budget for 2020. In fact, they can only be expected to exceed tax revenues further given the 6.2% cost-of-living adjustment in Social Security expected in 2022, a 1.6% increase in the Department of Defense budget this year, and Medicare spending , which are expected to grow by 65% by the end of the decade. This is probably the main reason why Janet Yellen revealed $7 trillion in unpaid taxes.
At the same time, the government has signaled to the market many times that it will do whatever is necessary to avoid an outright default on the debt that finances spending.
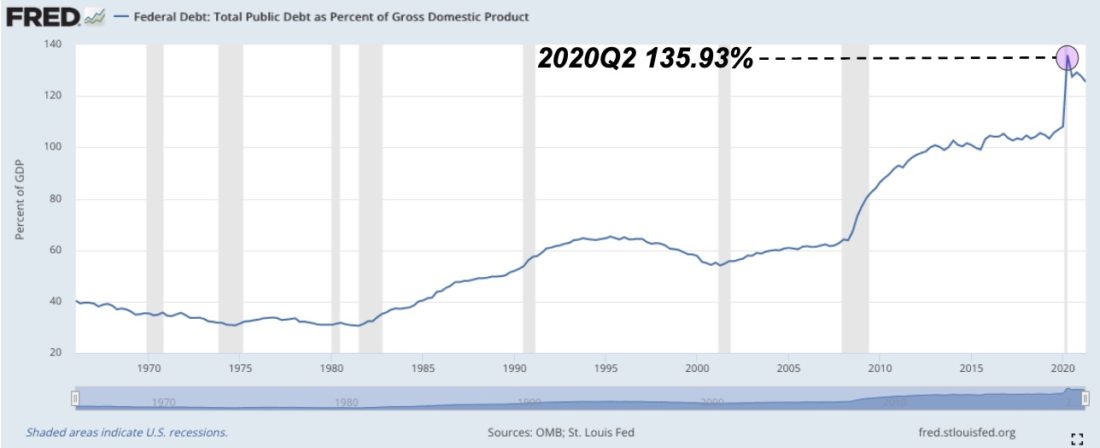
US government debt as a percentage of GDP.:FRED
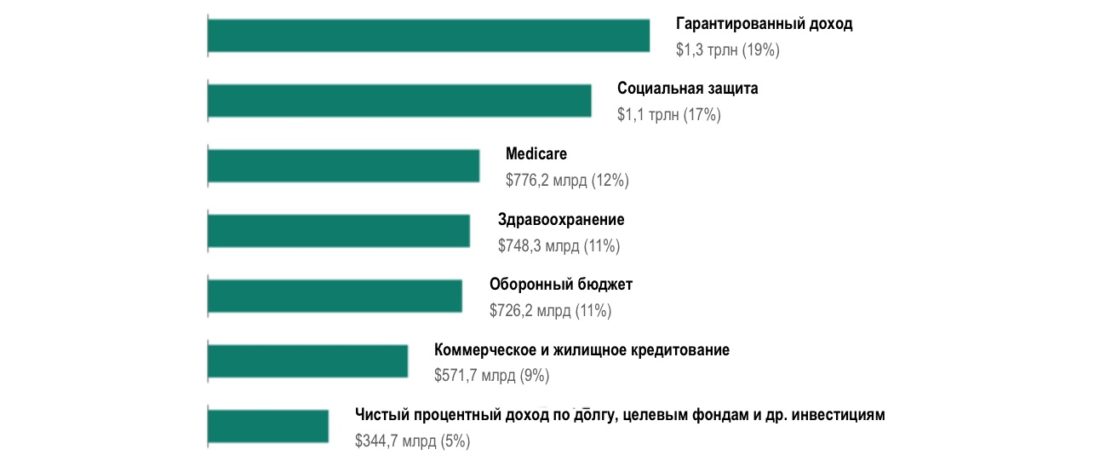
US federal spending by category.:usaspending.gov
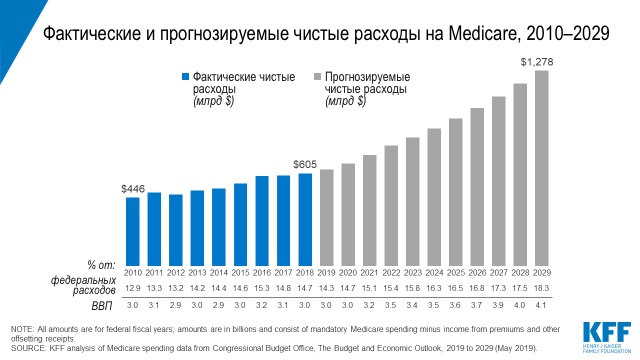
:kff.org
Now that we have a better understanding of projected government spending, let's go back to what the 130% government debt to GDP ratio means in the future.
In search of an answer, you can refer to examplesof the past. Based on Ray Dalio's concept of the long-term debt cycle, we can complement it with Hirschman Capital's historical research on government defaults.
“Research by Hirschman Capital shows that withIn 1800, out of 51 cases where government debt exceeded 130% of GDP, 50 governments defaulted. The only exception so far is Japan. "
This study shows that 98.07% of the timesovereign default is inevitable, mainly due to high inflation or hyperinflation. The study was published even before the United States reached 130% of its debt-to-GDP ratio.
:Hirschman Capital
Bonds with negative yield
More than 5% CPI inflation only amplifiespressure on the real yield of the bond market, where any investor buying 10-year Treasury bonds today is expected to lose 3.5% of its investment.
We are now at the stage where the Fedit will be necessary to constantly turn on and off inflation in order, on the one hand, to reduce debt and support the economy through inflation, and on the other, to serve the bond market. Ten-year Treasuries are no longer a viable investment option, but rather as a highly regulated collateral for additional leverage in a growing market.
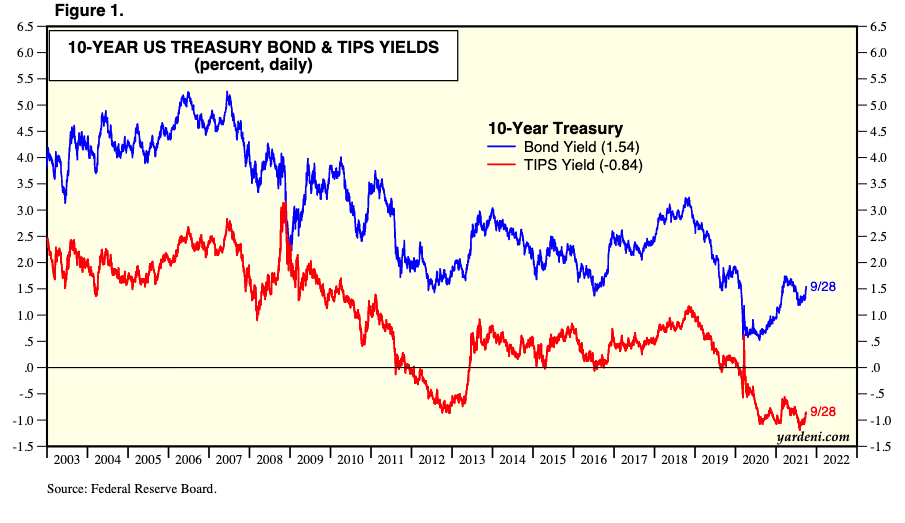
Yields on US 10-year bonds (blue) and TIPS (red curve) in %.:yardeni.com
As a result of declining interest rates and growthinflation, 85% of the US high yield bond market currently yields negative real yields, with yields on high yield corporate bonds less than 5%.
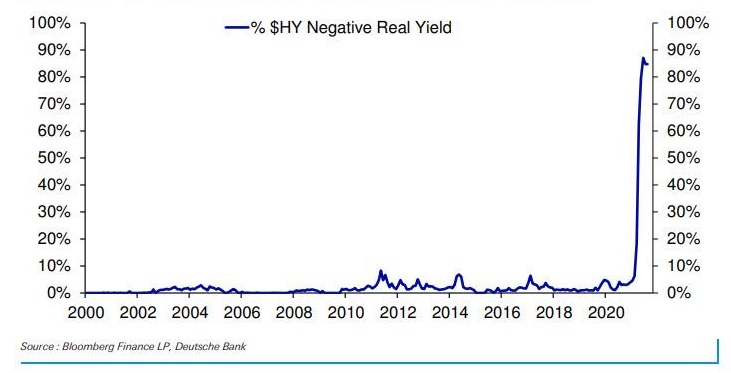
85% of the market for high-income government US bonds today have a yield below US CPI inflation.:Deutsche bank
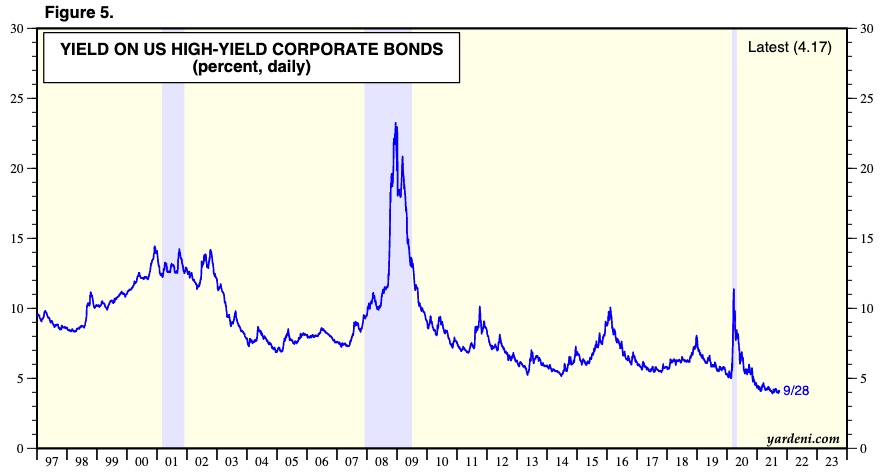
US High Yield Corporate Bond Yield and Spread (%).:yardeni.com
If inflation persists, the growing levelnegative yield bonds could catalyze a larger shift from fixed income assets to Bitcoin exposure. The total size of the entire global debt market is estimated to be approximately 128.3 trillion, meaning Bitcoin's market capitalization is 0.6% of all bond investments. Even a relatively small reallocation of capital will have a major impact on the size of the Bitcoin market.
Last month you could already seesignificant movement from debt investors with $7 billion chasing Coinbase's $1.5 billion bond issuance, indicating increased mainstream demand for Bitcoin exposure.
Market value of US Treasury debtis $23 trillion. The Federal Reserve owns nearly 24% of that debt, with $5.41 trillion of U.S. Treasury securities on its balance sheet. As of Q2 2021, federal debt held by the Fed as a percentage of GDP was 24.82%, down from 3.22% at the 2008 lows. The bond market is not what it used to be.
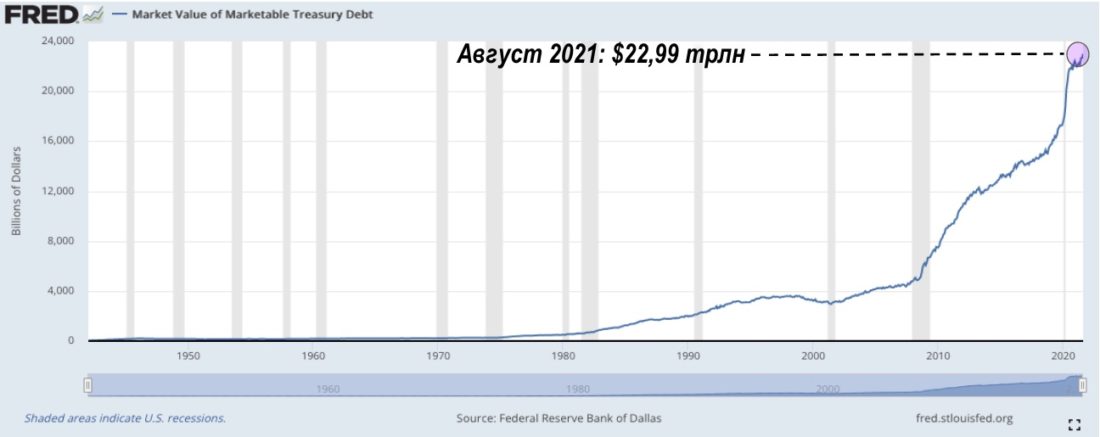
Marketable US Treasury debt.:FRED
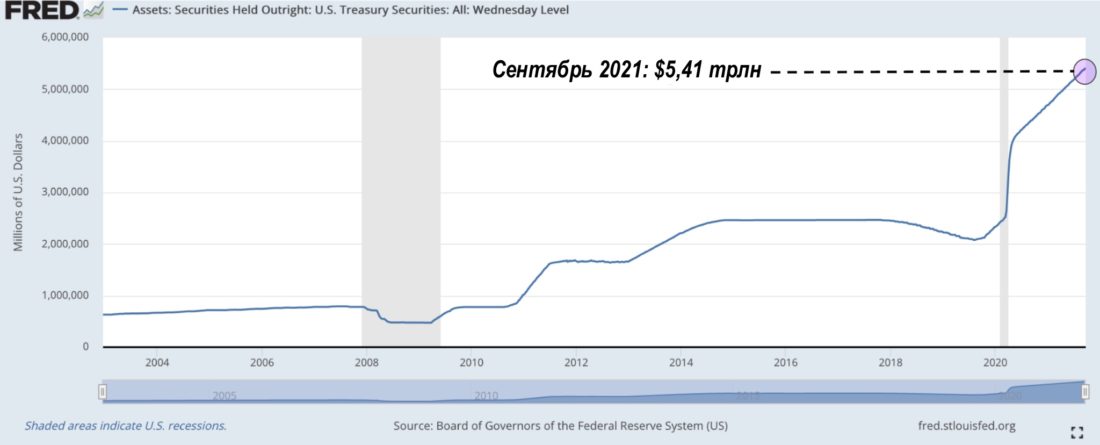
Treasuries are on the balance sheet of the Federal Reserve.:FRED
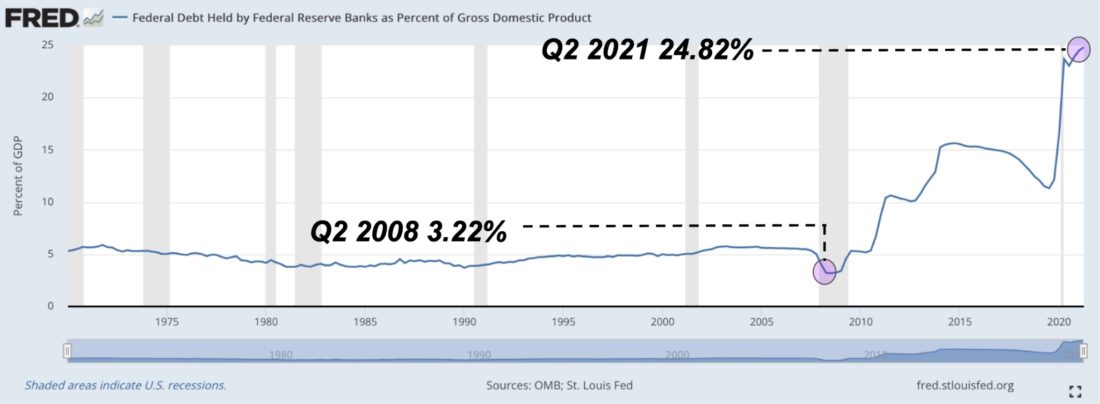
Federal debt to GDP ratio.:FRED
The perception of traditional bonds continueschange, the longer the negative real profitability on them persists, the stronger. More and more large investors are publicly speaking out about the advantage of placing a smaller share of their investment portfolio in bitcoin versus placing a larger share in bonds, but the real capital rotation has not even begun yet.
And many cannot do this untilBitcoin will not reach a more meaningful market cap like the $ 10.7 trillion gold cap. However, the process of achieving it can be accelerated by a longer period of growing inflation, leading to a decrease in real profitability. After all, there is a global game of maintaining or increasing purchasing power, and yields speak for themselves: Since the COVID pandemic began, Long-Term Treasuries (TLTs) are down 1%, while Bitcoin is up more than 677%.
Looking at the on-chain supply dynamics of Bitcoin,derivatives market trends and growing uncertainty in the inflationary macroeconomic environment, we remain significantly optimistic about the adoption of the world's only absolute scarce monetary asset and expect record highs to be broken as early as the fourth quarter of this year.
BitNews disclaim responsibility forany investment advice that this article may contain. All the opinions expressed express exclusively the personal opinions of the author and respondents. Any actions related to investments and trading on crypto markets involve the risk of losing the invested funds. Based on the data provided, you make investment decisions in a balanced, responsible manner and at your own risk.
</p>
Read this:
 Big September Bitcoin Market Review - bigger, longer & uncut
 Bitcoin Triumph !!! or Re: Bitcoin is losing ground in the digital currency market
 The expansion of contango in the bitcoin market creates an excellent environment for cash-and-carry arbitrage
 How to survive in the bitcoin bear market. Comprehensive guide
CEX.IO company blog | Bitcoin is losing ground in the digital currency market
How to survive in the bitcoin bear market. Comprehensive guide
CEX.IO company blog | Bitcoin is losing ground in the digital currency market
 Bitcoin Cheat Codes