This week, regular contributors to the Technical Roundup are discussing the relative weakness in BTC/USD, still"glued" to the $19,000 mark, and ETH/USD, which has not yet recovered the previous cycle's high in the $1400 area.The review concludes with an update of the analysis on the S&P 500, which fluctuates in the range between weekly support and monthly resistance.
Today's review turned out to be somewhat shorter than usual, but the markets practically did not budge.
BTC/USD: Lag or Sign of Weakness?
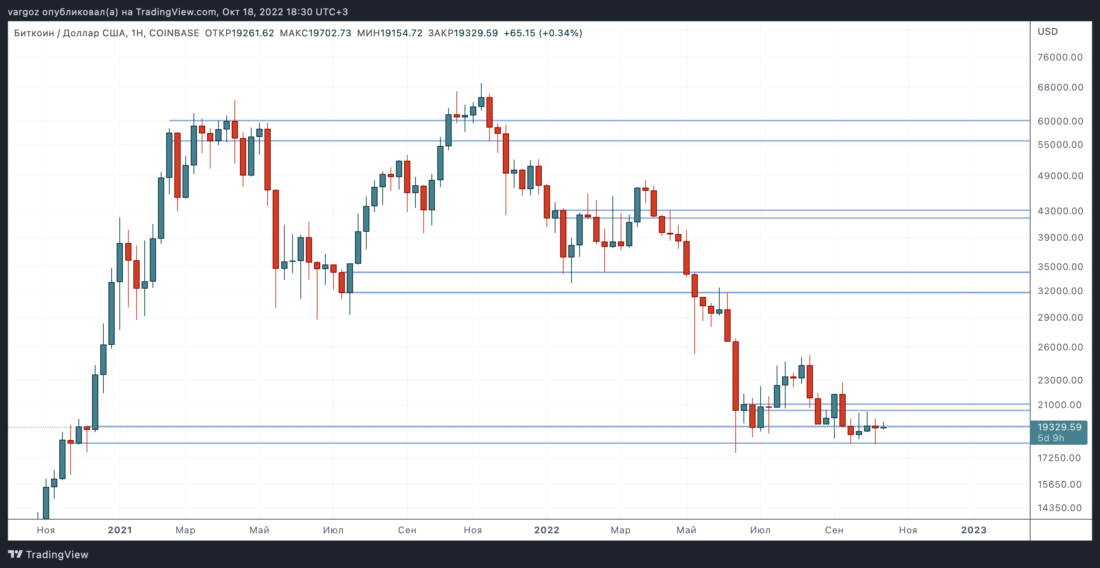
Bitcoin/dollar continues to have small and uninformative fluctuations in the $20 thousand area.
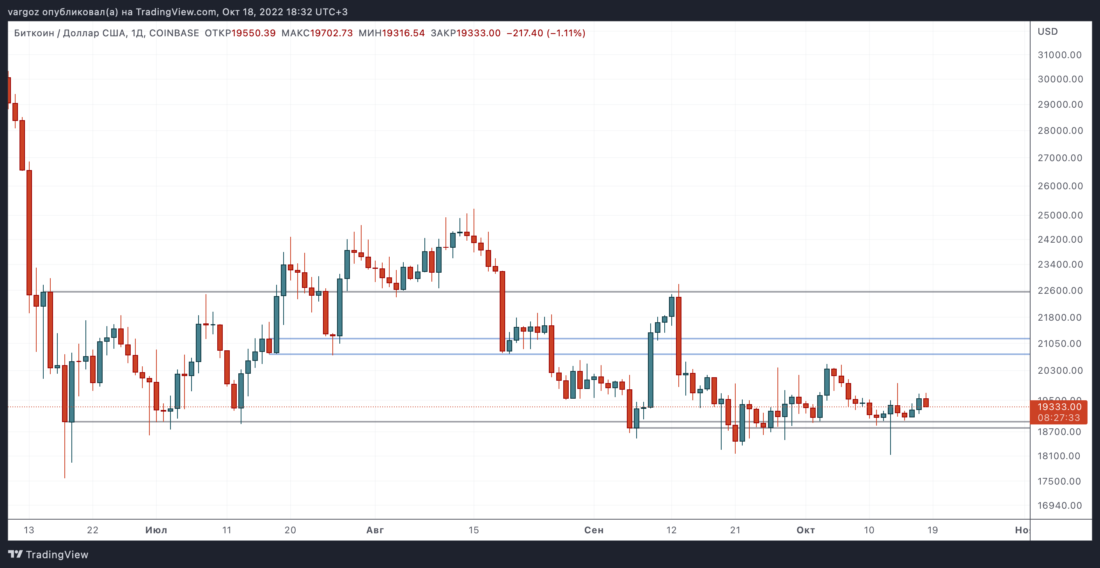
The daily range low at $19K is still support, but a breakout of its upper limit or a higher high is not yet in sight.
As we wrote before, an attractive purchase inthis area could either fail to break down $19k with a quick recovery there, or make a bigger high and break above $21k. At the moment there is neither one nor the other.
Daily range still serves as support(although the bounces from it are getting weaker), while $20k, the previous cycle’s peak, continues to act as intraweek resistance.
Another unpleasant thing for the «bulls» detailis that bitcoin/dollar is noticeably lagging behind even large risk indices like the S&P500, which is disappointing. Historically, the argument for cryptocurrency is that if you're going to buy risk assets, you might as well buy cryptocurrency, because when risk assets in general go up, it usually goes up more than the rest.
But in the latest rebound at the time of writing wewe see the opposite: the S&P500 rebounded by 2%, and Bitcoin by only 0.5%. This could be a simple lag, but we believe this is a sign of weak demand at current levels.
However, in any case and no matter howIf this relative weakness resolves, the market in this narrow daily range is of no interest. A breakout of this range will be a signal, a failed breakout pattern too, and a «haircut» between ~$19k and $20k is just noise.
Ethereum stuck at $1200-1400
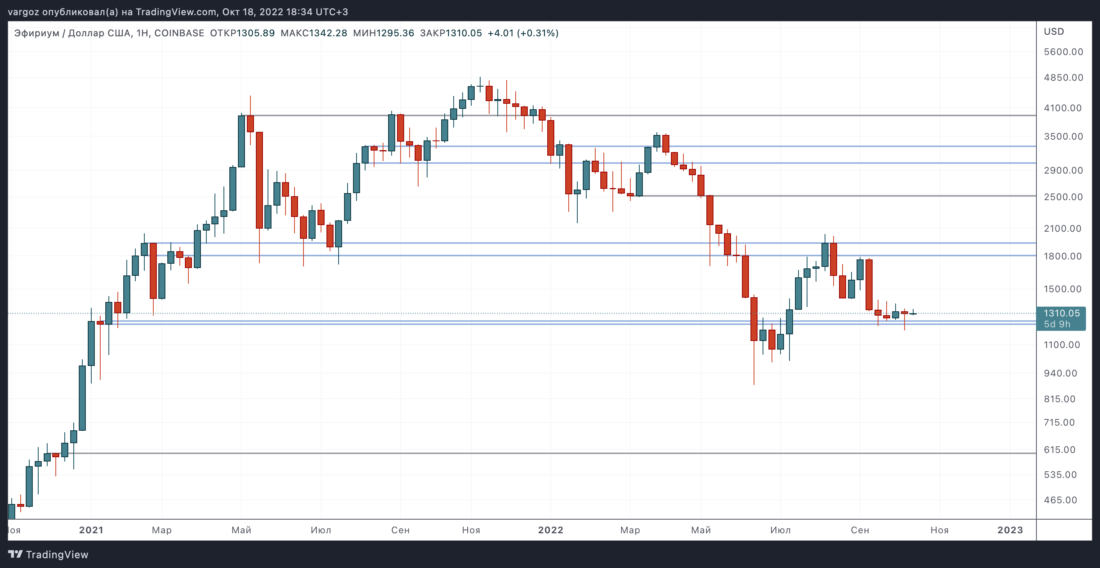
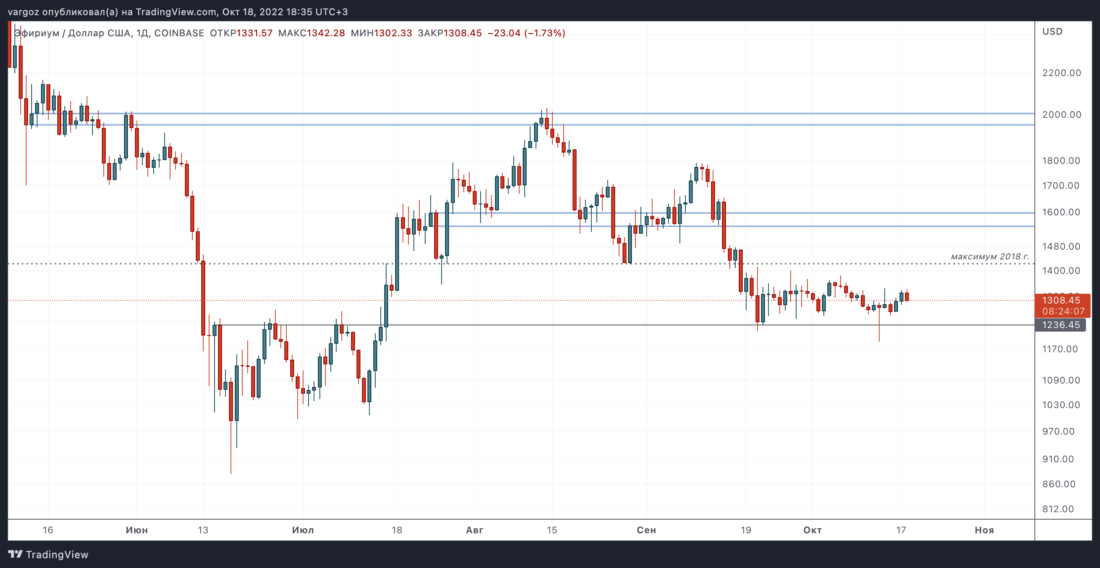
Ethereum/USD also remains in a narrow range.
There are two next levels that matter.$1400 is the previous cycle high and very clear resistance on the higher timeframe. $1200 is the high of the previous range, which is currently the support. The market is sandwiched between these two levels.
A move above $1,400 would be a strong case for a higher low, coupled with a retracement above the previous cycle peak. In this case, a move to $1,800 is highly likely.
A move below $1200 would mean a return to the old range and would be a clear bearish factor. In this case, we can expect a decline to the lower boundary of the previous range at $1,000.
Our logic here is similar to BTC/USD: a breakout will be a signal, a failed breakout too, but ~$1300 is a noisy and untradeable area.
The market fluctuates between the twomeaningful levels, and any trade here will by definition be a bet in the middle. And as our regular readers know, when the market is in a range, we prefer to put forward our trading theses at the borders of the range, rather than in the middle.
Like you, we are waiting for some volatility so that the market can somehow trade really significant levels. We hope that soon.
But our instincts tell us to be cautious as long as the market continues to view the levels of the previous cycle highs in BTC and ETH as local resistance rather than macro support.
S&P500 tests resistance again
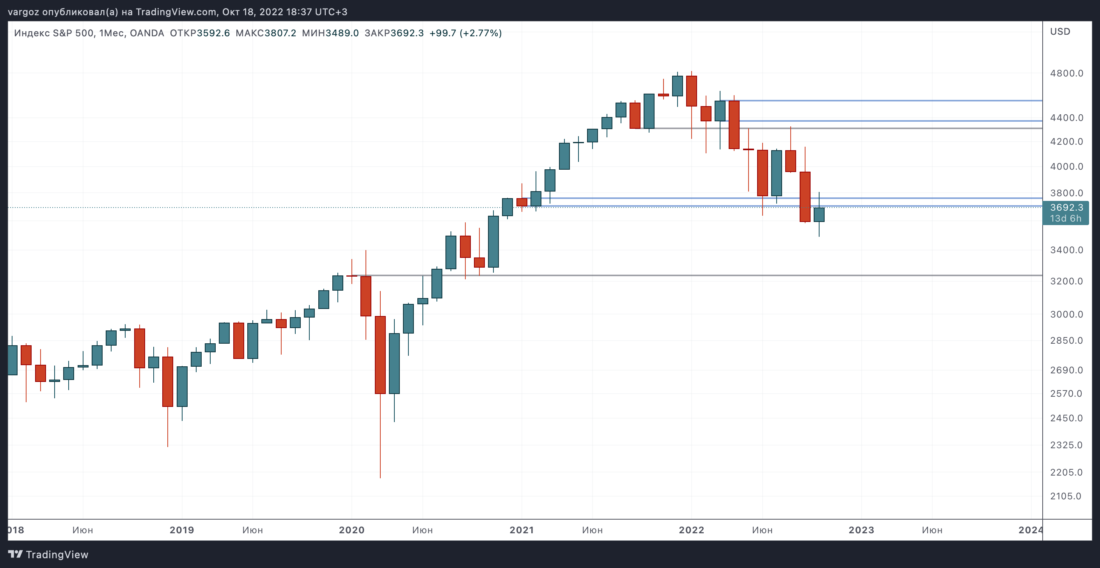
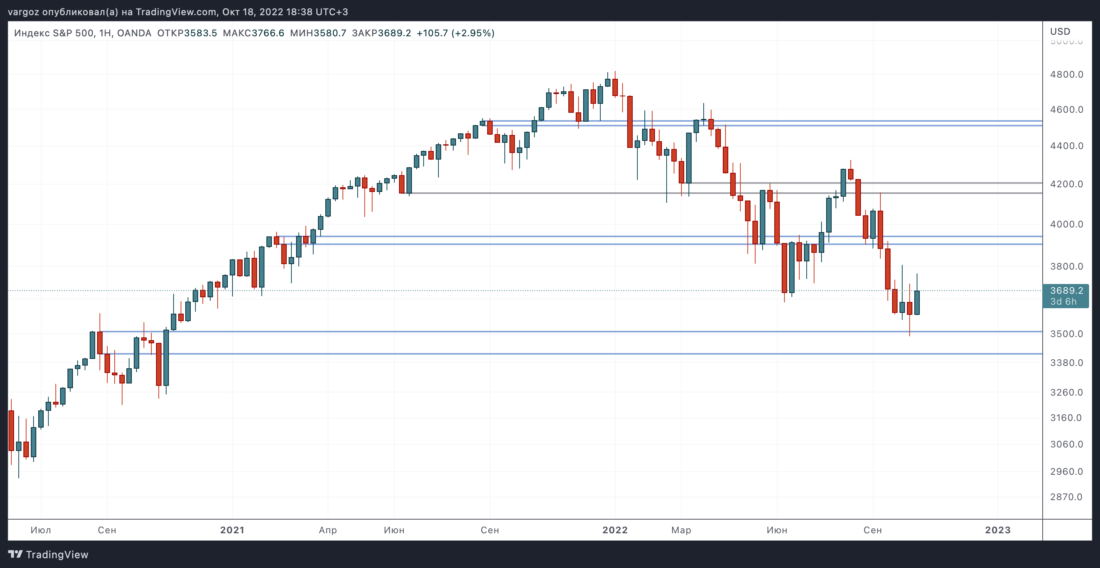
The S&P500 index returned to resistance.
After posting a higher than expectedUS consumer price index, the market went down, but found support at the monthly and weekly level we mentioned in previous reviews at $3,500. A rebound from it returned the market to monthly resistance of $3,710–3,760. In our opinion, «simple» part of the rebound has already been played out, that is, the market has risen from support to resistance.
As before, the minimum condition for bullish growth in our understanding will be an unsuccessful breakout pattern, in which the market will recover from the current resistance of $3710-3760.
In the current trend, all broken on the way downhigh timeframe supports were neatly confirmed as resistance levels. Violation of this sequence would be a signal worth paying attention to.
Another moderately optimistic scenario couldconsist in the formation by the market of a new range between the support of $3,500 and the resistance of $3,710–3,760. To state this, more weeks and candles on the chart are needed.
As you can see, all markets are essentially squeezed into narrow ranges that are not very informative in themselves: Bitcoin between $19 thousand and $20 thousand, Ethereum between $1200 and $1400, S&P500 between $3500 and $3700.
Tight ranges + shrinking volatility + latency/relative weakness of the crypto market = not particularly interesting conditions.
If you haven't lost much on these swings in recent weeks, consider this a win.
BitNews disclaim responsibility for anyinvestment recommendations that may be contained in this article. All the opinions expressed express exclusively the personal opinions of the author and the respondents. Any actions related to investments and trading on crypto markets involve the risk of losing the invested funds. Based on the data provided, you make investment decisions in a balanced, responsible manner and at your own risk.
</p>
Read this:
 With resistance, but with what prospects! — Technical review dated October 5, 2022
 Local resistance instead of long-term support - Technical update October 11, 2022
 Relative strength or just lag? — Technical review dated September 28, 2022
 Record Highs Reached - Tech Review Oct 27, 2021
 Resistance Breakout in BTC and ETH – White Paper March 30, 2022
 On Bitcoin in the $30K Region and the Unprecedented Buying Opportunity - Technical Brief May 17, 2022