How to understand what happened on Tuesday? And will this event have wider consequences? AnalystWillClementeanalyzes the current situation in the Bitcoin market, using on-chain metrics to separate the signal from the noise.
Dear readers, I hope you have a good week.For Bitcoin, it was another wild week, including the largest crypto market deleveraging since May 19. The strong downward move was driven by cascading liquidations of highly leveraged positions.
On-chain metrics are mainly used fortracking a broader market structure, at the same time, on shorter time intervals, derivatives can lead to significant price fluctuations. With this in mind, I want to say that in my opinion the fundamental investment trends for bitcoin have only intensified this week, and from that point of view I see no cause for concern.
However, starting with this release, I willinclude some high-level data on the bitcoin derivatives market in your reviews to try not to lose sight of such potential high risk areas.
Key points:
- Significant market deleveraging, liquidation of longs by $1.23 billion, reduction of open interest on perpetual futures by ~$4.4 billion.
- The sales were almost exclusively young coins, and the long-term owners did not seem to be much affected by this movement (in fact, their stocks even increased).
- Whales bought an additional ₿44,393 ($2 billion) this week, including a surge in buying during Tuesday's cascading liquidations.
- The exchange supply of BTC decreased by another ₿25,733 (~$1.18 billion) this week.
- The value of the profitability indicator of the spent exits, aSOPR, was reset and then returned to the profit zone. We've actually been expecting a similar reboot in aSOPR in recent weeks.
- Hash power continues to flow back into the network,the profitability of mining in BTC is decreasing, but in dollar terms it remains virtually unchanged. This week, miners sold a total of another ₿467 (~$21.2 million).
What happened on Tuesday?
On Tuesday 7 September we witnessedthe largest cascade liquidation of longs since May 19. What exactly happened? Before the market fell, open interest (the amount of open positions) in bitcoin futures increased significantly, accompanied by a surge in the calculated leverage ratio recorded on Monday. The funding rate for perpetual swaps was also positive at that time, albeit far from the spring levels. These factors in the derivatives market created favorable conditions for a drop in the leverage level, although I must admit that I certainly did not foresee such a scale of liquidations.
A piece of data that I did not pay attention toand which may be of use to all of us in the future is FTX spot margin lending rates. This factor was pointed out to me by Willy Woo when we discussed the Tuesday sale with him, and I intend to monitor this indicator in the future.
Before the sale on exchange walletsthere was some influx of coins, however, not so significant as to cause alarm. However, due to the relatively high leverage in open positions (read: market fragility), this could be a catalyst for a sell-off with cascading liquidations.
I have also heard that some layresponsible for the sell-off - at least in part - to some major OTC broker, but I don't see that in the data I use (Glassnode is tracked by only 6 major OTC brokers).
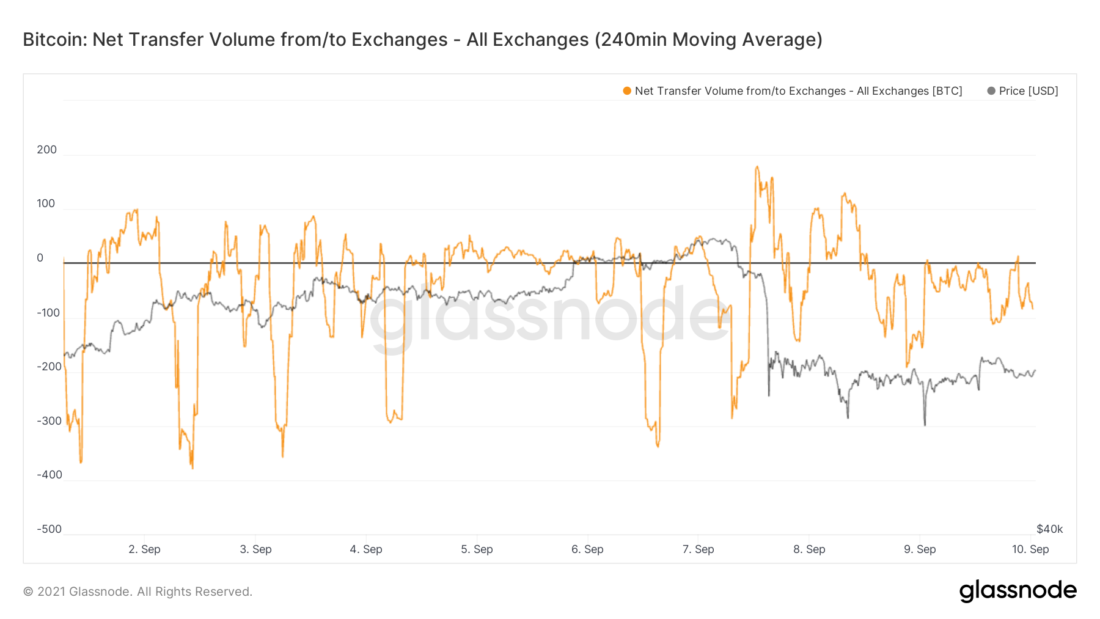
Net BTC transfer volume on exchange addresses (all exchanges, 24h MA)
Forced liquidation by placementA market order for a position of one trader triggered the stop-loss of the next trader, and so longs in the amount of $ 1.23 billion were liquidated along the chain, ~ $ 622 million of which fell on ByBit.
In case you are wondering why this figure is inThe $ 1.23 billion does not line up with the chart below, the liquidations presented in the Glassnode data (chart below) only cover Binance, BitMEX and OKEx, so I had to get additional data from an external provider to get the full picture.
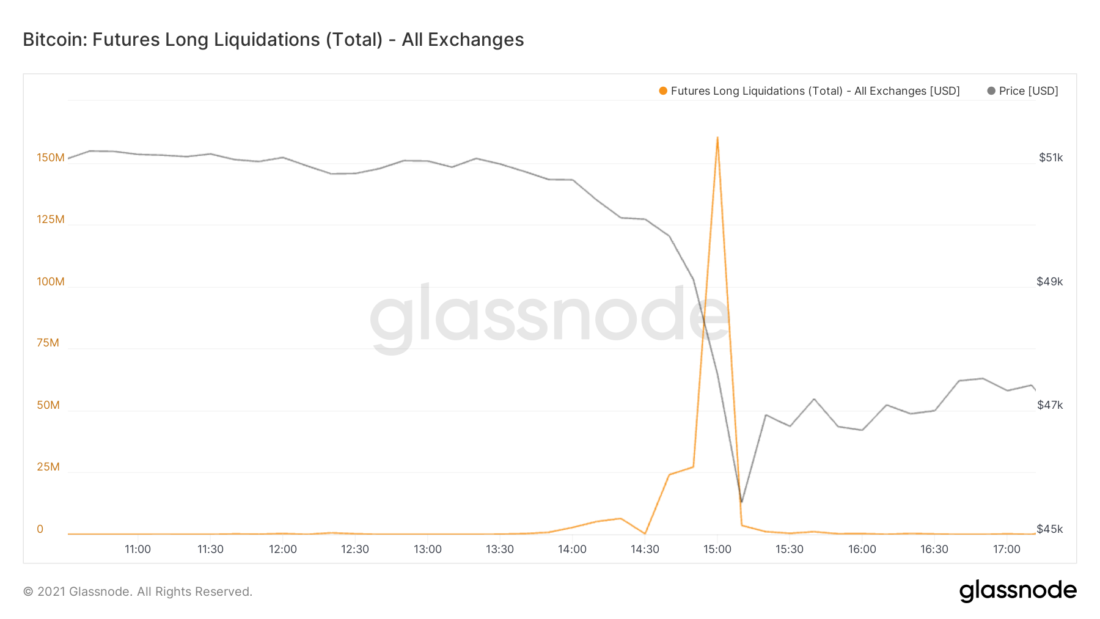
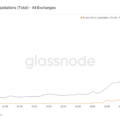
Long liquidation volume in BTC futures (total, all exchanges)
In total, open interest for perpetualfutures was cut by ~$4.4 billion. I'm inclined to see this as a healthy market clearing, especially considering investor behavior that day (we'll get to that soon).
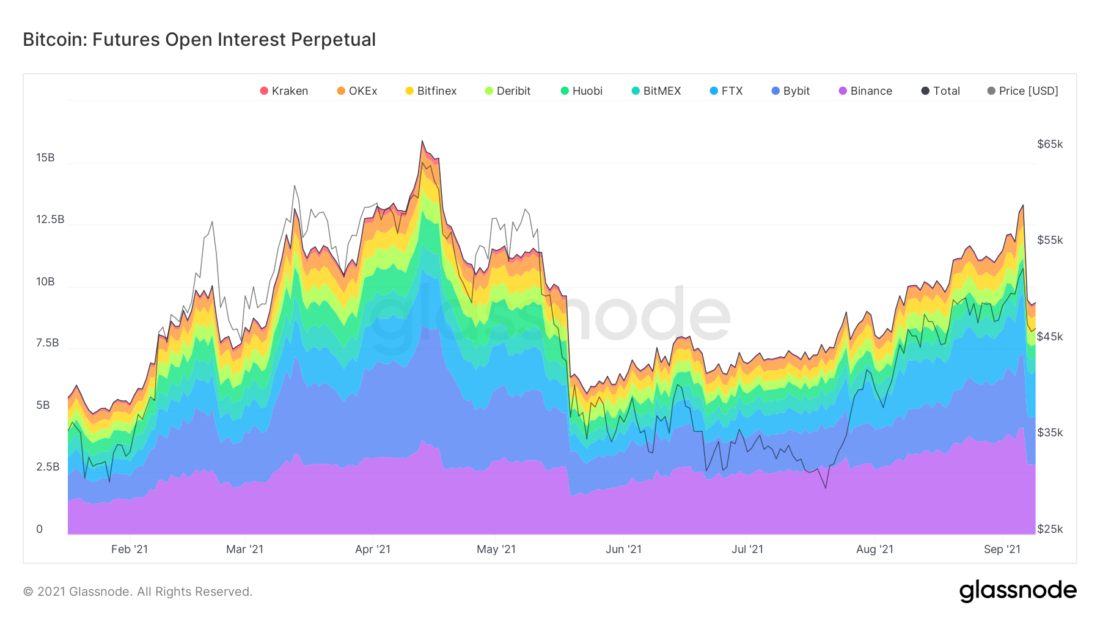
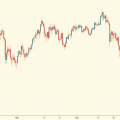
Bitcoin Perpetual Futures Open Interest
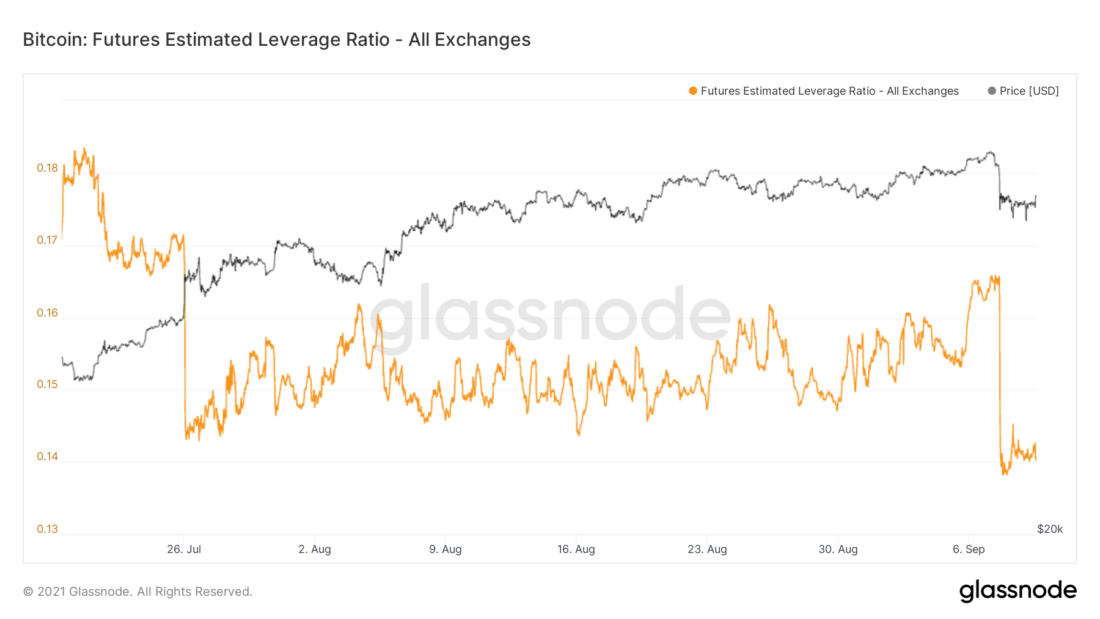
Bitcoin Futures Settlement Leverage Ratio (all exchanges)
The diagram below shows the dynamics of changefunding rates for perpetual futures. As I mentioned in previous reviews, they had been growing for quite a long time before the sale. On Tuesday, the market for the first time since the beginning of August moved into the area of negative financing for futures on the hourly chart.
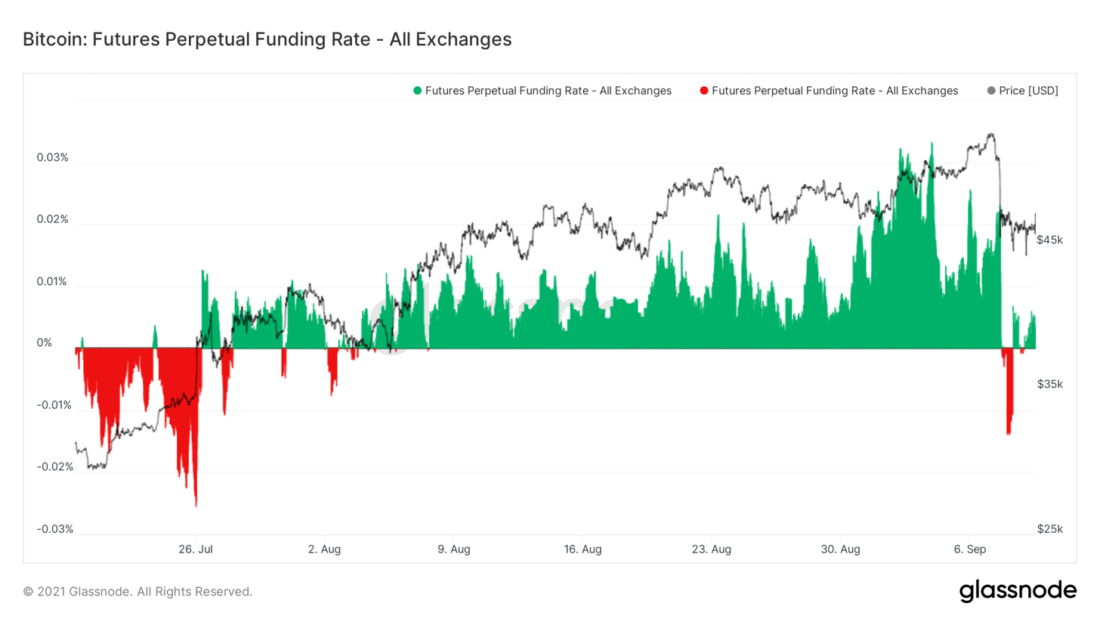
Bitcoin Perpetual Futures Funding Rate
In total, the market absorbed $262.5 millionnet realized loss, marking the first day of net loss since August 3. The market has since returned to profitability. To look at this from a different perspective, let's turn to our good old SOPR indicator.
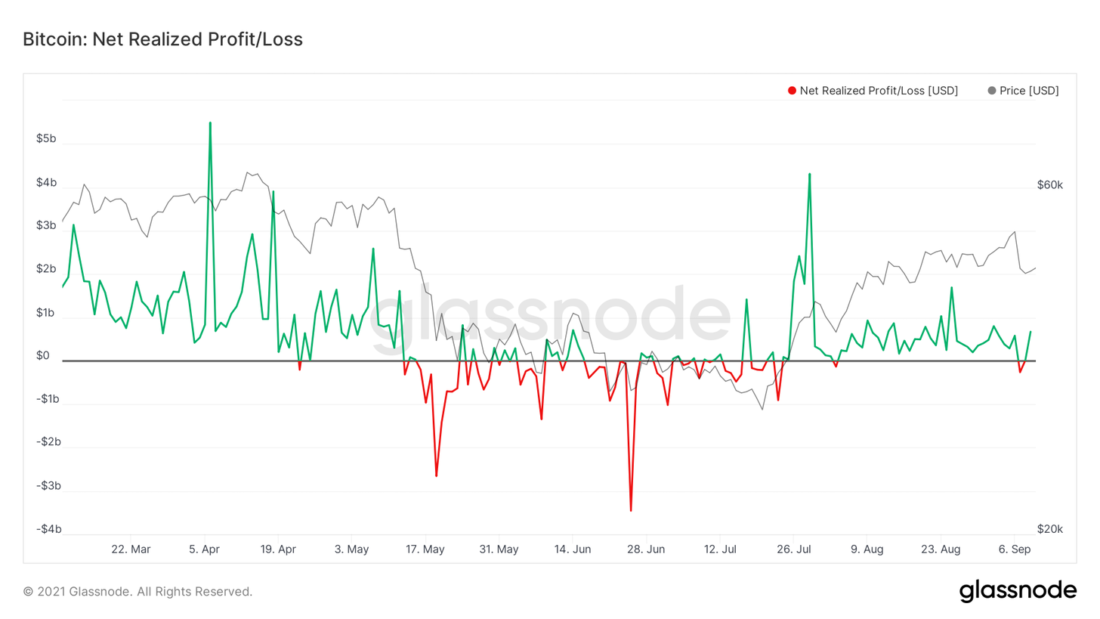
Pure implemented PnL
SOPRs are profit / loss measures takenwhen selling coins on a particular day. The top chart shows an adjusted version of the metric to exclude exits less than 1 hour old from the calculation (to filter out noise). Its value bounced back after a very small fall below 1 and is now back to profit.
It looks like a classic reset of thiscoefficient inside a bull market. Given that the Bitcoin market remains bullish at the macro level, these retests of the 1.0 threshold can be interpreted as signals of buying opportunities on the decline. Conversely, the SOPR can also be used in bear markets for sell signals at rally tops when the SOPR indicator is testing the 1.0 decline.
On the bottom left, you see the short-term SOPR,built by Glassnode using heuristic address clustering rules. For short-term holders, the drop below 1.0 was significantly more pronounced, indicating that these coins were selling at a loss. Meanwhile, the SOPR, filtered by long-term holders, bounced before even touching the 1.0 threshold.
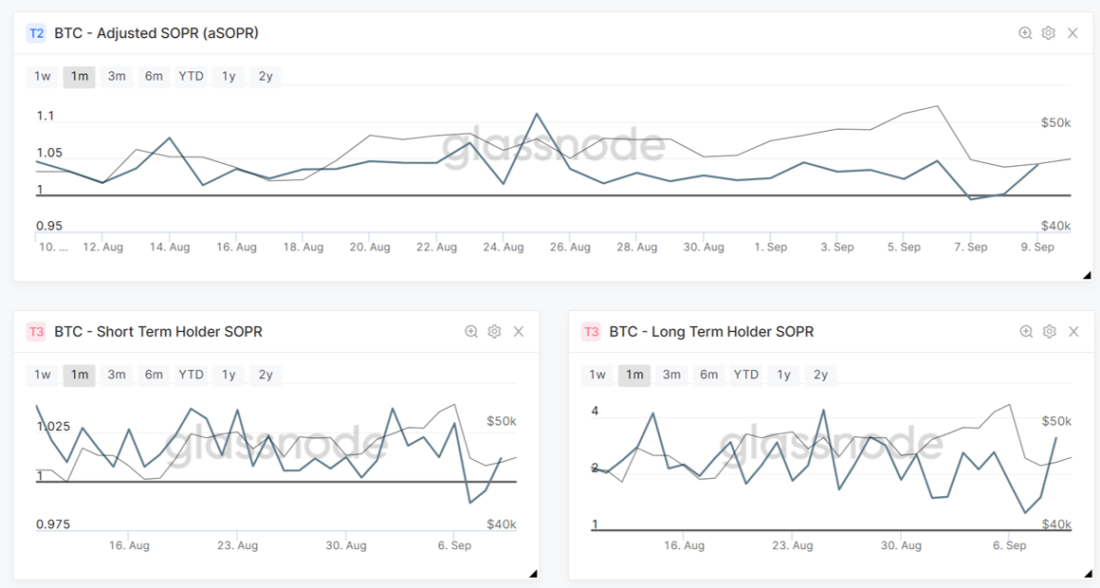
SOPR
Continuing this topic, to determine whetherwhich user group was responsible for most of the sales on a given day, we can use the Spent Volume Age Bands (SVAB) ratio. This metric shows what share (%) each age group of coins makes in the total sales volume. As in STH-SOPR, here we see a significant increase in spending on the part of younger cohorts.
That is, to summarize, the basis of TuesdayThe sales consisted of cascading liquidations combined with sales of relatively young coins. It is quite interesting to compare this with the accumulation by longer-term holders that has occurred this week and, in particular, on Tuesday. Let's get a look.
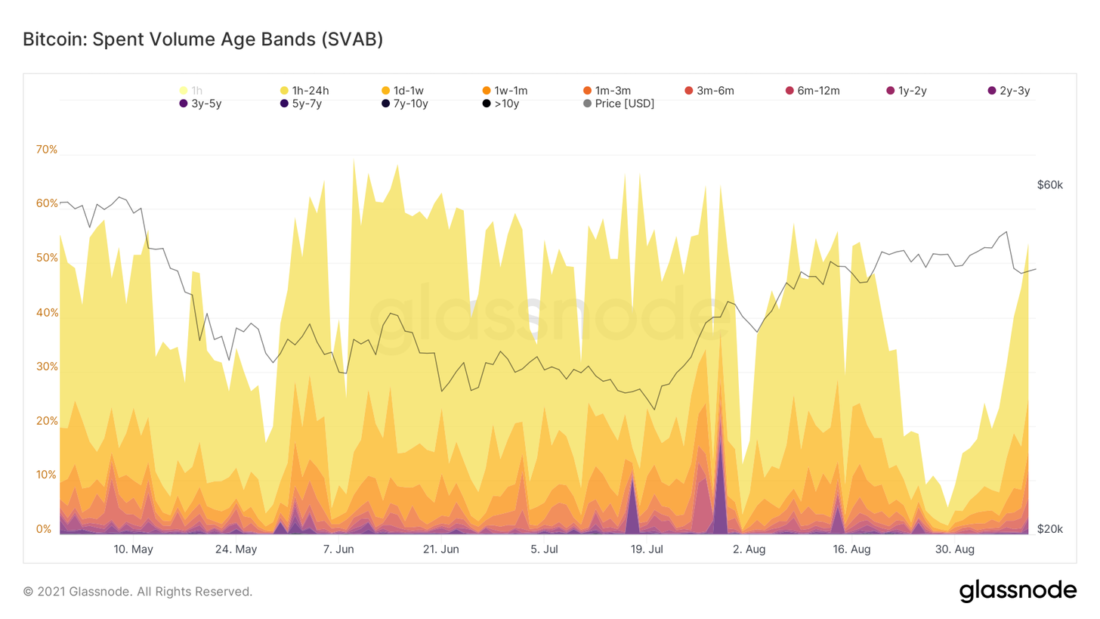
Spent Volume Age Bands (SVAB) for Bitcoin
How does this affect the structure of the market?
Will this week's events cancel any of thebroader trends that we tracked in these reviews? The answer is no. In fact, according to visible signs, the accumulation tendencies have only intensified. BTC exchange stocks fell another ₿25,733 ($ 1.18 billion) this week, reflecting the Supply Shock ratio for the exchange offer.
Also this week there was a surge in coin flow into "strong hands", which reflects the Supply Shock ratio for illiquid supply, including the growth of this indicator at the end of Tuesday.
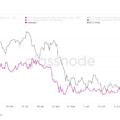
The ratio of highly liquid supply onThis week, there was also a big movement: coins flowed from highly liquid network entities to liquid ones (from, conditionally, speculators to short-term investors). I would like to see these coins move into the category of illiquid supply as a result.

Supply Shock Ratio for highly liquid (red line), illiquid (blue) and stock (purple) supply
In addition, based on the results of this week, it is again possibleto note an increase in accumulations by whales. The following metric takes into account network entities (i.e. address clusters) with a balance of more than ₿1000, from which large well-known actors such as Grayscale, Purpose ETF, QBTC and, most importantly, exchanges are filtered out. In total, whales added ₿44,393 (~$2 billion) to their savings this week.

The volume of bitcoins held by whales (balance >1000 BTC). All clusters of addresses of known Glassnode exchanges, funds, over-the-counter brokers, etc. are filtered.
These short-term movements can inspireworrying, but it's important to remember that the broader picture looks extremely bullish. Next in line is the Supply Shock ratio for long-term holders, which tracks the ratio of coins held by long-term and short-term holders.
Now this indicator is approaching the zonehistorically caused a supply shock to the market, with long-term investors holding a significant portion of the total BTC supply. If the value of the coefficient continues to change along the same trajectory, then in the next few months it will reach the upper limit of the indicated range of the supply shock.
In nominal terms, the volume of supply in BTCcontinues to break records, rising ₿83,062 ($ 3.82 billion) this week. It's not just long-term holders who bought coins in the last week, but a significant portion of it is in the hands of short-term holders, many of whom mature and cross the 155-day threshold between short-term and long-term holders.
But, be that as it may, these coins remain locked; I talked about all the indicators of accumulation in more detail last week.
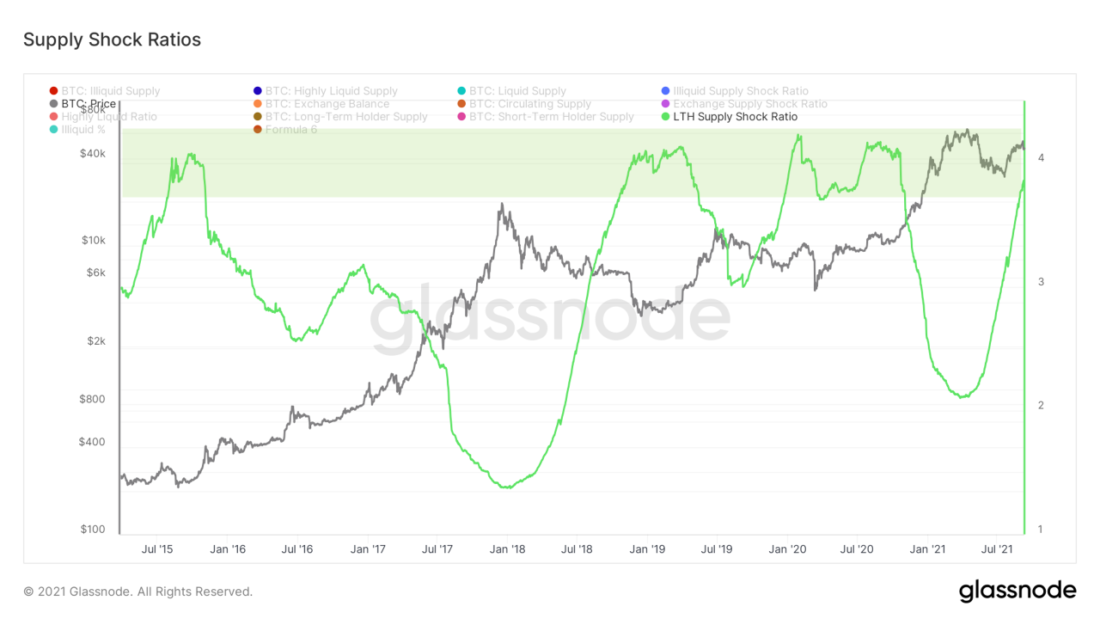
Supply Shock Ratio for Long Term Holders
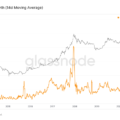
Finally, let's take a look at how they behaveminers. The hashpower continues to return to the network without showing any signs of slowing down. As the competition for the limited block reward increases, the profitability of mining in BTC per hash decreases. However, in dollar terms, miners' profits look significantly stronger thanks to the rise in BTC.
It can also be stated that minersstill predominantly sell their coins, but nothing significant happens in this regard. According to Glassnode, miners have net sales of 467 BTC this week.
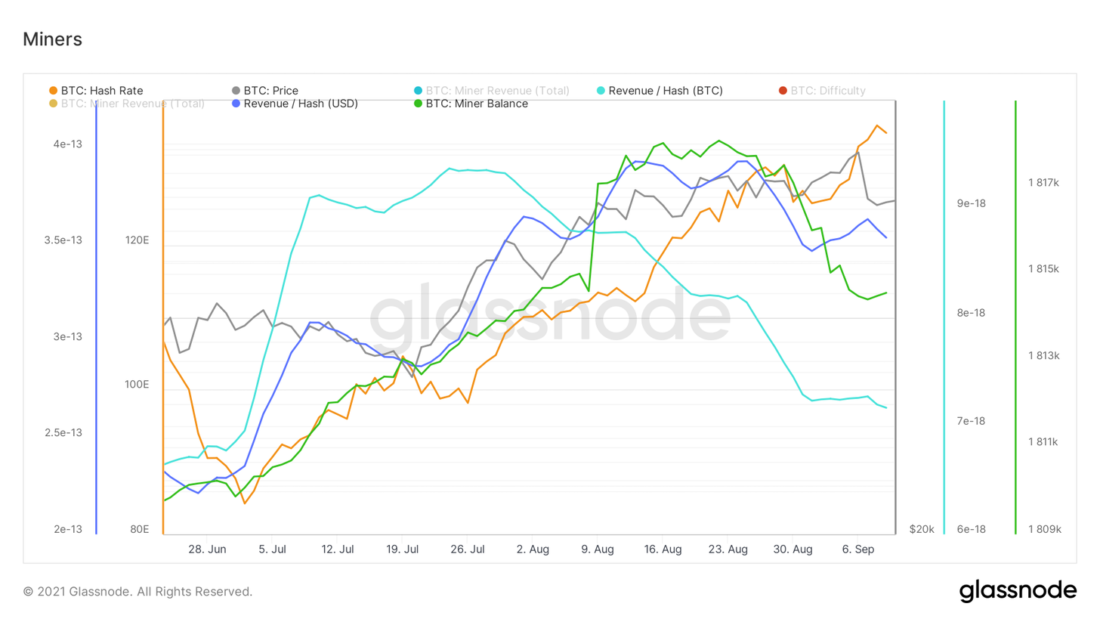
Miners metrics. Bitcoin hashrate - red line; profit / hash (USD) - blue; the aggregate balance of miners is green; profit / hash - blue
That's all for today. Great weekend to everyone.
BitNews disclaims responsibility forany investment recommendations that may be contained in this article. All opinions expressed express exclusively the personal opinions of the author and respondents. Any actions related to investment and trading in crypto markets involve the risk of losing invested funds. Based on the data provided, you make investment decisions carefully, responsibly and at your own risk.
�
</p>Read this:
 Supply liquidity is drying up, the main parameters of the market are normal - Onchain Pulse from August 21, 2021
 Accumulation, accumulation, accumulation ... - Onchain pulse from 04 September 2021
 Sentence Compression Continues - Onchain Pulse from July 31, 2021
 Onchain Pulse | 04 May 2021
 Light Surge from New Whales - Onchain Pulse from July 10, 2021
 Strong Savings and a Buy Signal in the Hash Ribbon - On-Chain Pulse from Aug 14, 2021