
Analysis of the cryptocurrency market by the dynamics of changes in the prices of individual coins does not allow you toEstimate inflow and outflowmoney to the market as a whole.
To assess the dynamics of the market, the Easytrading trading terminal has a built-in indicator developed by uschanges in the size of the market.
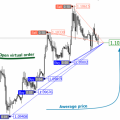
The horizontal line allows you to separate the positive dynamics from the negative ones.
Green indicates the value for the USDT market, white for BTC.
The market size change indicator allows you to visually assess the dynamics not by the total trading volume and price changes, but by a complex formula that includes these components.
It is known that a sharp change in the value of the main cryptocurrency, the trading volume of which is above 40% of thegeneral, entails changes in the price of other coins.
In order to take into account the contribution of each coin to the dynamics of changes in the entire market, our indicatortakes into account the percentage of price change and trading volume.
By gathering all the data into a single value, you can quickly and visually assess the inflow or outflow of money from the market.
Accordingly, the most favorable time to buy is at the moment of the beginning of the inflow of money into the market, and it is safer to sell when money begins to flow into the market.exit the market.
The current value of the indicator for the selected market is displayed in the upper left corner of the terminal.
Thus, using this indicator as a filter during trading according to the built-in strategy, the efficiency of inputs increased by 10% when testing on history.
On some pairs and timeframes up to 30%.to evaluate the effectiveness of a given filter in a particular trade.
Read this:
 Market Watch March 18, 2020
 Analysis of key indicators of the cryptocurrency market in 2020
 Market review of the main cryptocurrency pairs for the current week (from September 16, 2019 to September 22, 2019)
 Freebie VR Calculate Martingale Lite Average price indicator.
 Major changes in the regulation of bitcoin and other cryptocurrencies in 2019
 The results of the week 01/30/2020. Amendments to the Constitution. The dollar and oil