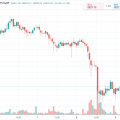
By the close of February, Bitcoin is showing signs of weakness.
Bitcoin experienced a corrective week withprice drop from $58 thousand to $44 thousand in a matter of days. This fall caused a reaction close to panic in the markets. The euphoria immediately evaporated.
For example, the Fear and Greed Index dropped to 56 points after spending a full month above 90, at the "extreme greed" level.
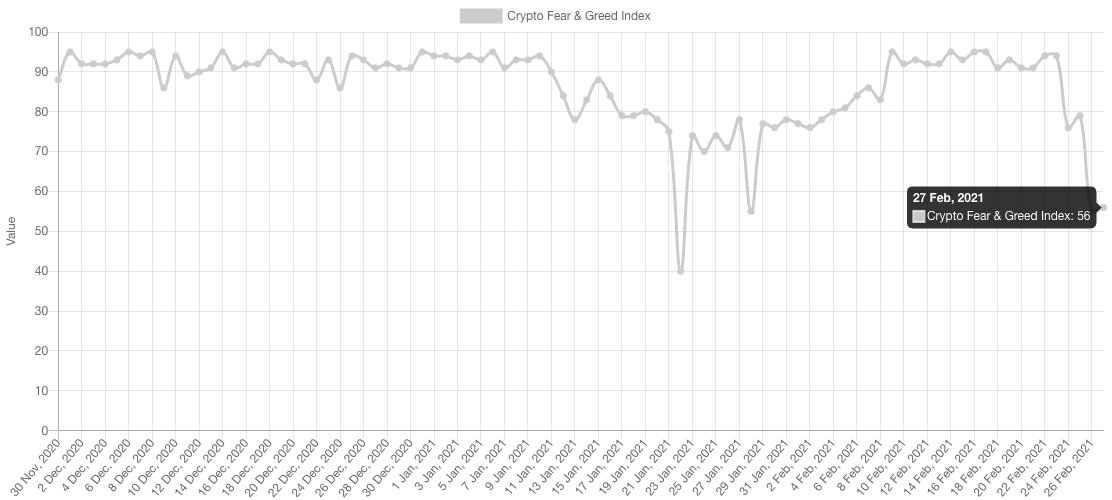
Cryptocurrency Fear and Greed Index. : Alternative.me
However, such a panic reaction is hardly possibleconsidered justified, since corrections often occur in bull markets and play the role of some kind of "reset" before the trend continues. This is an organic and healthy phenomenon and also provides investors with a good buying opportunity on a pullback.
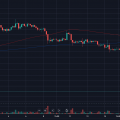
Failure to reach the $52K level signals trend weakness.
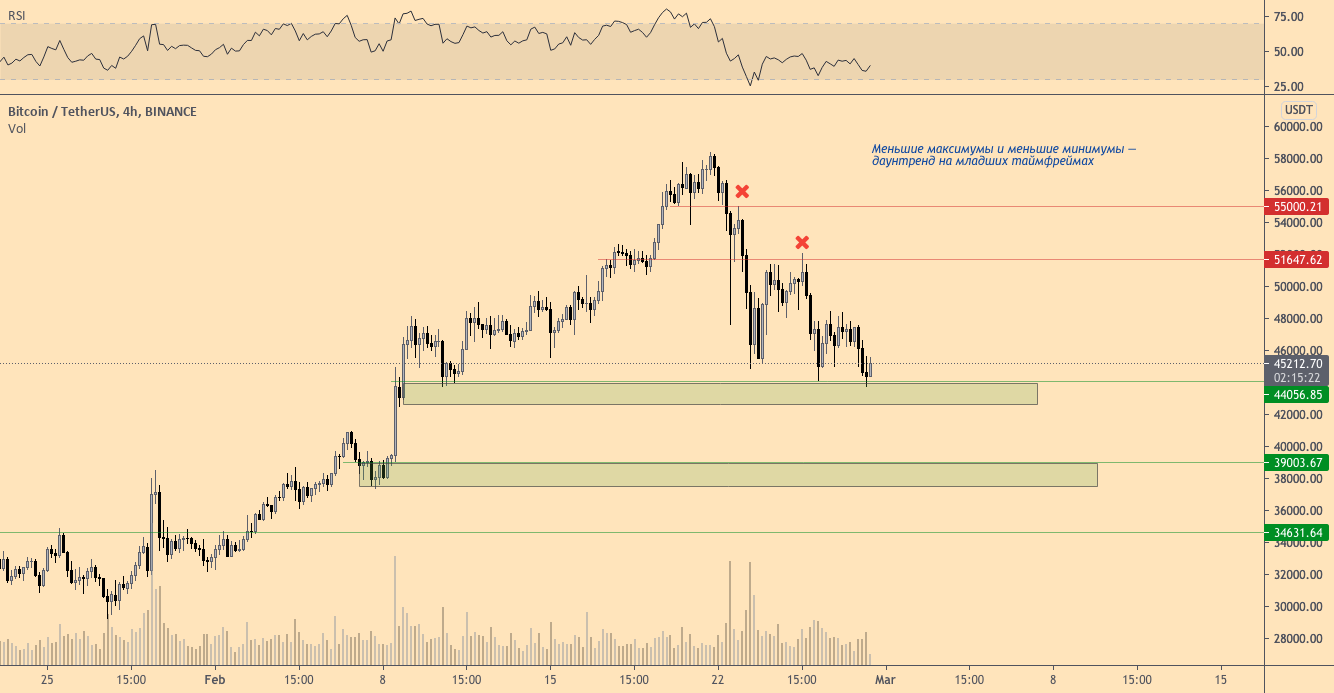
BTC/USDT, 4-hour chart. :TradingView
On the 4-hour chart there is a cleardowntrend from today's latest high of $58K. There is a possibility that this peak will become the maximum value for the coming months, in which the market may see a longer correction.
Be that as it may, today's price movementsfrom this peak of $58K signals weakness as every support level encountered so far breaks down and acts as resistance.
These support/resistance flips are marked onchart above (the first level was $55 thousand). After this, the price of Bitcoin suffered a significant drop into the support zone around $45 thousand. This support worked well, leading to a strong rebound to $52 thousand.
But unfortunately for the bulls, this level was not broken. Instead, the price of BTC pulled back from it, signaling to the market that the trend was weakening and further decline was likely.
Now this paints a clear picture of the important levels,whose price behavior is worth watching. Ideally, for the upward momentum to continue, the $42.5-44K support zone should be held. If it is broken, then we can expect further weakening to the level of $37-39 thousand.
If the $42.5-44k zone is held, then we can expect a move to new highs as soon as Bitcoin breaks through the $50-51k resistance.
The bullish structure is not broken yet
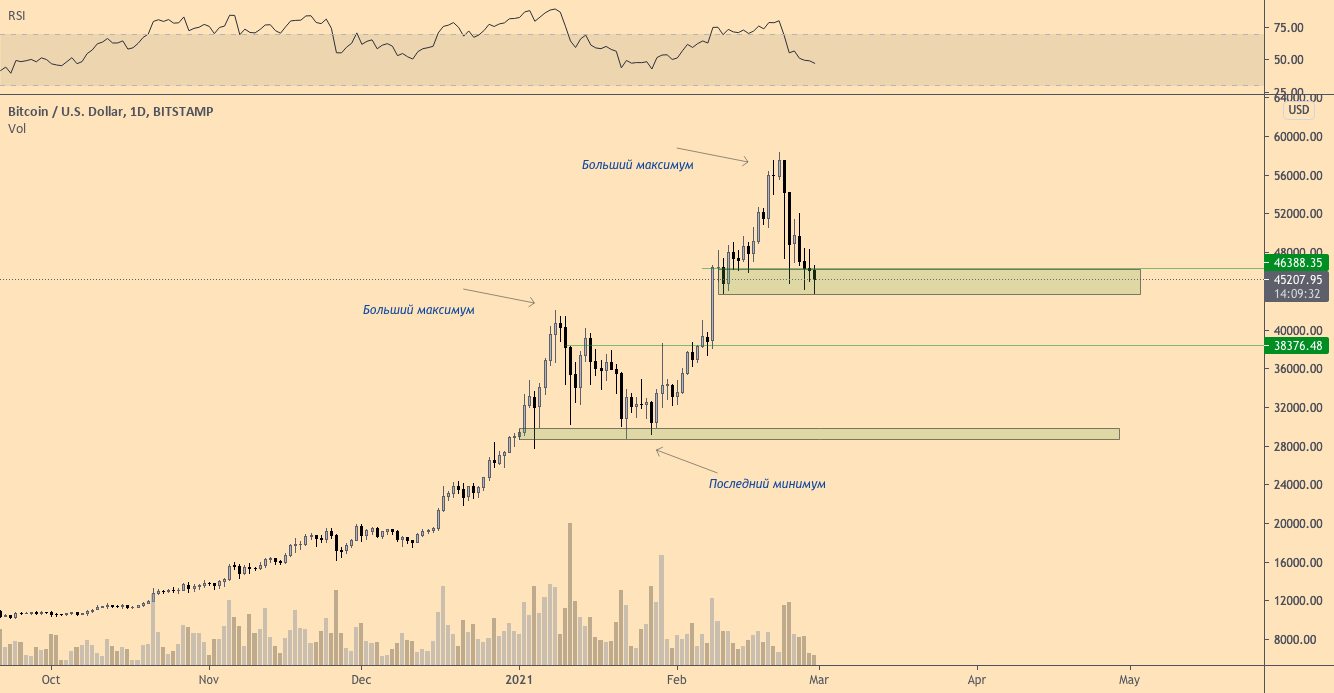
BTC/USD, 1-day chart. :TradingView
While lower timeframes indicate weakness in BTC / USD, higher timeframes suggest a healthy correction. As you can see in the chart above, the market structure is still very bullish.
The previous peak was formed at $42 thousand., after which new support was found in the $30K area. This last peak was easily broken, after which the BTC price accelerated to set a new high of $58K. Thus, in this type of bull market, a correction even to $37K can be classified both healthy and organic.
Simply put, as long as BTC remains above the January lows of $30k, the market can be classified as bullish from a TA perspective.
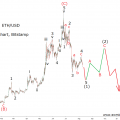
March often turns out to be a correctional month

XBT/USD, 1-week chart. :TradingView
History shows that March is not the most bullishmonth for the cryptocurrency market. In recent years, as a rule, there were corrections in March. Specifically, Bitcoin corrections of 15-60% took place in 2015, 2016, 2017, 2018 and 2020.
The last of these falls was provoked bythe COVID-19 pandemic and can be classified as a black swan. However, this does not disprove the general trend of corrections in March, and this year we may see another pullback this month.
Thus, corrections can last several weeks and often they are not limited to just one wave of sales. So the possibility of a decline to $35-40 thousand per BTC still remains relevant.
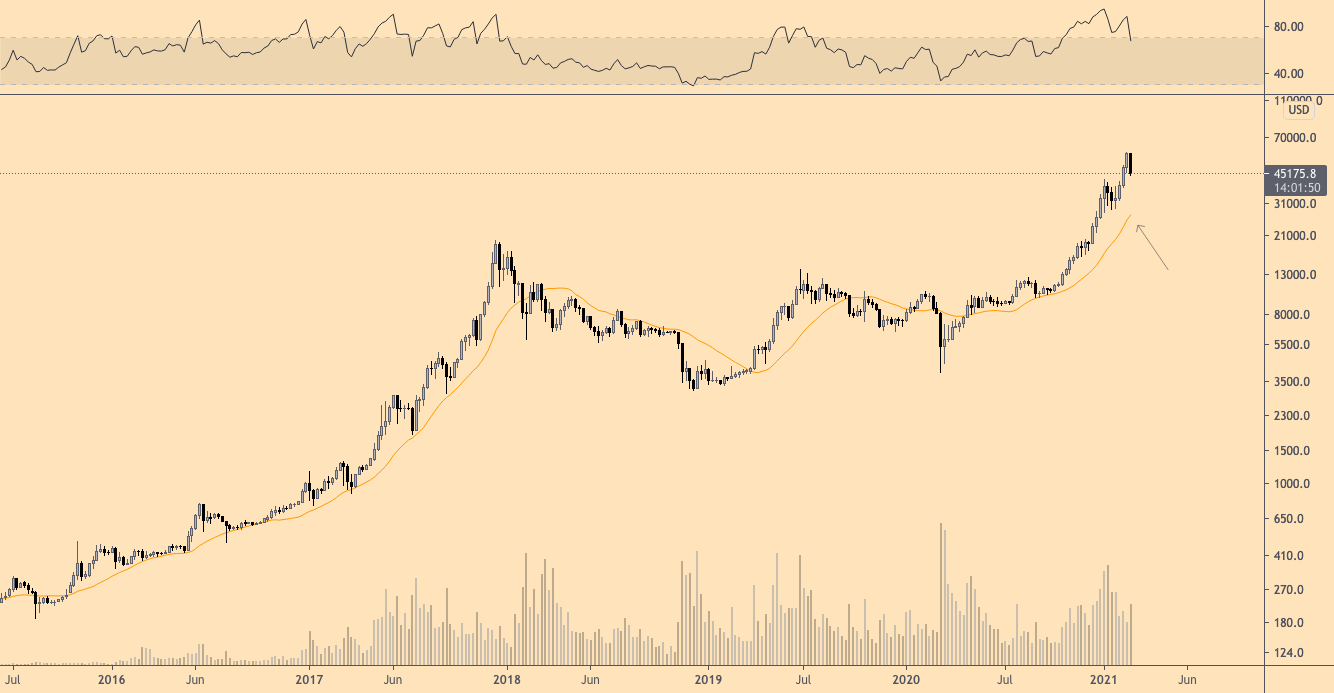
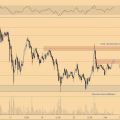
XBT/USD, 1-week chart. :TradingView
In this regard, the main indicator for whichworth paying attention to, in my opinion, is the 21-week MA. BTC corrections often tend to move towards this line as a pivotal point for a potential reversal. Therefore, we can expect that in the coming weeks this 21-week MA may work as a support if the correction continues.
The 21w MA currently sits at around $28K, although it should rise to $33-35K in the coming weeks.
The article does not contain investment recommendations,all the opinions expressed express exclusively the personal opinions of the author and the respondents. Any activity related to investing and trading in the markets carries risks. Make your own decisions responsibly and independently.
</p>
Read this:
 The trader spoke about the factors in favor of a further drop in the price of bitcoin
 Tradingview service overview: why is it needed and what are its features
 Bakkt set a new record amid falling Bitcoin
 Bears rule Ethereum while it is below $ 225
 How much can the price of BTC fall if it fails to gain a foothold above $35,000 in the near future?
 Trading volume on Bakkt has updated the maximum amid falling Bitcoin