Further research on the capabilities of the Bitcoin Days Destroyed metric.
For us here at Ikigai Asset Management, Bitcoin servesendless source of admiration for a whole host ofthe reasons, and not least due to a fixed schedule of emissions with a reduction in output by half every four years and its complete cessation in 2140. Since the price is ultimately formed by the balance of supply and demand, and the supply volume is known, if we can quantify demand, they should be able to formulate some expectations regarding future prices.
Unfortunately, the quantification of demand isnon-trivial task, and therefore forecasting demand is also fraught with errors. Many attempts have been made to this, but considerable confusion remains on this issue.
One way to more accurately determine demand is toseparate long-term investors from speculative traders through the age of the coins being moved. For clarity, imagine two participants in the Bitcoin network:
| Newbie | Veteran | |
| Coin Hold Age | Recently purchased | Held for years |
| Awareness | Poorly informed and confused | Well informed and confident |
| Result | Very speculative behavior, «weak hand» | Hodler, «strong hand» |
Beginner's actions are likely to be sporadic or unreasonable - like buying closer to the top and selling at price lows.
On the other hand, the veteran is probably familiar with the market cycles from his own experience and it will be better to calculate the time of purchase and sale in order to maximize the return on investment.
And although there are exceptions to each rule, we believe that the following general assumptions can be made:
| Newbie | Veteran | |
| Purchase | Greed / Random | Bullish mood |
| Sale | Fear / Random | Bear mood |
Now, having made this distinction, let's see what information can be hidden in plain sight, in the UTXO (unspent transaction outputs) set of Bitcoin.
HODL waves
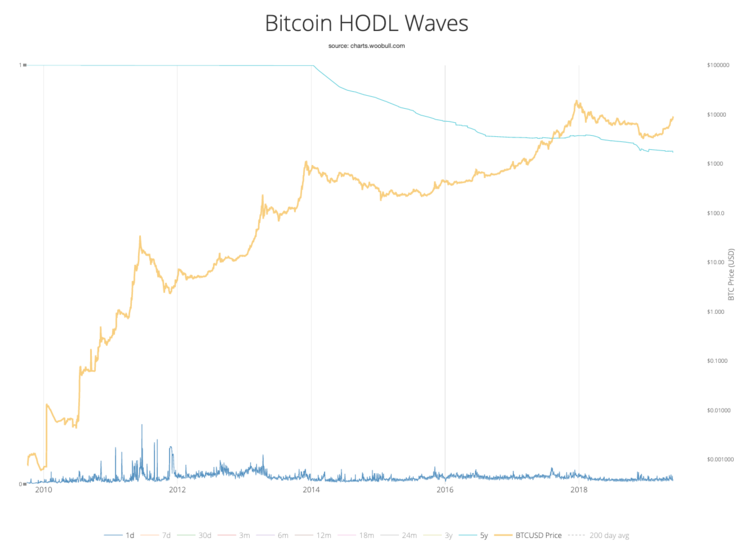
: woobull.com
The graph above shows what percentage of the totalUtxo numbers is at what age. Pay attention to the sharp growth (in this case, the chart is moving down) of the group with the age of 5 years (5y), which now accounts for more than 20% of all bitcoins in circulation (more than 30 billion today).
Compare this, for example, with an almost static sidethe dynamics of the seven-day segment. In essence, this suggests that the number of short-term speculative transactions remained relatively constant, while the number of long-term transactions is constantly increasing. We find this a deeply bullish signal.
What are bitcoin days?
Number of «bitcoin days» equalsthe number of coins multiplied by the number of days since their last movement in the blockchain. The idea is to divide the circulating coins into those controlled by market newcomers and market veterans. Of course, we could try to differentiate any number of other groups - lost coins, market makers, Winklevosses, etc. But swing traders (or swing hodlers, if you prefer) in this classification will fall somewhere between relative beginners and veterans, holding Bitcoin for 1-3 years and trying to benefit from changing market cycles. Read more about «swing hodlers» We'll talk later.
Assigning higher value to coins, longerstaying motionless, Bitcoin days more accurately reflect the behavior of market participants who have been in the ecosystem for a longer time. As the price has grown markedly over time, the investment value of these users has also grown by orders of magnitude. Selling one bitcoin to a newcomer who bought it only last week has less weight than the movement of very old coins held by participants from the first days of the market.
Why are Bitcoin days piling up?
Bitcoin days accumulate over time,because Bitcoin is not a perfect medium of exchange. Theoretically, we can imagine a world in which every bitcoin changes its owner every day. If we lived in such a world, then Bitcoin days would never have accumulated.
We will move on to this concept in a moment.
What is Bitcoin Days Destroyed (Bitcoin days destroyed / destroyed)?
Now that we have an understanding of howBitcoin days arise, let's talk about how they are destroyed. If the bitcoins were held by the owner for a certain number of days, then moving these coins «destroys» the corresponding number of days. For example, if I bought 1 Bitcoin and held it for 7 days, then when I move that Bitcoin from my wallet, those Bitcoin days are considered destroyed. When moving one BTC previously held for 7 days, 7 Bitcoin Days (7 BDD) are destroyed.
Bitcoin itself, of course, is not destroyed. BDD is just a metric. It is assumed that Bitcoin was used to buy anything (pizza, lamborghini or something else) or was transferred to a stock exchange account for sale and has now changed its owner.
Before we continue, two points should be noted:
- Exchange operators hold large quantitiesbitcoins. From time to time, they may need to move some of the funds stored in cold wallets. Such actions may be mistakenly classified as cashing out of one's holdings with whales, when in fact this is not the case.
- The number of bitcoins in circulation over timeis growing. Consequently, the number of daily Bitcoin days created is increasing. If we look separately at the dynamics of the BDD indicator over time, then at first glance it might seem that people are simply fleeing the asset en masse (see the chart below).
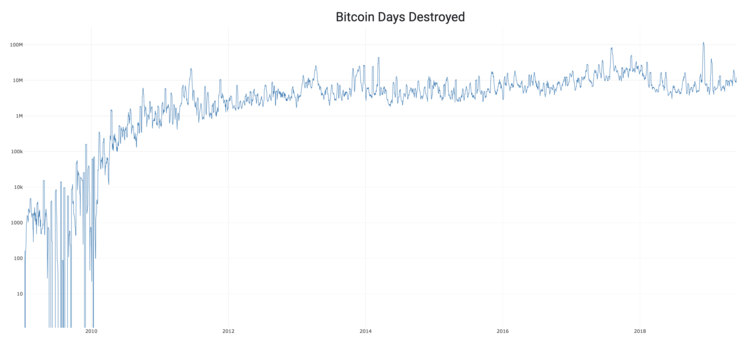
: blockchair.com
To accommodate this natural growth of BDD, weadjusted the metric by dividing BDD by the total number of bitcoins in circulation for each day and called the new metric «adjusted BDD» (Adjusted Bitcoin Days Destroyed). Adjusted BDD more accurately represents the amount of Bitcoin traded over time by its long-term holders.
Adjusted BDD = BDD / Number of Bitcoins Issued
In order to minimize distortion due tomovements of coins between exchange wallets that do not reflect the behavior of hodlers, we took the all-time average of BDD and asked ourselves a simple question: «Have more Bitcoin days been destroyed today (by an adjusted metric) than the all-time average? » The answer to this question can be seen below: the days for which it was affirmative are highlighted with red candles.
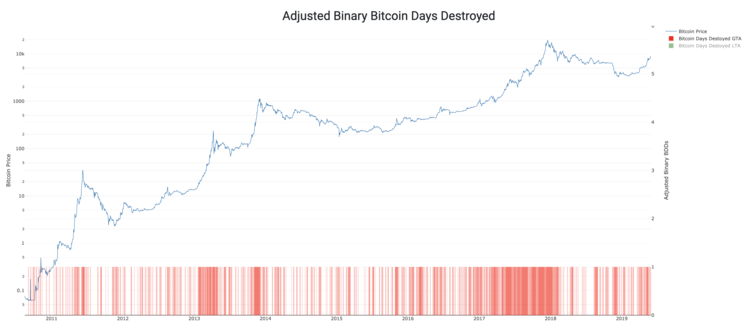
and data: blockchair.com, blockchain.com
As we can see, medium and long-term participantsmarket, it seems, pretty good feel the right moment to exit the market when the formation of the next bubble. But it’s even more interesting to take a closer look at those periods when the adjusted BDD was below average.
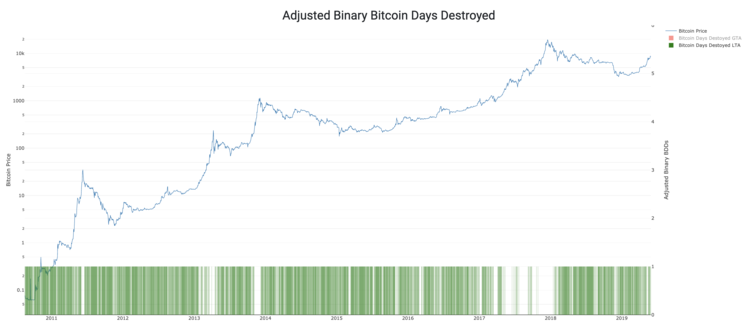
and data: blockchair.com, blockchain.com
Here, green candles indicate periods of preferential accumulation. This buying support lays the foundation for what happens next.
Now that we have an understanding of how weBDD and, especially, adjusted BDD can be useful, what else can we do with this information? At the very beginning of the article, we said that quantifying demand is of paramount importance for evaluating bitcoin. Is there a way to use the UTXO kit to quantify demand?
Let's recall the calculation of Hodler. When someone buys Bitcoin and decides not to sell it, what is its motivation? It is logical to assume that this person expects that in the future, bitcoin will cost more. What if we add to the equation the opportunity cost of this solution, that is, the cost of missed opportunity?
Destroyed Coin Days (VOCD)
If I have 1 BTC, then the cost II can get from its sale today equal to its market price. Having looked at the number of BDDs for each day, it is easy to notice that this indicator rarely exceeds the number of bitcoins issued to this day. However, there are exceptions to this rule - for example, peak periods of price bubbles, when more Bitcoin days are destroyed than there are more Bitcoins in circulation. These periods are worth paying attention to.
In other words, if everyone released to thistime a bitcoin changed hands today and each of those bitcoins was held by the new owner for exactly one day, then the number of BDDs on that day would be equal to the total number of bitcoins issued (the number of bitcoin days would remain unchanged). In this case, the product of BDD and the price of BTC will be equal to the market capitalization of Bitcoin, and the adjusted BDD will be equal to one. To illustrate this clearly, we created a metric called «cost of coin days destroyed» (Value of Coin-Days Destroyed, or VOCD).
VOCD = ∑ (Bitcoin price at the end of the day * adjusted BDD)
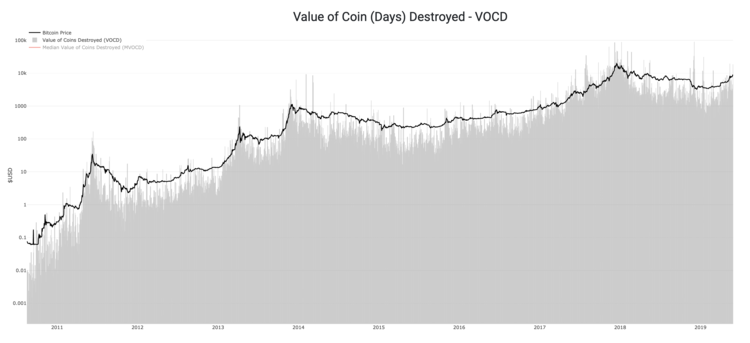
and data: blockchair.com, blockchain.com
If BDD is calculated in bitcoins, then VOCD is in dollars. When the gray line is higher than the black one, it means that the VOCD is higher than the bitcoin price or that more BDD was destroyed that day than it was created.
MVOCD
In order to level out the distortion of the resultsDue to the large movements between exchange wallets that we already mentioned, we took the median VOCD value over 30 days, calling the new metric «median value of coin days destroyed» (Median Value of Coin Days Destroyed, or MVOCD).
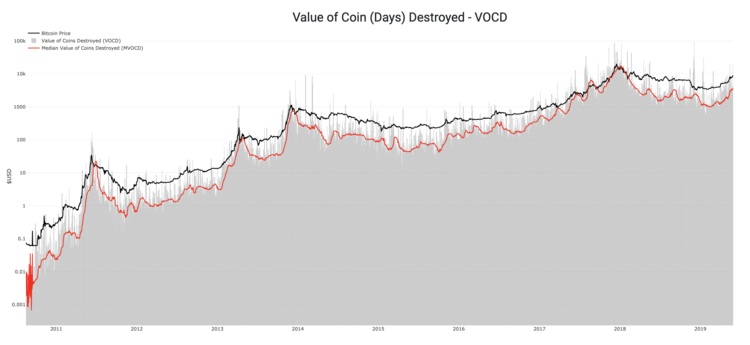
and data: blockchair.com, blockchain.com
Every day when MVOCD does not exceed pricesBitcoin, more Bitcoin days are created than destroyed. We could see this as an opportunity cost to the Bitcoin holder. If today I hold bitcoin, valued by the market at $ 8,300, then I refused $ 8,300 in favor of bitcoin.
Summing up the total dollar equivalentheld bitcoins over time, you get the total alternative value created over the entire life of the Bitcoin network due to the decision of users to hold bitcoins instead of selling them. This is a HODL Bank.
HODL Bank
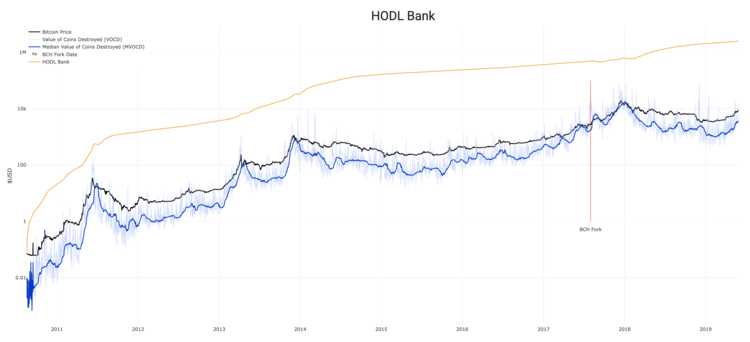
and data: blockchair.com, blockchain.com
How should we interpret the decisionowners to delay spending their bitcoins? It is reasonable to say that in this way, network participants make their choice every day, expressing confidence in the future economic value of Bitcoin. Think about it from this point of view: how confident is the market in the value of Bitcoin?
We can even assume that the choice is in favorBitcoin purchases are based on the confidence of existing and future participants in this market. Would you want to buy something that everyone is trying to get rid of? What about an asset with limited supply and a substantial share of hodlers? How to determine which of these scenarios is being implemented?
Bitcoin price appeal can be appreciatedthrough the ratio of the purchase price of Bitcoin on the corresponding day to the total amount of confidence built over time. If confidence is high and the price is low, then we have an attractive risk / return ratio. Conversely, with a high price and a low degree of confidence in the market, the risk / return ratio is unattractive.
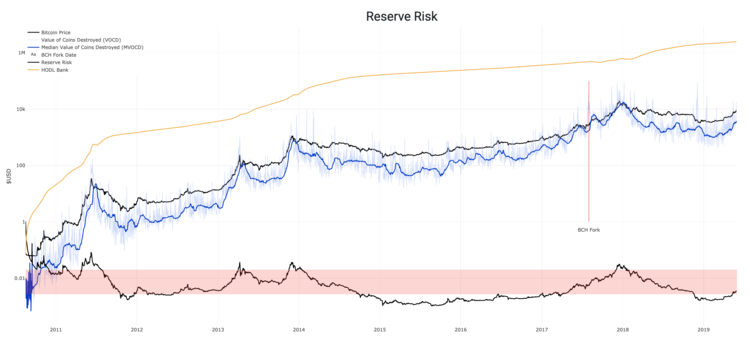
and data: blockchair.com, blockchain.com
This can be measured by dividing the price of bitcoin at any given time into its HODL bank. This way we get what we called Reserve Risk.
The last chart shows that the purchaseBitcoins, when the risk of a reserve (determined through the ratio of the volume of the HODL bank to the price of bitcoin at each moment in time) is at the lower levels, historically proved to be an extremely profitable investment. In 2019, reserve risk reached lows close to the 2011 level, but still slightly higher than 2015. Binary adjusted BDD, VOCD and reserve risk give us confidence that the market bottom has already been passed, as well as some insight into how events can develop in the future.
</p>
Read this:
 Bitcoin: when is it best not to buy
 How to prepare for bitcoin halving?
 Two weeks ahead of Bitcoin's drop to $ 8,000
 Jihan Wu: “Halving the reward to miners may not affect the Bitcoin exchange rate”
Steve Forbes: “Bitcoin is a way to fight authoritarian governments”
Jihan Wu: “Halving the reward to miners may not affect the Bitcoin exchange rate”
Steve Forbes: “Bitcoin is a way to fight authoritarian governments”
 Livermore's expanding wedge of accumulation