")
A large number of traders are in search of the Grail of the market and often do not see that very simple things forearnings in financial markets lie onsurface. Is it possible to make money in fairly liquid markets today? If yes, then let's figure it out. Today I suggest not looking at the Forex currency market or cryptocurrencies, but let's look at the indices.
You may have heard that the market is earninginvestment funds, major players and of course market makers. However, there was a wrong opinion regarding exactly what these participants are making their fortunes on, increasing capital.
I think every trader or even investor has heard aboutDow Jones, S&P 500, Nasdaq and other indices. But now answer for yourself personally. What is hidden under these big names? Why are they talked about so often on professional forums and blogs? And how will understanding these things help me personally in trading?
So, these names hide a whole world behind themvarious formulas for stock market prices that I wanted to introduce you to. The oldest and most famous, or “General” as it is also called, is the Dow Jones stock index.
The Dow Jones Industrial Average isone of the most closely monitored indicators in the United States. It is a price-weighted index that tracks the performance of 30 large, well-known U.S. companies listed primarily on the New York Stock Exchange. The Dow Jones Industrial Average has a base value of 40.94 as of May 26, 1896. A little later, other indices appeared, and in particular the S&P 500, which will be discussed below.
This index has been the main one for many decadesindicator of the US economy and was used by professional market participants to track the dynamics of their stock portfolios. It was only an indicator and could not be traded. However, over time, enterprising people decided to make it possible to trade not only stocks, but also the index itself. For what? It's simple. Trading an index became a kind of purchase of a block of shares included in its composition. That is, there is no longer a need to buy the shares themselves and then sell them at a higher price. It was possible to buy just the index itself as one instrument, and then close the trade on it when necessary. A little later, it became possible not only to buy the Dow Jones index, but also to open Short positions (trading down) in order to earn money rather than lose if the stock market fell.
Over time, even market-neutraltrading strategies in which the shares themselves were bought in the same proportion as they were included in the formula for calculating the index and at the same time the index itself was sold. Why do you ask such difficulties? And behind the fact that having stocks on hand and at the same time having a short position on the index, you can be calm about where the market will go. And where is the profit then if one empties the account and the other replenishes it? Dividends. It was on them that the whole emphasis in trade was made. That is, you could just live on dividends and not worry about your investments. If the stock market was growing, then the shares gave profit, and the index gave a loss equal to the profit of the shares themselves, but dividends gave additional earnings and vice versa.
However, in the framework of this article we will not detaildisassemble this strategy, and consider what are the attractive indexes to us today and how to make money on it. First of all, I want to draw attention to the fact that in the modern world it is the Forex market that has become very popular among novice traders. However, this does not say that this market is the one to be invested in. And believe me, investment funds use the Forex market not for investment, but for the purchase and sale of currencies in order to enter the stock market of the country to which the stock belongs or to buy bonds of the same country. There is also a purely exchange market in which there is no leverage and this market exists for only one purpose - money exchange.
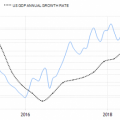
But why all this information and why indexesto us personally, if so, we may have problems with Forex trading, and then there are indexes. Now let's compare the two charts, EURUSD and SP500 (the most popular US stock index, which essentially shows the country's economy) over a period of 10 years.
")
What are we doing?And the fact is that if you invested in EURUSD, then in essence you would not have any profit over the long haul. The only way to make money would be to constantly change the direction of trades and be always on guard if the market turns around. But if you simply used a buying strategy on SP500, your profits would constantly grow. What is this connected with? There are many reasons. One of the very first is that this index includes companies that have had enormous success. Companies with poor performance are not included in the index. Also, the growth of the country’s population increases GDP and an increasing number of people invest their funds in the best companies in order to receive dividends (passive income) or simply so that capital does not “melt” with inflation. There are a number of other reasons, but we won’t talk about them today.
I would also like to draw your attention tostatistics in the numbers of these two instruments over ten years. The principle of these statistics is quite simple. We take 2 tools. In our case, EURUSD and SP500, we look at the percentage change from the opening price of the day to the closing price to determine which strategy to use.
This daily chart is from October 21, 2009 to November 21, 2019
EURUSD = 2361 (trading days)
growing days = 1307 (or 49.68% of the time)
falling days = 1305 (or 49.60% of the time)
days unchanged = 19 (or 0.72% of the time)
Total: there is no trend for a long period of time and trading on the principle of opened a deal and keep it will not bring profit!
SP500 = 2314 (trading days)
growing days = 1426 (or 54.55% of the time)
falling days = 1157 (or 44.26% of the time)
days unchanged = 31 (or 1.19% of the time)
Total: a clear significant advantage is seen in the direction of growing days. This was also seen in the chart above. If you don’t believe me, that’s the link to the online spreadsheet https://docs.google.com/spreadsheets/d/e/2PACX-1vRaT_5vb3JSBUgG4G-HVuuGMoIKQAO_Oni35xeEgZI4-xzi9opbvwMzjYfWrdzsl16hblw9w16
In this article, we examined a comparativestatistics of two different markets and saw the indisputable advantage of the SP500 index in front of the EURUSD currency pair. But this is only one of the facets of the benefits that we talked about in this article. In the next article, it will be possible to continue acquaintance with indexes and opportunities for earning on them. We will talk about the simplest trading methods without getting into the dense jungle of technical analysis, but we will use really effective tools that I personally use and my students who have been trained in trading strategies on stock indexes for a rather long period of time. If you are also interested in learning to trade in plus for a short period of time under my careful mentoring, then write to me personally. I'm pretty easy to find on the internet. Type in a search engine Artem Yaskiv or SMART4TRADER and you will see a link to my website or social networks.