2021 Bitcoin Markets Summary: Blockchain Metrics, Futures Markets, and Market Key Indicatorsmining.
- On-chain analysis
- Exchange Balances, Illiquid Offer
- Offer in the hands of long-term holders, 30-day change
- Cost of "coins" for owners, distribution of UTXOs by selling price
- Transaction volume, percentage of supply in profit
- Market valuation
- The ratio of market value to realized
- Reserve risk
- Derivatives
- General open interest in futures
- Annual moving basis
- Open interest on perpetual futures, funding rates
- Bitcoin Mining
- Hashrate
- Complexity
- Annual mining profitability, hash price
On-chain analysis
Bitcoin blockchain is transparent and accessible to the extent thatthat it is easy to find yourself stuck in the constantly updated data for the last day or week. Understanding these short-term changes can be helpful too, but it's important to remember that blockchain data analysis is best used as a tool to assess the macro picture and understand the long-term perspective. With this understanding, let's try to take a look at the big picture of on-chain data change since the beginning of 2021.
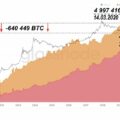
The easiest trend to start with is- these are BTC balances on exchange addresses, which decreased by another 2% last year. This is not much compared to 2020, but it is a continuation of the new macro trend. The rates of BTC outflow from exchanges in July and September 2021 were among the highest in the history of Bitcoin.
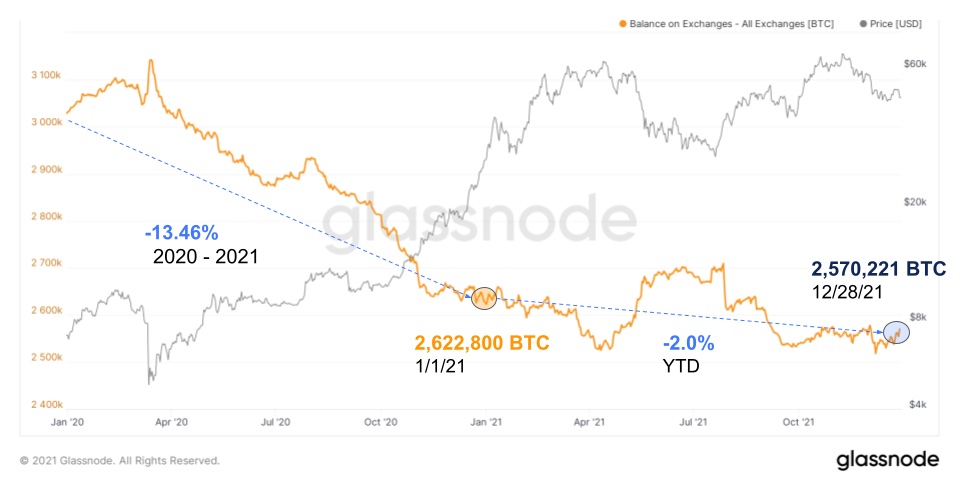
BTC exchange balances (all exchanges)
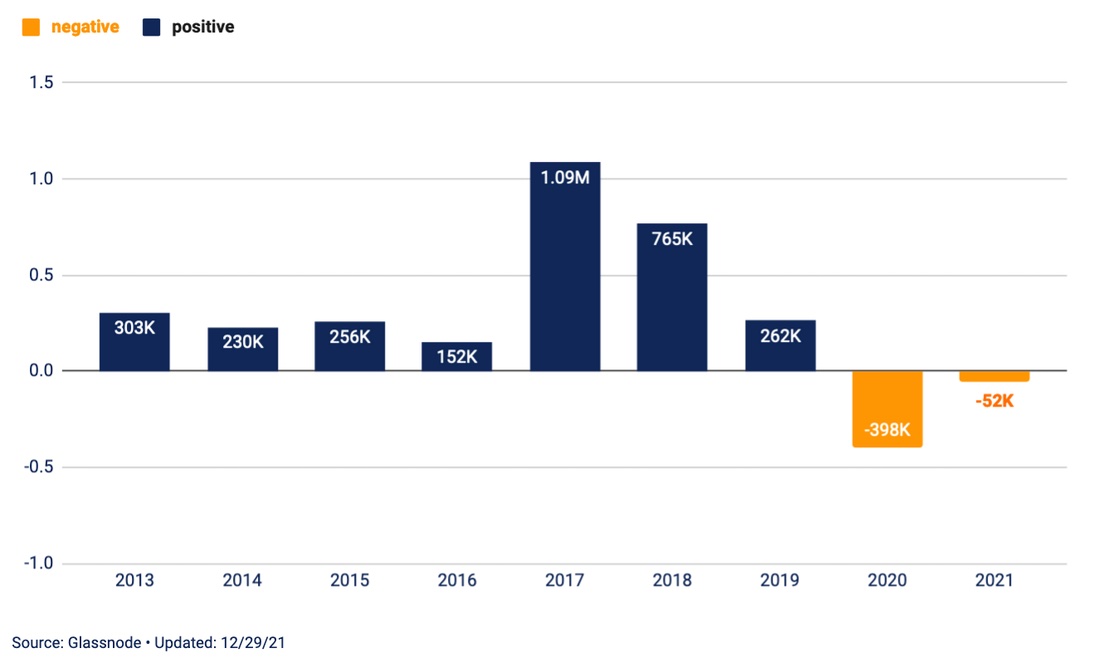
Net inflow of BTC at exchange addresses (in million BTC)
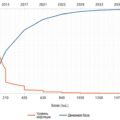
Some of the bitcoins withdrawn from the exchanges have replenishedilliquid supply, which increased by 2.89% over the past year, also slowing slightly since 2020. The growth of illiquid supply at the end of the year outstripped circulating supply, showing that long-term investors purchased BTC faster than new coins were issued in the past year.
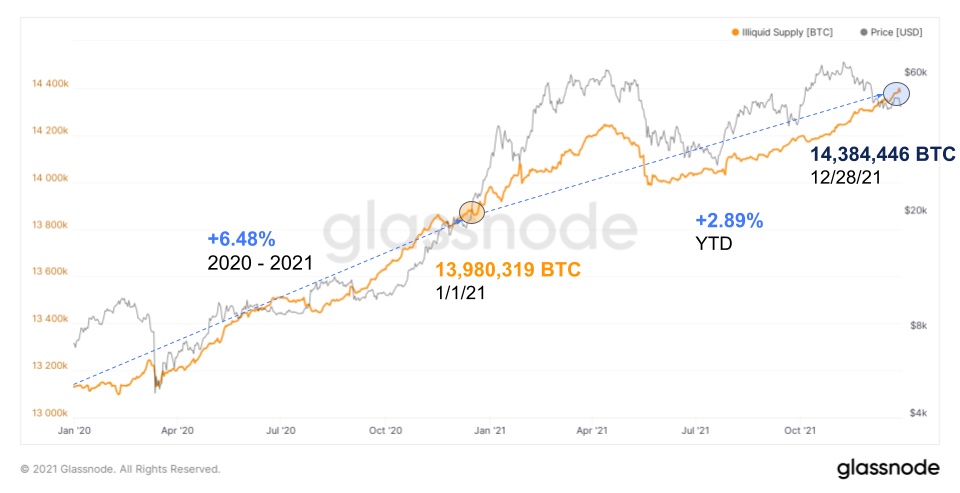
Illiquid BTC Offer
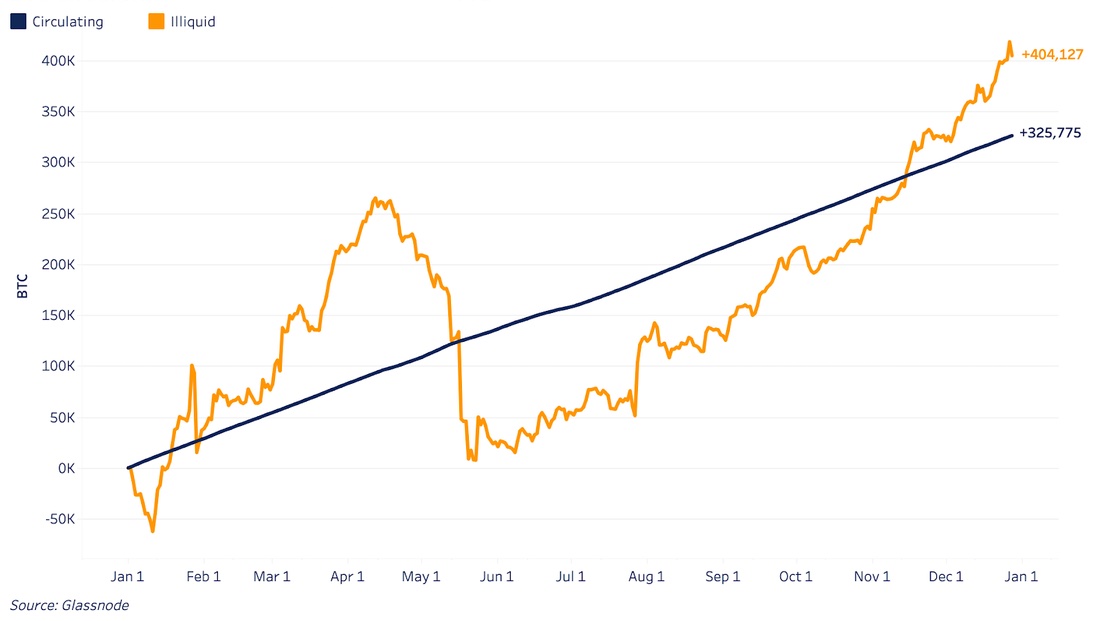
Growth of the circulating supply of BTC in comparison with illiquid
Long Term Bitcoin Accumulation Trendmanifested itself in the supply controlled by long-term holders, which increased by another 16.12%. This rally was fueled by one of the largest periods of aggressive accumulation in Bitcoin history since the July price lows.
Even after a little distribution from the sidelong-term holders in the past few months, this category of investors still controls over 70% of the circulating supply. This level of domination by long-term holders has not been observed since 2017.
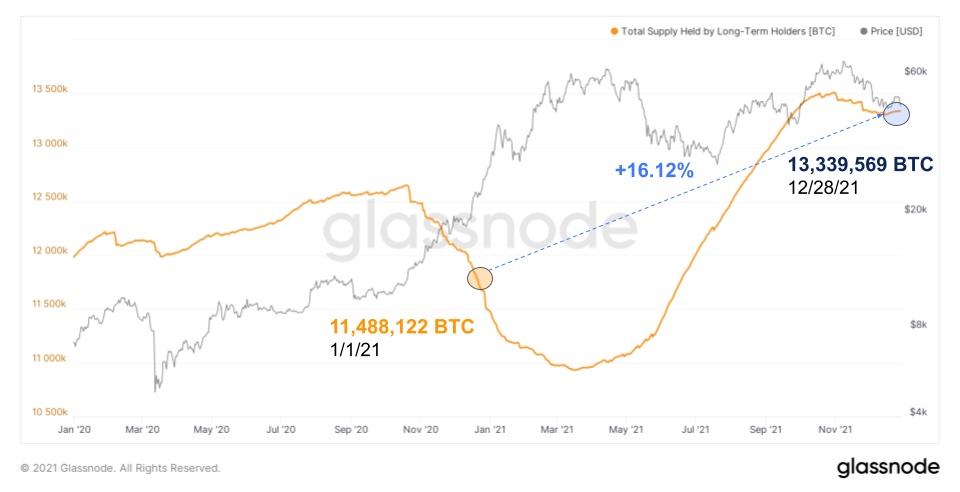
BTC offer in the hands of long-term holders
After periods of sharp distribution and accumulationcoins by long-term holders in the past year, the market is now in a neutral state, with a change in supply of only 0.1% over the past 30 days.
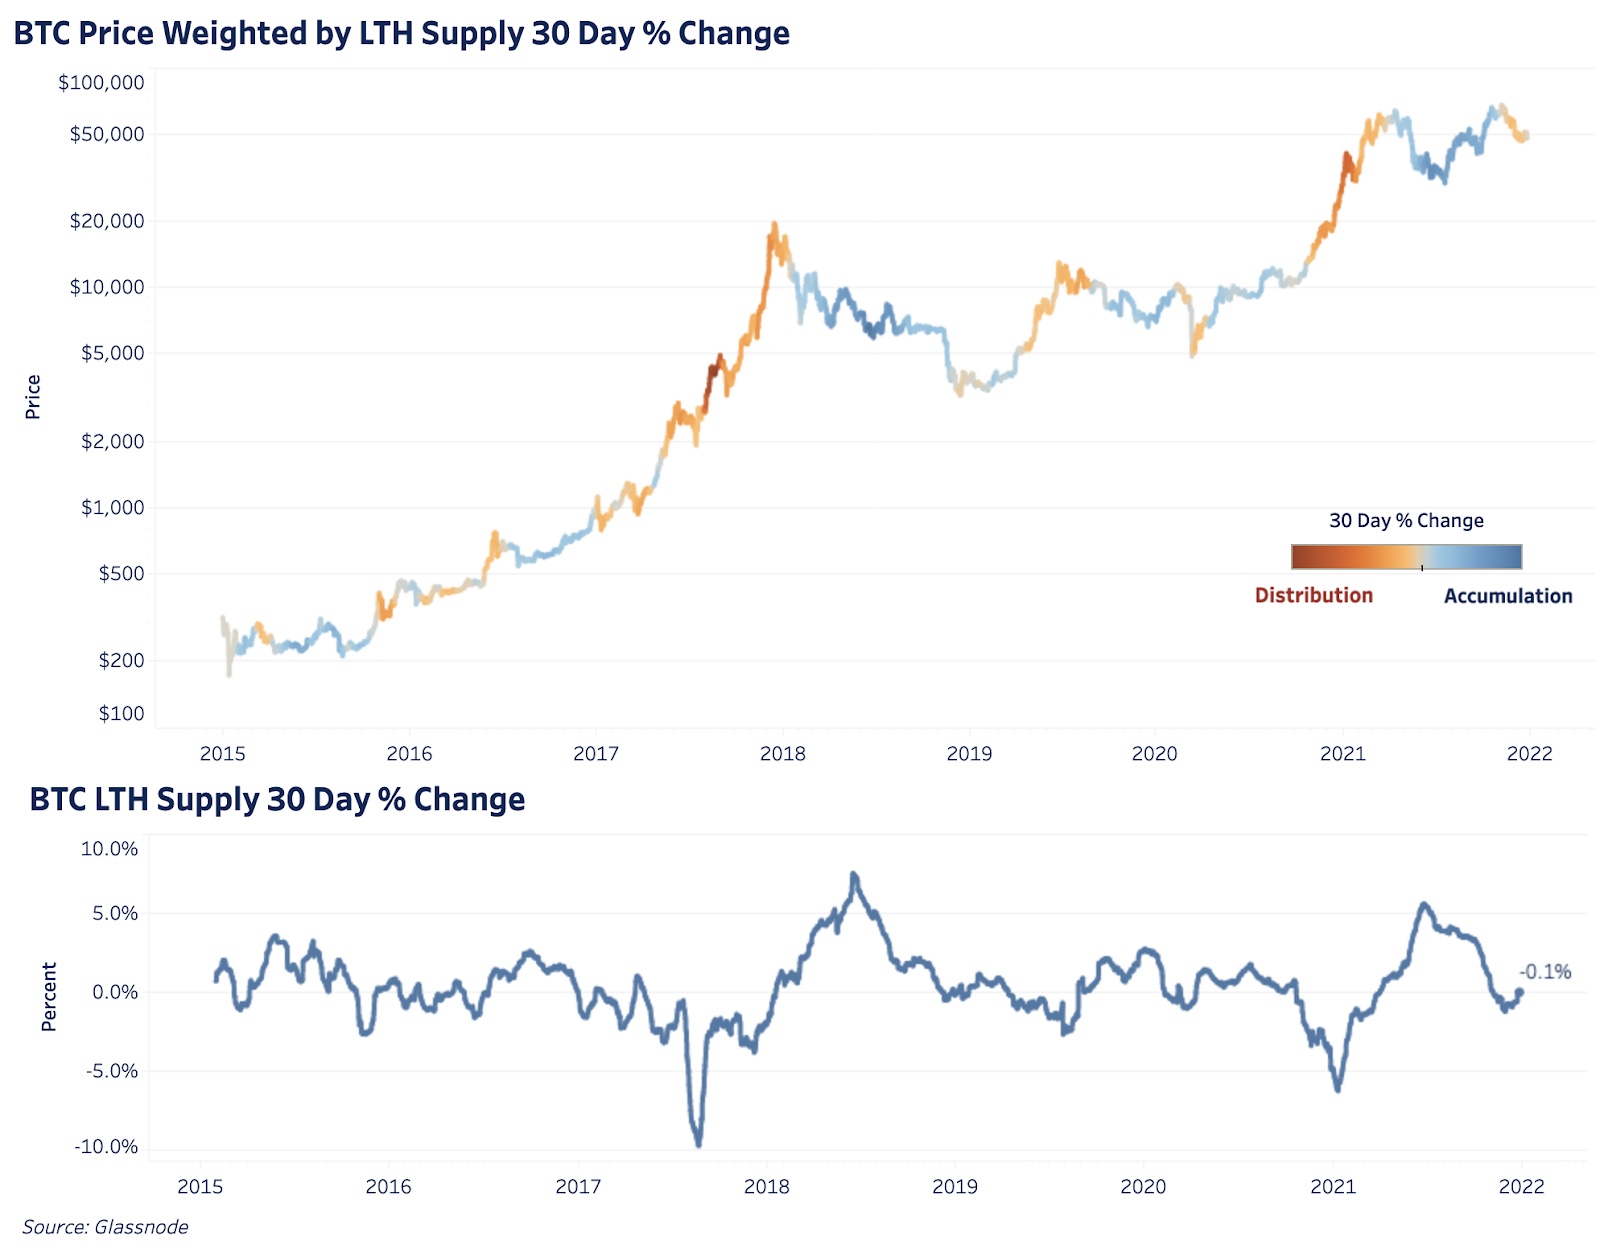
BTC price weighted by 30-day change (%) in supply controlled by long-term holders (top).
30-day change in BTC supply controlled by long-term holders (bottom).
Based on the results of periods of strong distribution andaccumulation during this year, the average cost of coins for long-term holders increased by 227.61%. This rising cost base creates healthy support for the bitcoin price as the ratio of long-term holder price to cost base has dropped from 10 to 2.6 in the past year.
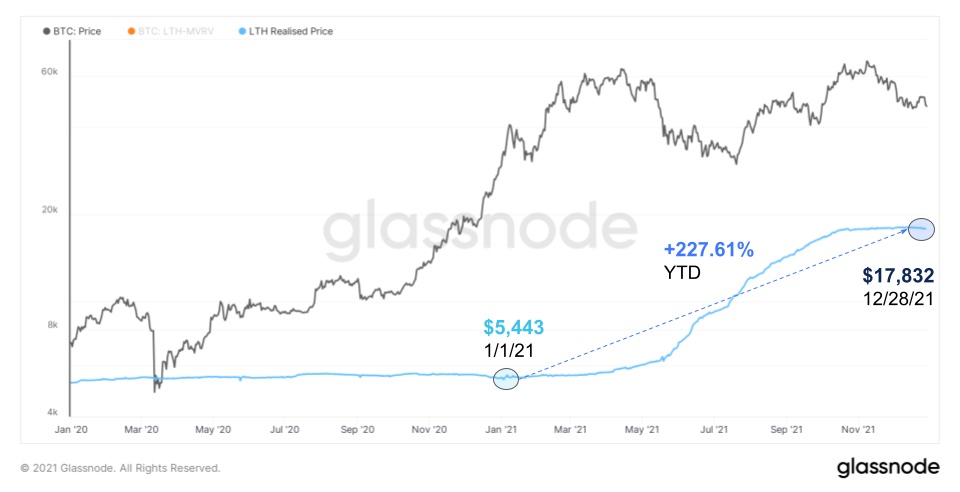
Cost basis for long-term BTC holders
BTC cost basis for short-termholders over the past year also grew by 169.36%. However, following the recent correction, the price has failed to recover above the current cost base for short-term holders, which has historically served as key support for the continuation of bull markets. Excluding exchange balances, this implies that around 16% of BTC supply is currently at a loss.
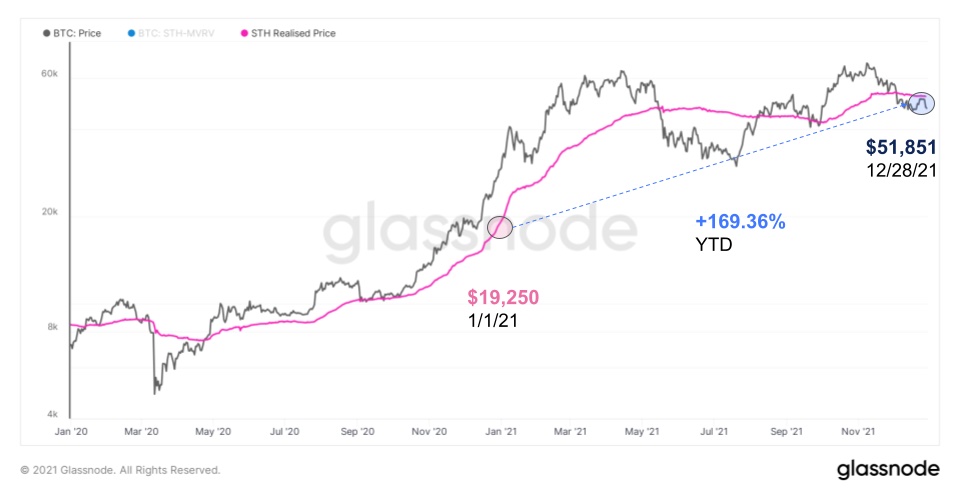
Cost basis for short-term holders of BTC
In general, at the end of the year, the profit is 73.29%of the entire BTC supply, and this is a completely different state of the market than at the beginning of the year. July 2021 gave us an annual low of less than 70%, but this figure did not come close to the 43.07% supply in profit observed in March 2020.
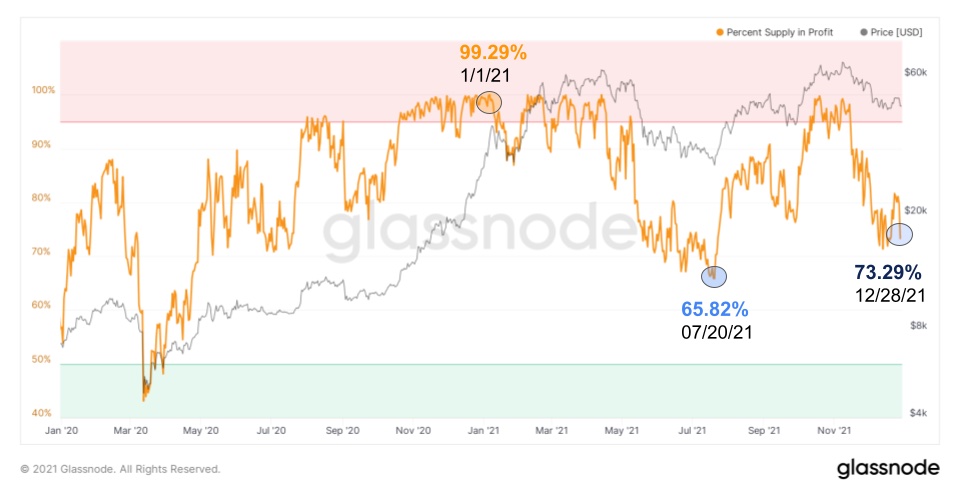
Percentage of BTC offer in profit
Although the market ended the year with a higher share of coins inloss, the distribution of this supply is very different. At the beginning of the year, the price was slightly below $30 thousand, while only 12.64% of UTXO had a purchase price above $20 thousand. At the end of 2021, 44.24% of UTXO and almost 20% of the supply last year had a purchase price of more than $20 thousand changed hands several times at prices above $50K.
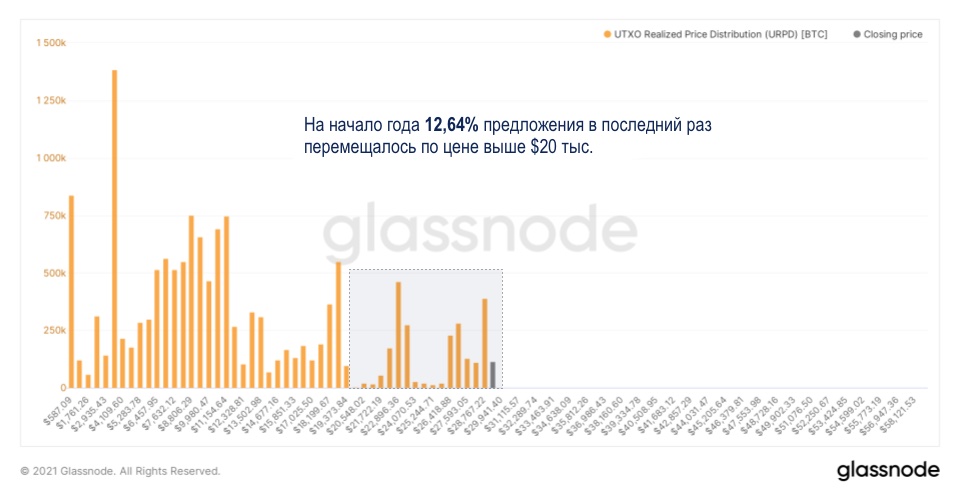
Distribution of UTXOs by selling price as of January 1, 2021
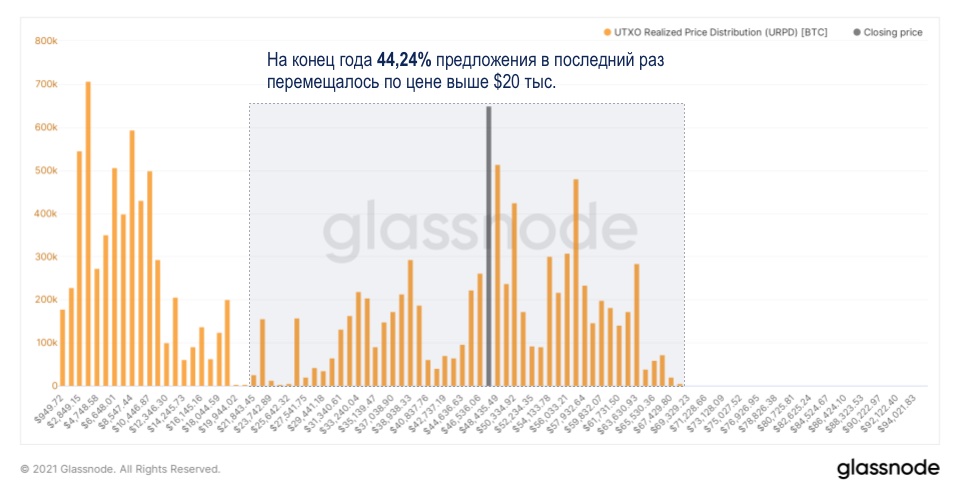
Distribution of UTXOs by selling price as of December 28, 2021
Change in supply distribution inlargely driven by new demand and new pricing levels that drive up the current “fair value” of bitcoin. Both retail investors and institutional capital served as new demand in the past year. One way to assess trends in demand is to analyze changes in the dollar value of transactions. Based on this metric, most of the retail demand appears to have peaked in January-March, while institutional demand has increased throughout the year.
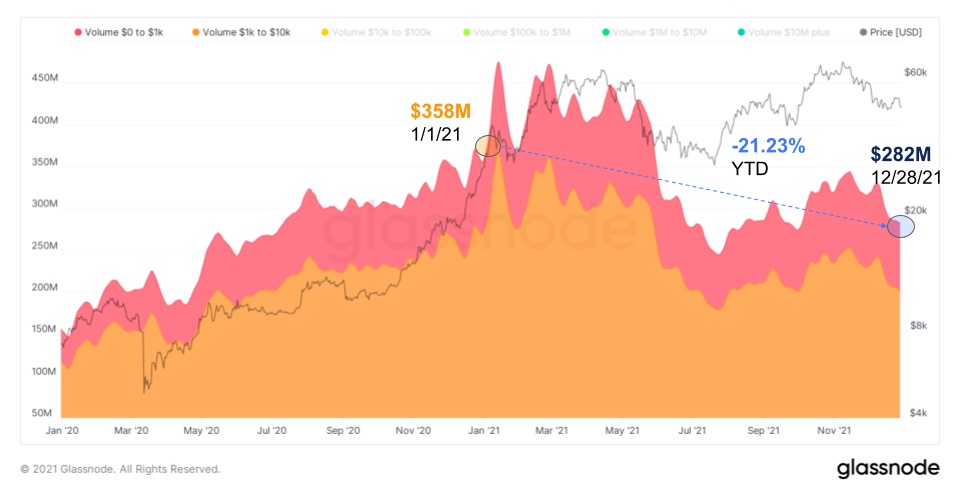
Total volume of transactions worth less than $10 thousand (7d MA)
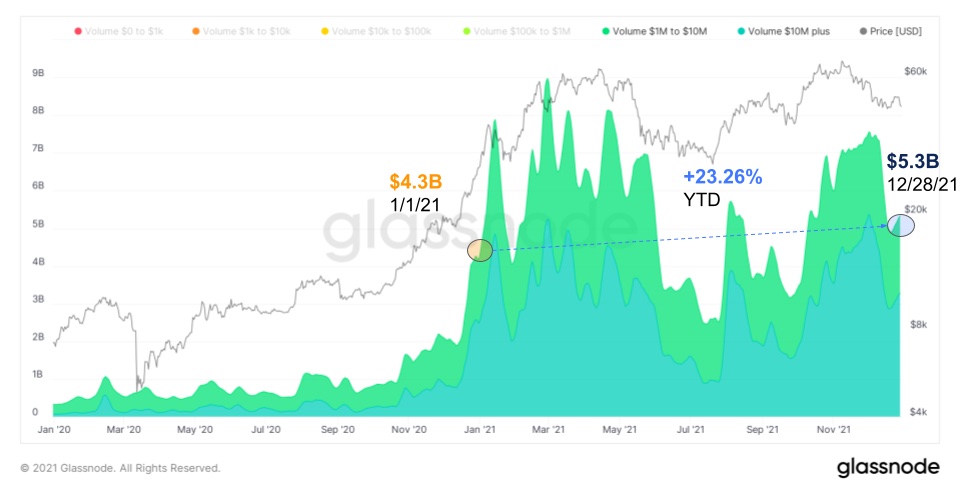
Total transaction volume over $1 million (7d MA)
Market valuation
Of the relative market valuation metrics available, we prioritize MVRV and provision risk.
As for the MVRV coefficient, the realizedWe perceive the price as the purest view of Bitcoin's monetization, and therefore the ratio of the current market price to the realized price gives us a relative market value. Currently, the MVRV is 1.94, which is very far from the peaks seen in market bubbles, but also not below the 1.0 level, which has historically signaled the best buying opportunity.
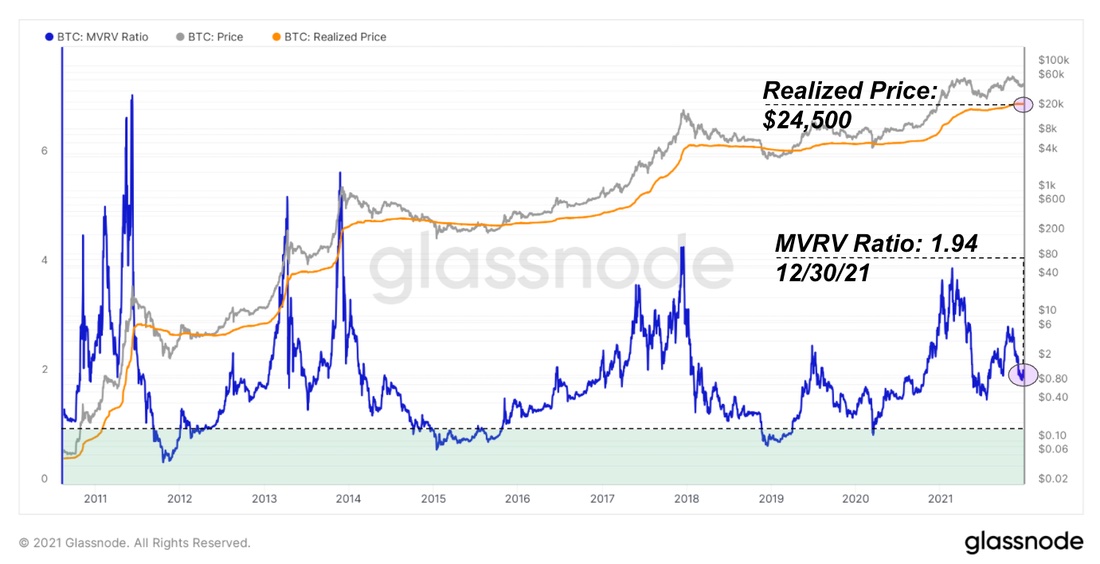
MVRV Ratio: The ratio of BTC market value to realized value
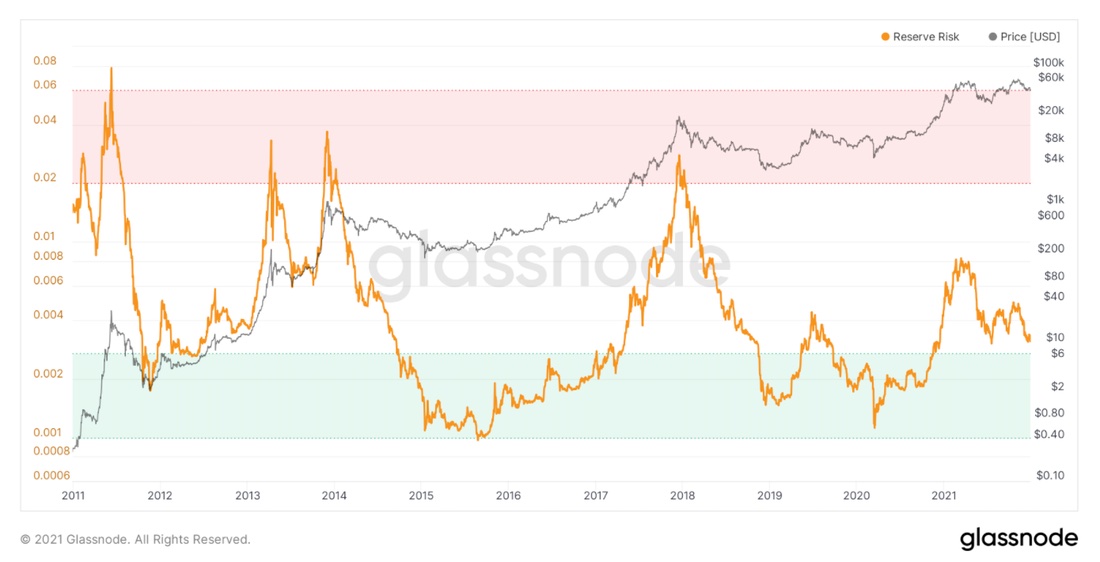
Our second preferred metric in relation toBitcoin's market valuation is the "reserve risk" that we have detailed here. Reserve risk is a way to quantify the incentive to sell bitcoin versus the total cost of lost profits for holders. When the accumulated opportunity cost is high (strong hodling) and the price of BTC (incentive to buy) is relatively low, the indicator gives a buy signal.
Reserve risk
At the end of the year, reserve risk is at roughly the same levels as in the summer, when the price of BTC briefly dipped below $30k.
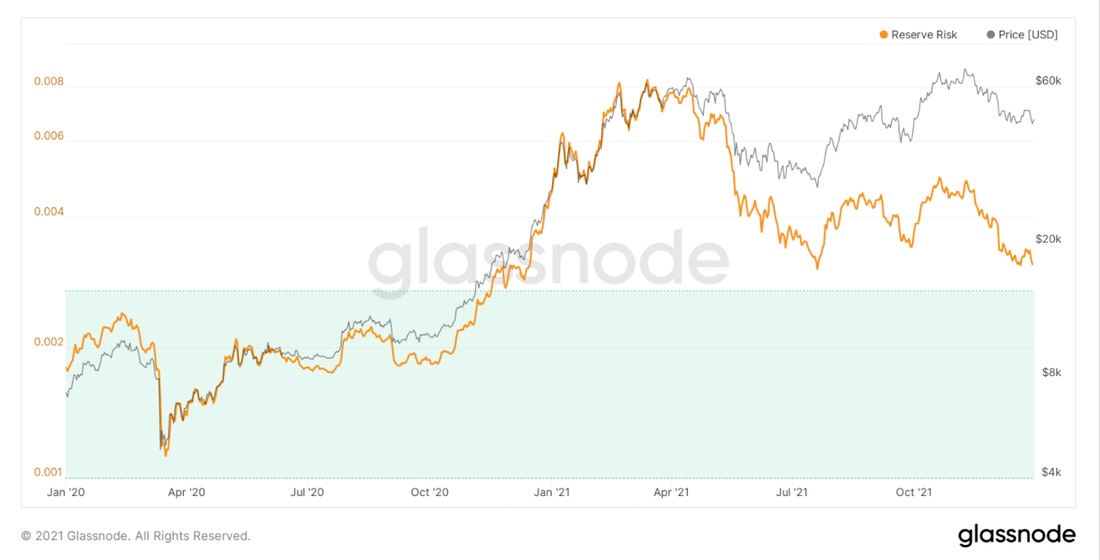
Reserve risk
Derivatives
The Bitcoin futures market has played an important role incryptocurrency market in 2021, when local lows and highs were largely determined by overly aggressive speculators betting against the tide of spot accumulation or distribution.
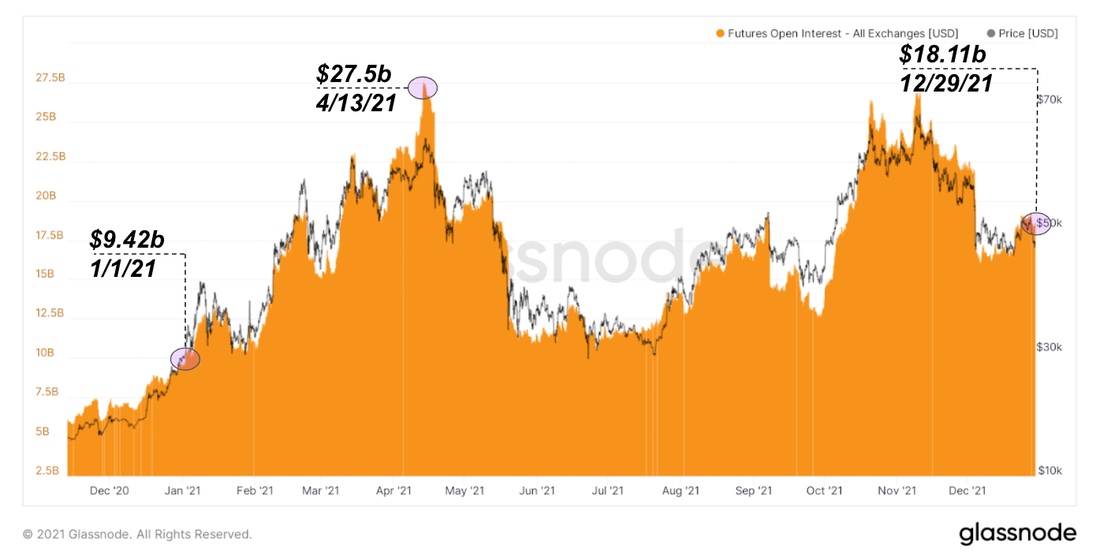
Total Open Interest (in USD) for Bitcoin Futures
Total futures open interest openedlast year at $9.42 billion, then soared to $27.5 billion in just four months, with more traders using their Bitcoin as collateral for margin long futures. Major liquidations followed from April to May (visible in the decline in BTC-denominated open interest), the price of BTC fell just below $30k, and market sentiment and the long/short ratio completely reversed.
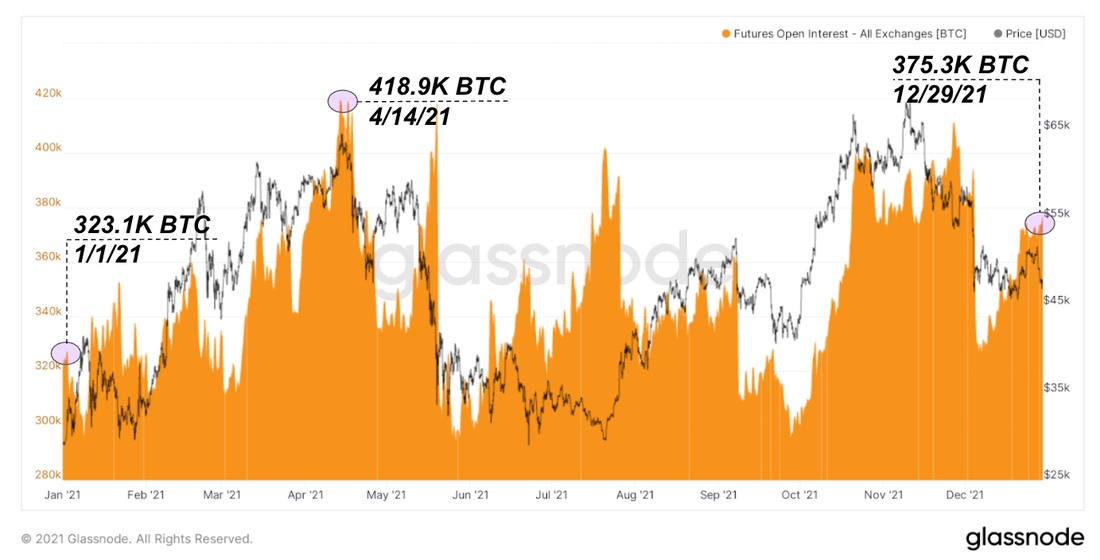
Total Open Interest (in BTC) for Bitcoin Futures
Against the backdrop of a summer drop to $30 thousand.traders in the derivatives market increasingly pushed down the rate of perpetual swaps, and the funding rate remained negative for a long time. During this time, despite the price decline, open interest in BTC/USDT perpetual swaps on Binance rose from ~$1 billion to $2.6 billion, with funding becoming increasingly negative.
This is a significant increase in open interest forJuly short counting led to an explosive recovery from a local bottom, re-emphasizing the importance of understanding derivatives market dynamics in relation to the underlying asset for many traders who were caught off guard by the move.
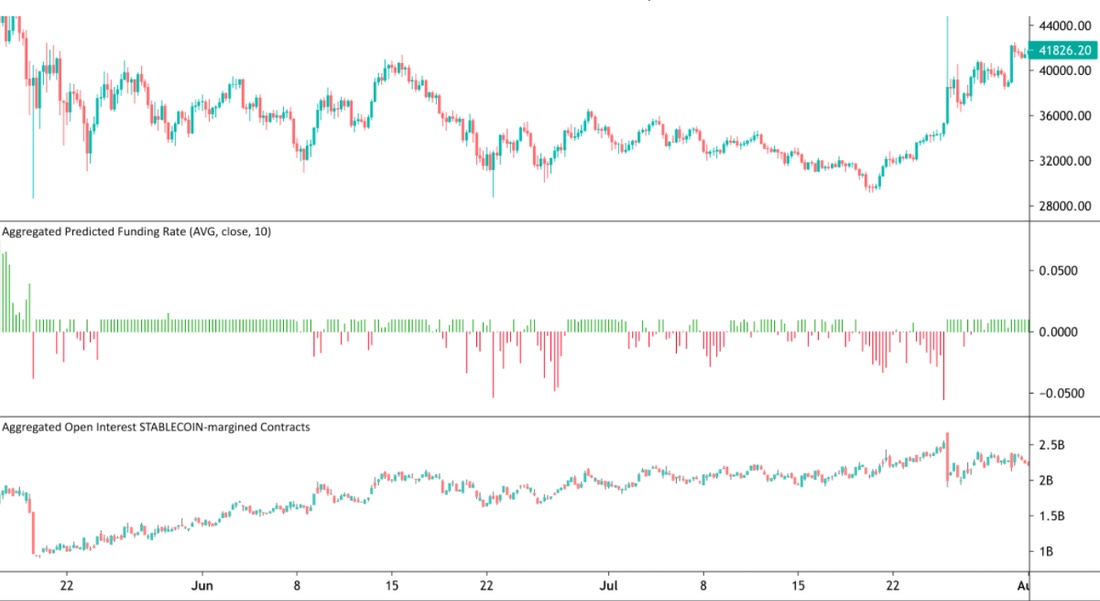
Course, Funding Rate and Open Interest for BTC / USDT Perpetual Swaps on Binance
Comparison of the total funding rate forexchanges with the BTC price over the previous two years reveals a clear pattern: when the ratio of purchases and sales on the part of speculative players reaches certain values, the market tends to slow down and form a strong momentum in the opposite direction.
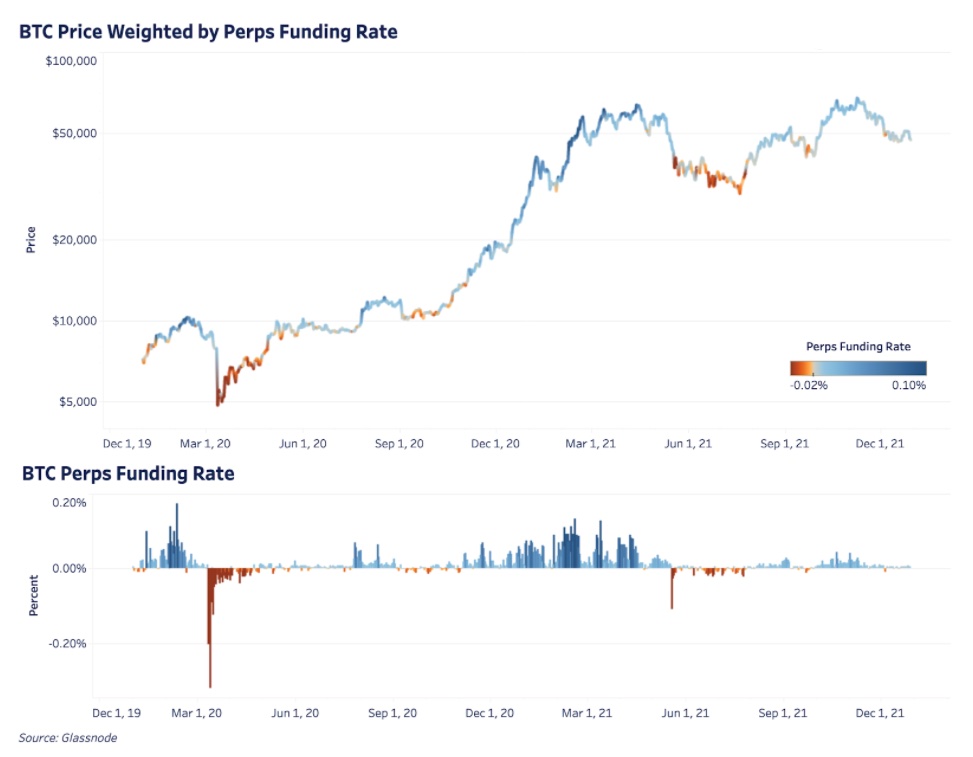
BTC price weighted by the funding rate for perpetual futures (top).
Funding rate for perpetual BTC futures (bottom).
Similar to funding rates for perpetualswaps, the annual sliding basis of futures (the spread between the spot price of an asset and the price of forward quarterly futures on an annualized basis) rose sharply in April, up to a fantastic 45% amid the euphoric sentiment of speculators in the crypto markets.
With the liquidations that followed the Aprilthe maximum, the spread of the basis collapsed and since then has fluctuated in the range from 0% (and even minus values at the moment for some contracts) to 15%, and at the end of the year the basis on an annualized basis is 8.83%.
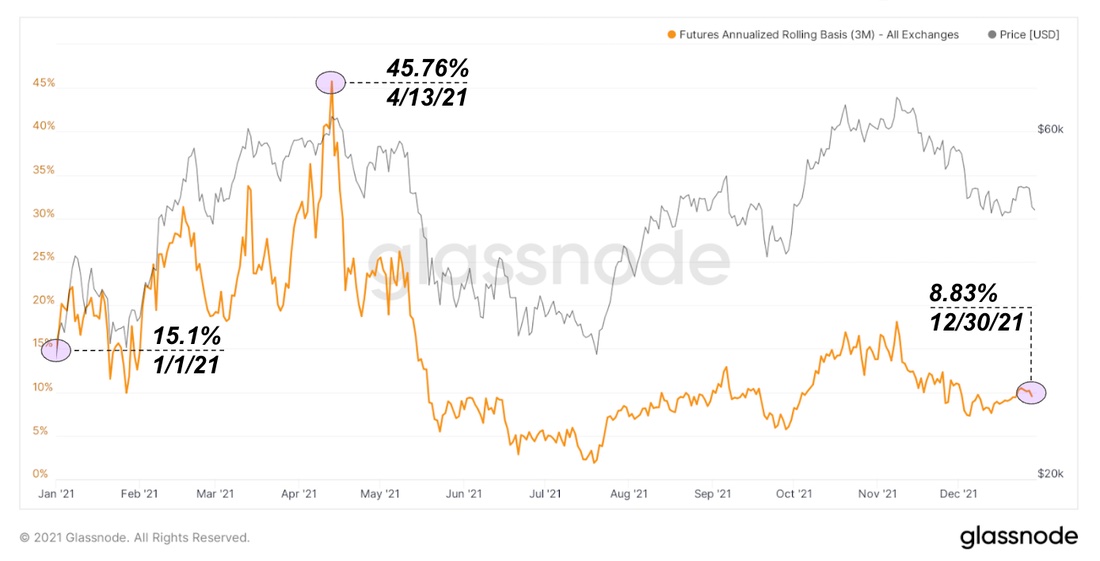
3-month sliding basis for bitcoin futures year-on-year
By analyzing the structure of the futures market, the shareperpetual swaps in the total open interest in futures markets continued to grow in the past year and at the end of 2021 amounted to 65.3%. The rest of the open interest is distributed over derivatives contracts with weekly, monthly and quarterly expiration dates.
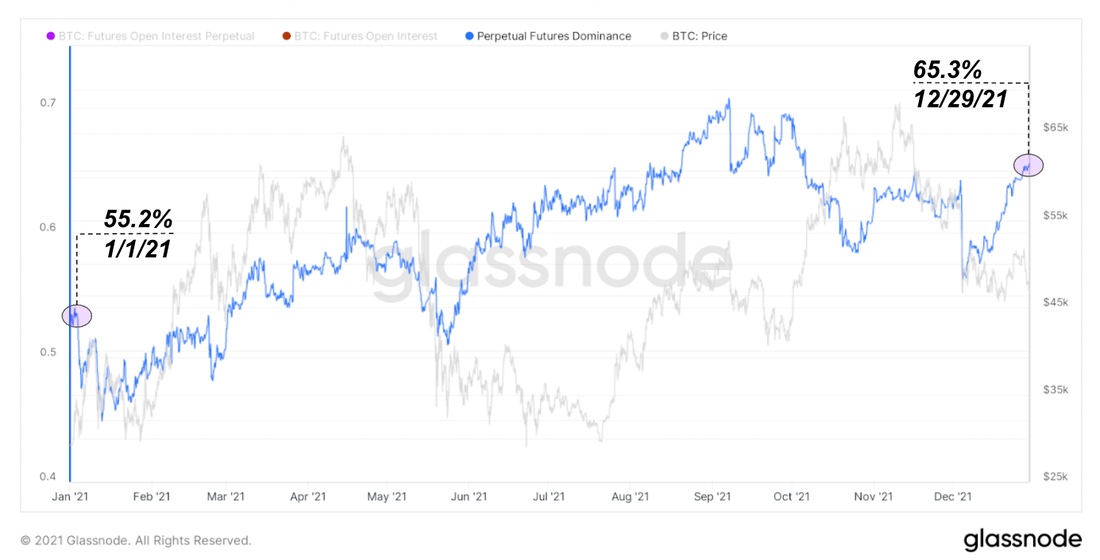
Dominance of perpetual swaps in total open interest in bitcoin futures
The dominant exchanges in the perpetual swap market arethese are Binance, FTX and ByBit, in that order, with Binance and FTX increasing their market share significantly over the past year (from 26.0% to 40.8% and from 10.9% to 20.3%, respectively). In contrast, ByBit's share fell from 21.4% to 16.3%.
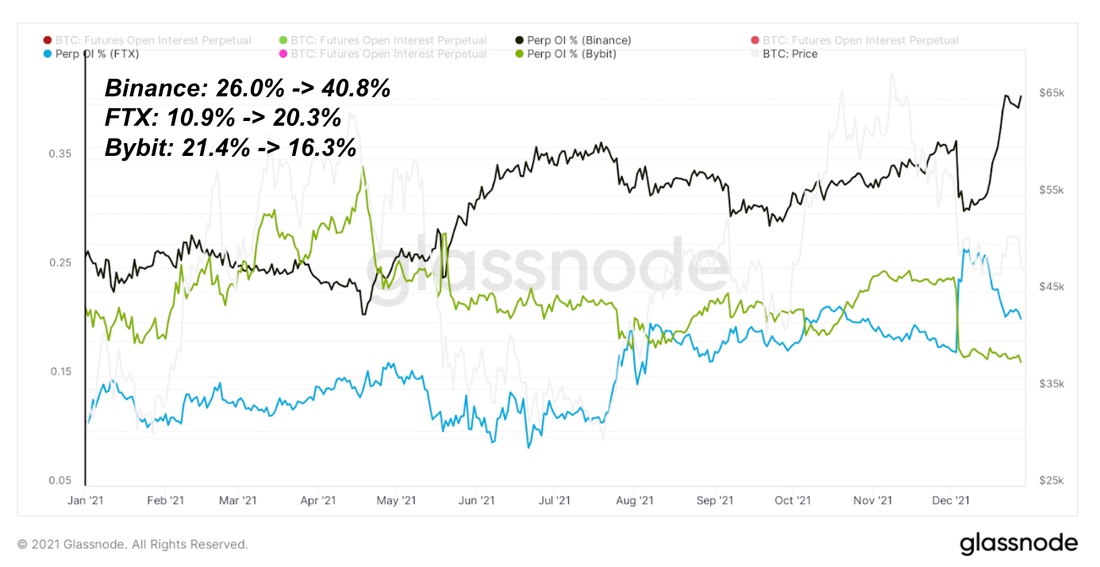
Share in the total open interest in perpetual futures on BTC for the three leading exchanges in this indicator
As for the distribution of open interest overtype of collateral, then a decrease in the share of margin in Bitcoin / cryptocurrencies and, accordingly, an increase in the share of margin in stablecoins is more favorable for speculation on the buy side, since it eliminates the bulge that occurs when margining a long with the same asset.
Since the beginning of 2021, the share of BTC-margin futures in the total open interest on perpetual swaps has decreased from 61.3% to 41.26%.
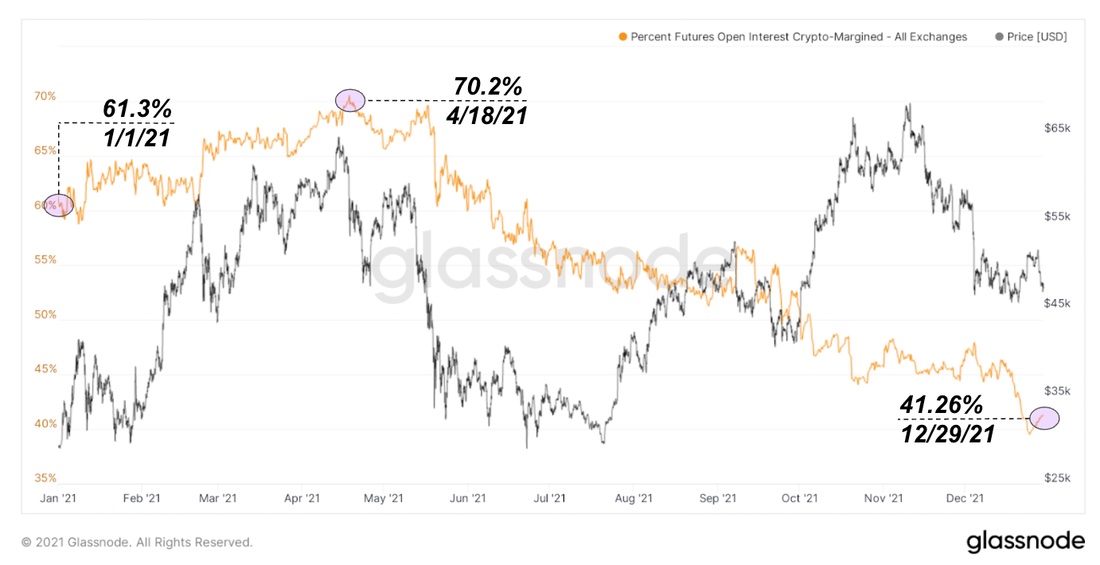
Share of futures with BTC margin in total open interest on Bitcoin perpetual swaps
This comes amid explosive growth in the stablecoin ecosystem, with a combined supply of $145.8 billion at the end of the year.
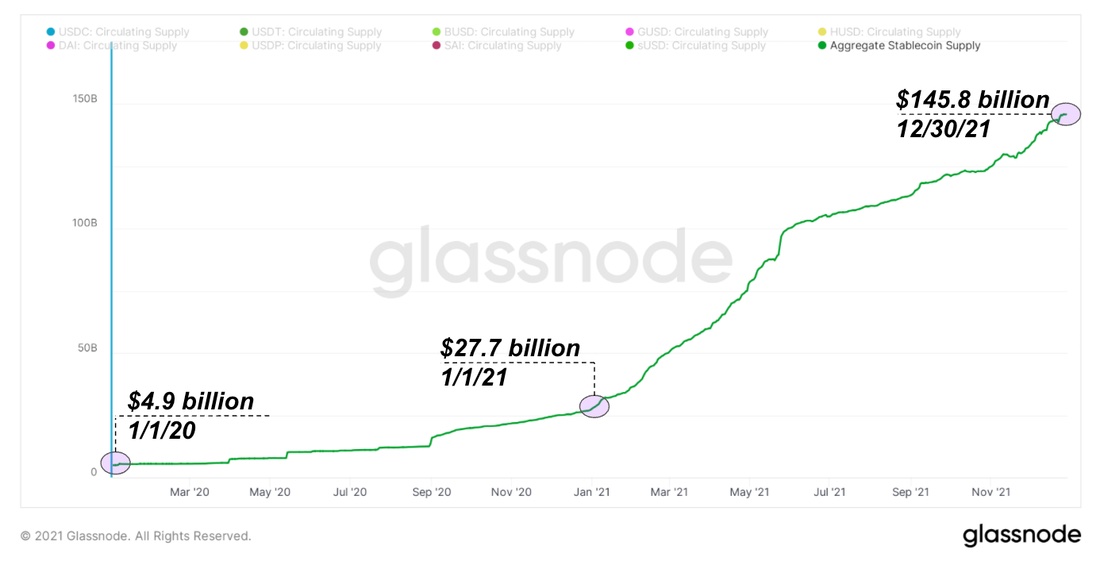
Aggregate stablecoin supply
Finally, it would be unfair to ignorehuge increase in the circulating supply of Wrapped Bitcoin (WBTC) on Ethereum, increasing over the past year from 115 thousand to 258 thousand, compared to just 589 WBTC at the beginning of 2020.
WBTC allows traders to use Bitcoin as collateral and collateral on the Ethereum network, which comes with its own set of trade-offs regarding counterparty security and risk.
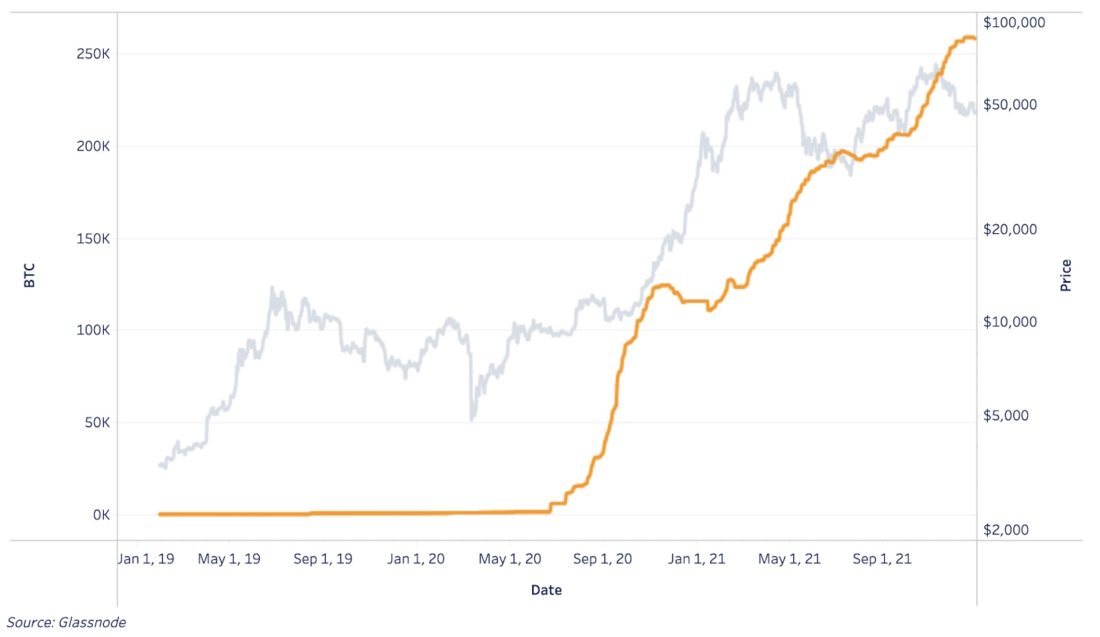
WBTC circulating offer
In general, the prevalence of bitcoin as a collateral asset on crypto exchanges, in other cryptoasset networks and in the traditional financial system can be expected to continue to grow.
Bitcoin mining
We have already spoken more than once about the importance of the events of thisyears for the bitcoin mining industry: with a solid recovery of hashrate after the mining ban in China, increased profitability of miners and as a result of the general growth of the industry, as evidenced by the increase in the number of public mining companies, 2021 will be historic for it.
Bitcoin mining this year generated$16.6 billion in profit, more than the last three years' revenue combined. This means Bitcoin miners now earn a total of $45.83 million per day, up 57.38% from the start of the year.
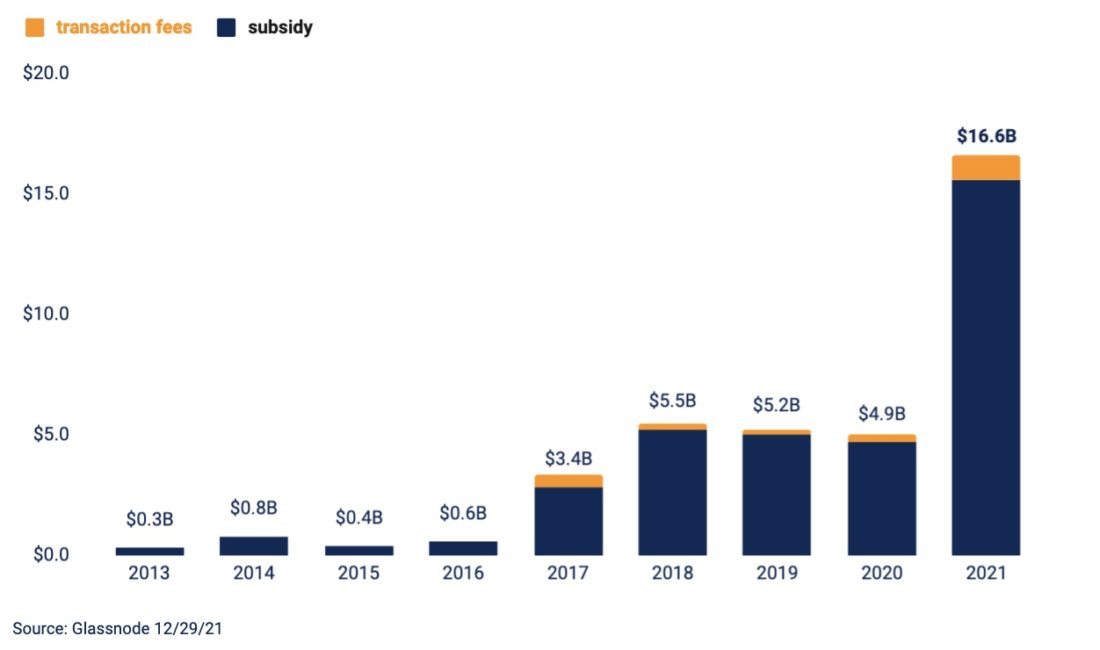
Bitcoin miners' annual income (in billions of dollars)
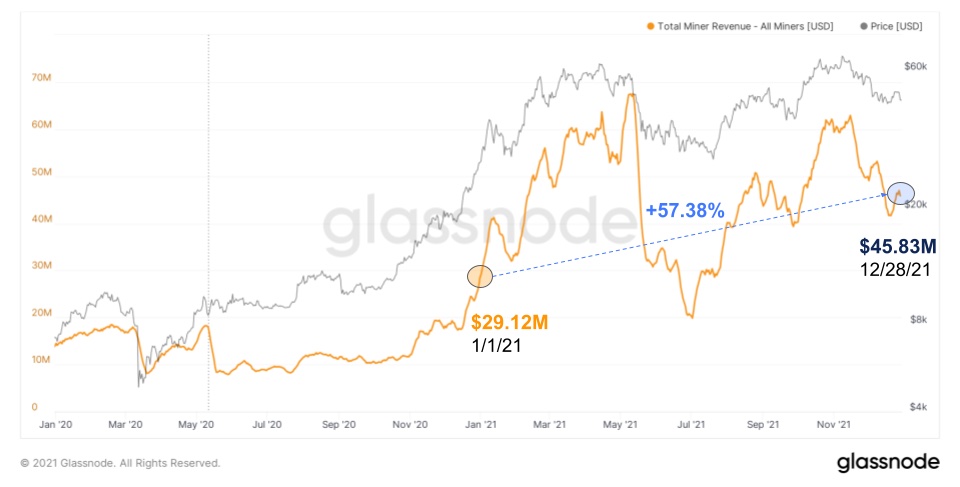
Bitcoin Miners' Cumulative Income (7d MA)
As for the network hash rate, at the macro levelChinese bans had little impact on long-term trends, as the hash rate increased by another 21.82% year-on-year. In December, the hash rate even set a new all-time high (182.02 EH / s) before reacting to another upward adjustment in difficulty. Mining difficulty has grown by 30.49% over the past year and is now only slightly below the May peaks.
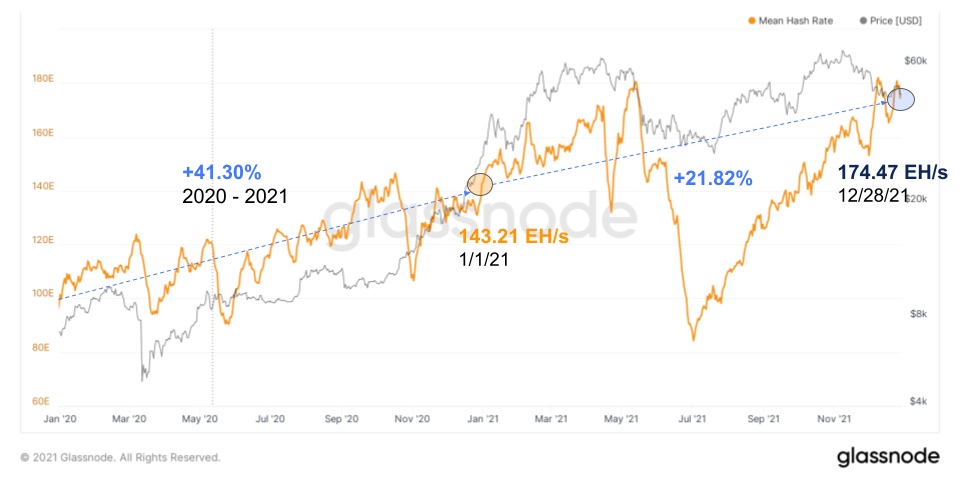
Bitcoin Hashrate (7d MA)
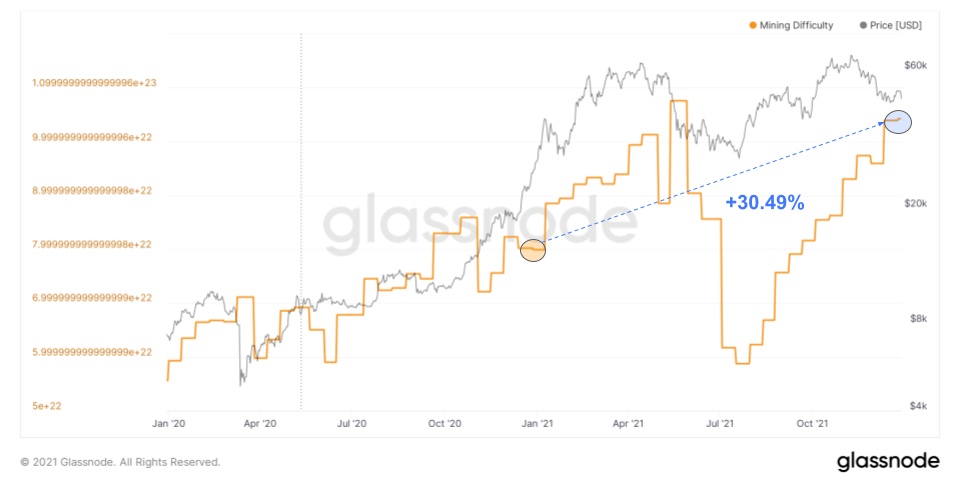
The difficulty of mining Bitcoin
Despite the decrease from the maximum values,the surprise this year was the growth and the stable finding of the hash price above $ 0.20. The increase in hash rate does not keep pace with the rise in the price of BTC, as a result of which each existing hash brings more income in USD to existing miners. With marginal costs remaining largely the same or even decreasing over time, mining profitability is at a three-year high.
As a result, market participants soughtprovide as much additional hashrate as possible by any available means. Virtually every quarter this year has been accompanied by a new announcement from leading public miners to increase hash rates, often in the form of loans secured by held bitcoins.
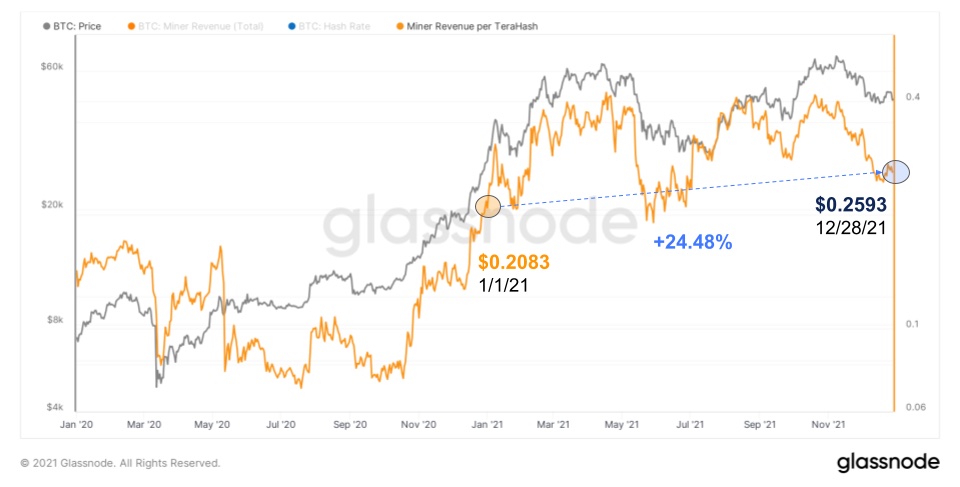
Bitcoin mining profitability (in USD) on terahesh
Finally
2021 was a watershed year in terms of adoptionbitcoin: for the first time the state (El Salvador) recognized it as legal tender and many large organizations, who had previously treated it with skepticism, began to come to this market. Bitcoin also faced the toughest stress test since the fork wars in 2017 in the form of a sudden mining ban in China, and the network has dealt with the blow very confidently. This stability, shown in conditions when one of the main powers of the world prohibits mining on its territory, where, according to estimates, more than 50% of the network hashrate was concentrated, should not be underestimated.
Bitcoin is the strongest, safest and mosta liquid digital asset in the world, and its spread across the global financial landscape, in both developed and developing countries, should continue in the coming years.
BitNews disclaim responsibility for anyinvestment recommendations that may be contained in this article. All the opinions expressed express exclusively the personal opinions of the author and the respondents. Any actions related to investments and trading on crypto markets involve the risk of losing the invested funds. Based on the data provided, you make investment decisions in a balanced, responsible manner and at your own risk.
Read this:
 November Bitcoin Market Report – Bigger, Longer & Uncut
 October Bitcoin Market Report - bigger, longer & uncut
 Big September Bitcoin Market Review - bigger, longer & uncut
 BITCOIN will be 318 thousand in 2021 !!!
 Bitcoin miners earned over $ 15 billion in 2021
 Bobby Lee: “By the end of 2021, the Bitcoin exchange rate will exceed $ 39,900”