What you need to know about BTC and ETH price charts here and now.
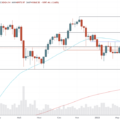
Daily chart
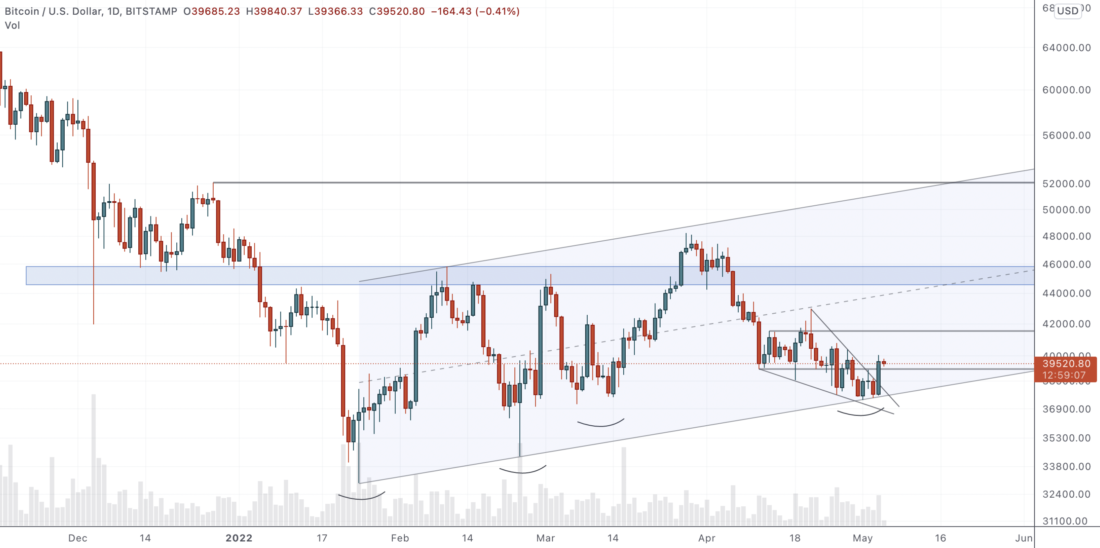
Great. We got inexactly the same movement and volatility asexpected, with a breakout of the falling wedge and resistance at $39,218. It appears that the price is ready to come back and test these levels as support, which would be a logical point for scalpers to enter longs. Bitcoin is still making large lows and a rebound from the lower boundary of the ascending channel “technically” allows us to expect to reach the target level at its upper boundary.
But, again, this is all speculation. Charts are just ideas.
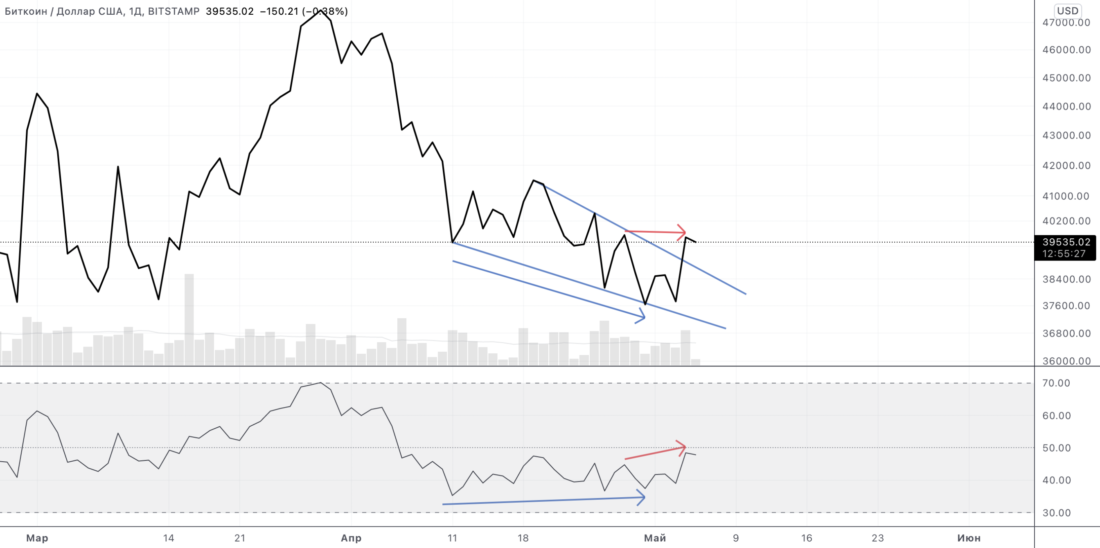
Time to pay attention to it. Bitcoin is forming a potential hidden bearish divergence which, if confirmed, will invalidate the bullish and signal further declines.
However, there is no confirmation yet.At the time of writing, even its existence is too early to state. To confirm the signal, it is necessary that the price closes lower, accompanied by a pronounced decrease in RSI. It makes sense to pay attention to this, nothing more. Also, hidden divergences are usually a comparatively weaker signal.
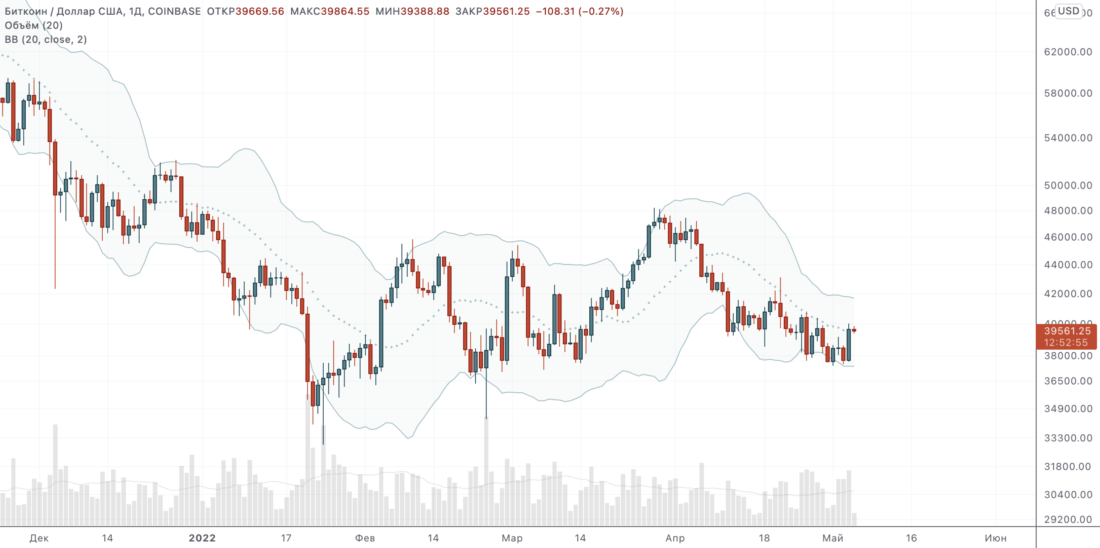
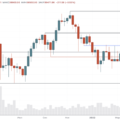
Bollinger Bands, Bollinger Bands remaincomparatively narrow, even after the volatility of recent days. Most notably, the price finally broke above the middle line of the indicator, below which it had been trading for a month. Now the price is testing this level as a support. In case of a successful test, the next stop should be the upper boundary area.
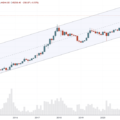
ETH / BTC
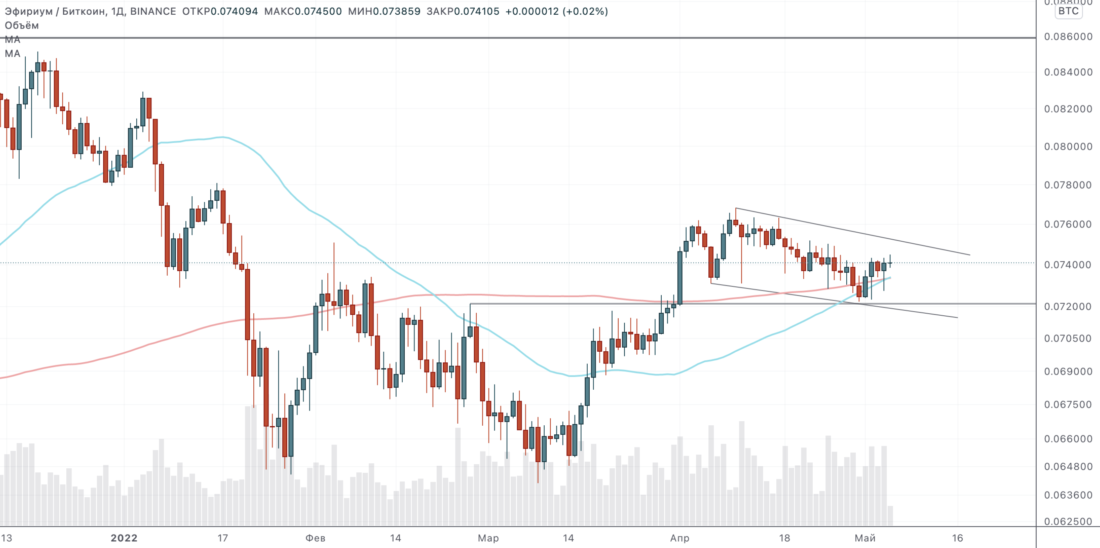
I keep following the ETH/BTC chart in searchhints and signal for the entire altcoin market. As you can see, the price is still in a falling wedge, which should break out at some point. Simple signal lovers can also note the golden cross of the 50- and 200-day MAs when a short moving average crosses upwards over a longer one. In my opinion, this is generally a lagging indicator as moving averages are the result of past price action. However, when the price interacts with the lines in the crossover area, you can usually see a strong reaction to the corresponding level, as in this case. The safest entry point here, in my opinion, is a breakout of the upper descending blue line.
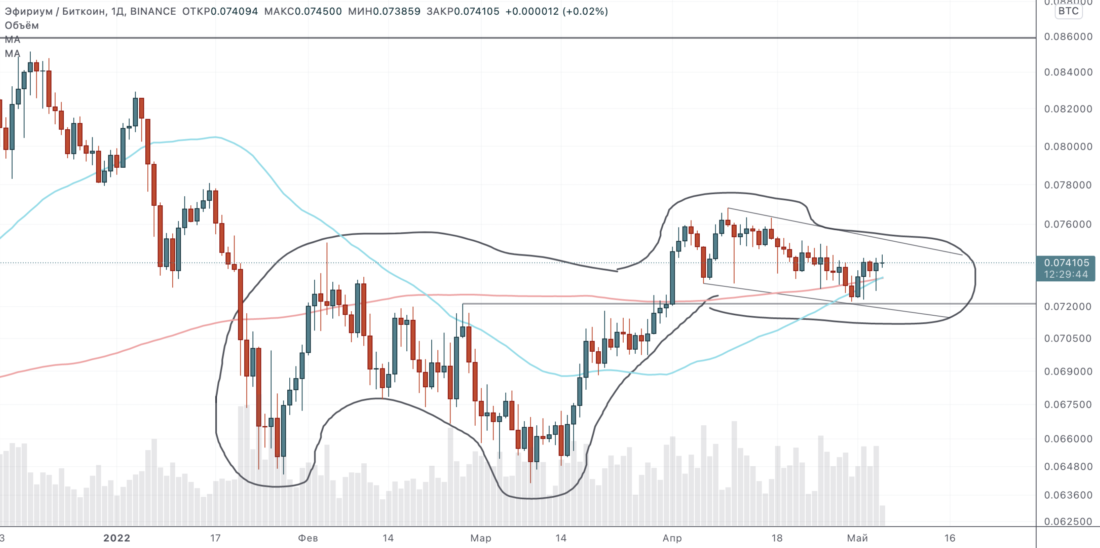
One can also state the formation of the famous brontosaurus pattern. Of course, this is a joke, but in fact, if you look closely, it can be seen all the time.
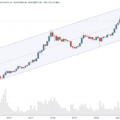
ETH / USD
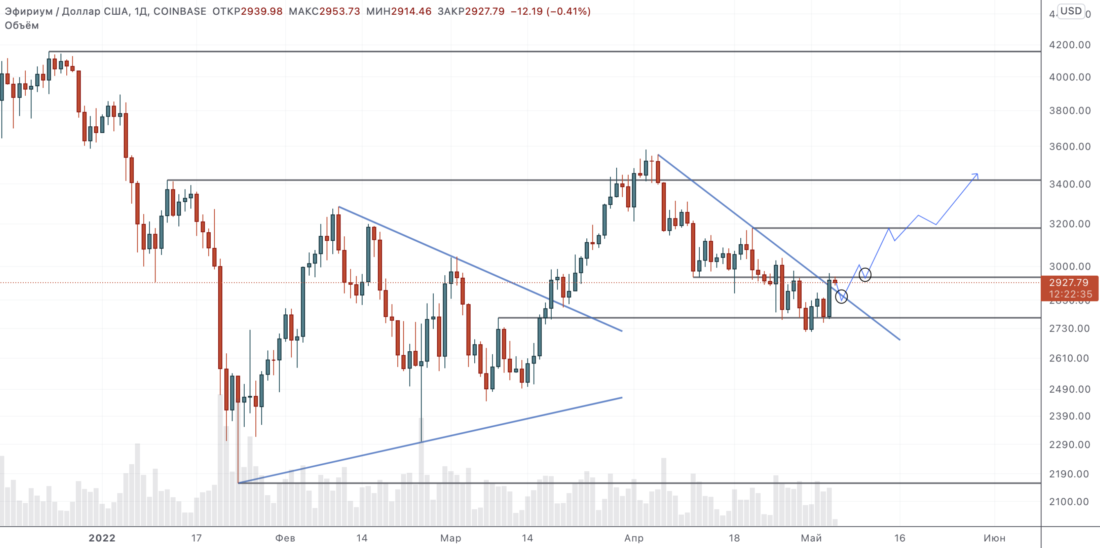
ETH/USD has broken through the downward resistance and nowran into the resistance of $2950. The safest (although nothing is guaranteed) entry points here, in my opinion, is a retest of the downlink as support, or a retest as support of $2950 after a close above this level. The trajectory outlined on the chart is an ideal scenario, but I am completely unsure of its implementation, unless the entire market as a whole unfolds.
BitNews disclaim responsibility for anyinvestment recommendations that may be contained in this article. All the opinions expressed express exclusively the personal opinions of the author and the respondents. Any actions related to investments and trading on crypto markets involve the risk of losing the invested funds. Based on the data provided, you make investment decisions in a balanced, responsible manner and at your own risk.
Based on source
Read this:
 Technical analysis from February 4, 2022
 Bitcoin at Key Resistance – Tech Analysis March 25, 2022
 Bad news - technical analysis from April 11, 2022
 There must be a rebound somewhere here - technical analysis of April 18, 2022
 Support retest, both expected and decisive - technical analysis of April 01, 2022
 It is difficult to seriously consider bearish scenarios - technical analysis of May 2, 2022