The current market structure, characterized by the divergence between price, on-chain activity, and dynamicssentences, reminiscent of the early stage of bullish momentum.
As bitcoin and the cryptocurrency market grows inIn general, on-chain data, for both Bitcoin and Ethereum, continues to form a noticeable divergence. On-chain activity on both blockchains remained fairly low compared to the highs of the bull market, despite rising prices and bullish supply trends. In today's report, we will try to better characterize this discrepancy by examining and comparing a number of on-chain metrics for Bitcoin and Ethereum.
Let's prepare the foundation
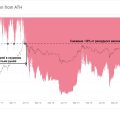
Before moving on to our comparativeAnalysis, let's take a quick look at the overall Bitcoin market situation after a month of strong price action. With price consolidating under $50K resistance and notable profit-taking, the market is now at the top of a very large on-chain volume cluster.
The chart below shows the price ranges inwhich last moved comparable volumes of BTC supply. Since hitting the previous cycle's all-time high of $20K, the market has formed three notable clusters of on-chain volume.
- $31-40 thousand.(price support), where more than ₿2.98 million was accumulated - both in January and during the recent more than two-month consolidation. Most likely, this is now a very strong support zone.
- $45-50 thousand.(current range) defining the zonebreakeven for 1.65 million bitcoins. Considering that the price is in the upper part of it, this cluster, apparently, can also serve as strong support for the price.
- $53.7-59 thousand.(trillion capitalization level), where in₿1.336 million was accumulated between March and May, still suffering unrealized losses. These coins, still unsold despite the 50%+ correction, could potentially form resistance if investors attempt to exit the market near breakeven.
In general, these data indicate that the marketthere remains a rather strong class of investors with a high degree of confidence in the potential for further growth, which can be regarded as a powerful signal for the bulls.
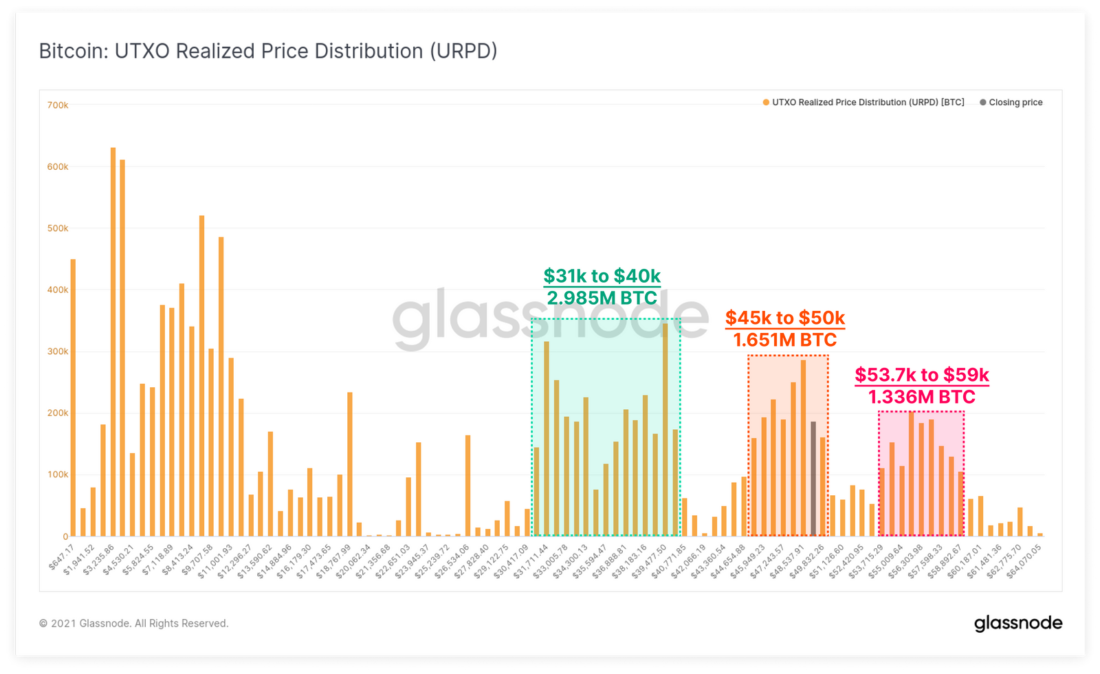
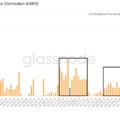
URPD (UTXO Realized Price Distribution) (link to updated source)
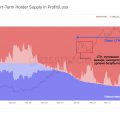
In this context, profit-taking took place inthroughout August, as prices rise. This indirectly indicates the strength of the market to absorb this supply of "coins". The aSOPR (Adjusted Exit Spend Profitability Ratio) metric shows that similar behavior was observed after the March 2020 sell-off with the following sequence of events:
- Surrenderwhen sellers recorded losses in panic for a long period of time.
- Returning profitability, as evidenced by the recovery andkeeping aSOPR above 1.0. This suggests that profit-taking is taking place, but the current market strength is sufficient to absorb this selling pressure.
- Bringing Back Confidence:aSOPR value is reset to 1.0 several timesand bounces higher from this level, indicating that owners of profitable coins are choosing to remain idle while investors buy on the decline.
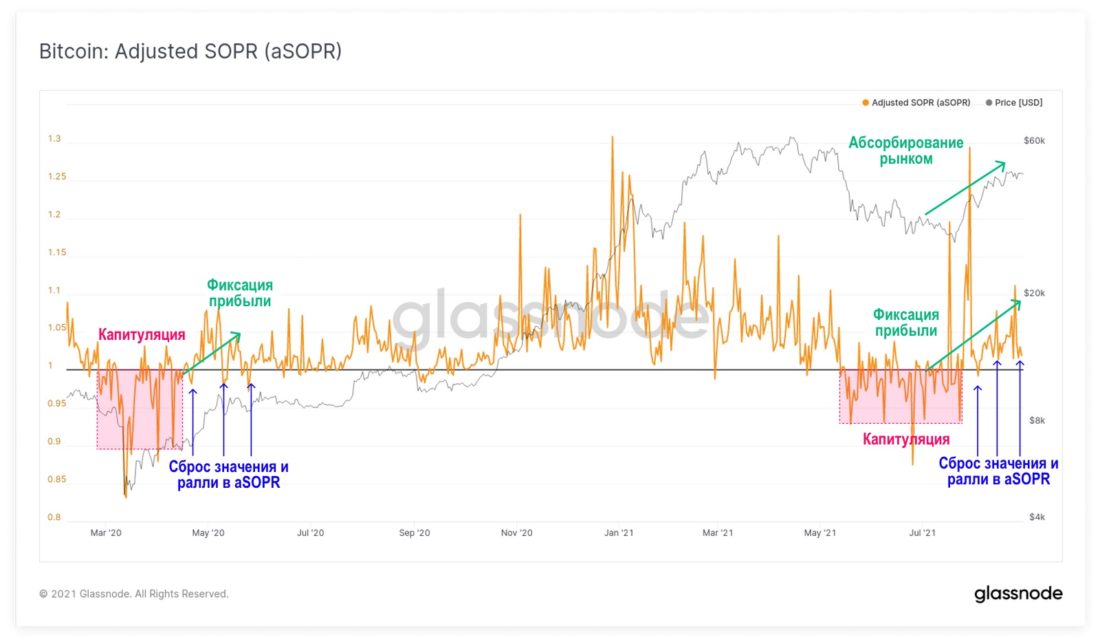
aSOPR for Bitcoin (link to updatable source)
Divergence in on-chain activity
Between the price rally and the dynamics of on-chain activityan impressive discrepancy remains. Block space demand in both Bitcoin and Ethereum remains well below recent peaks, despite a significant rebound in prices to relatively high levels.
The number of active users of the Bitcoin network today is 275 thousand per day, which is about 35% lower than the January peak.
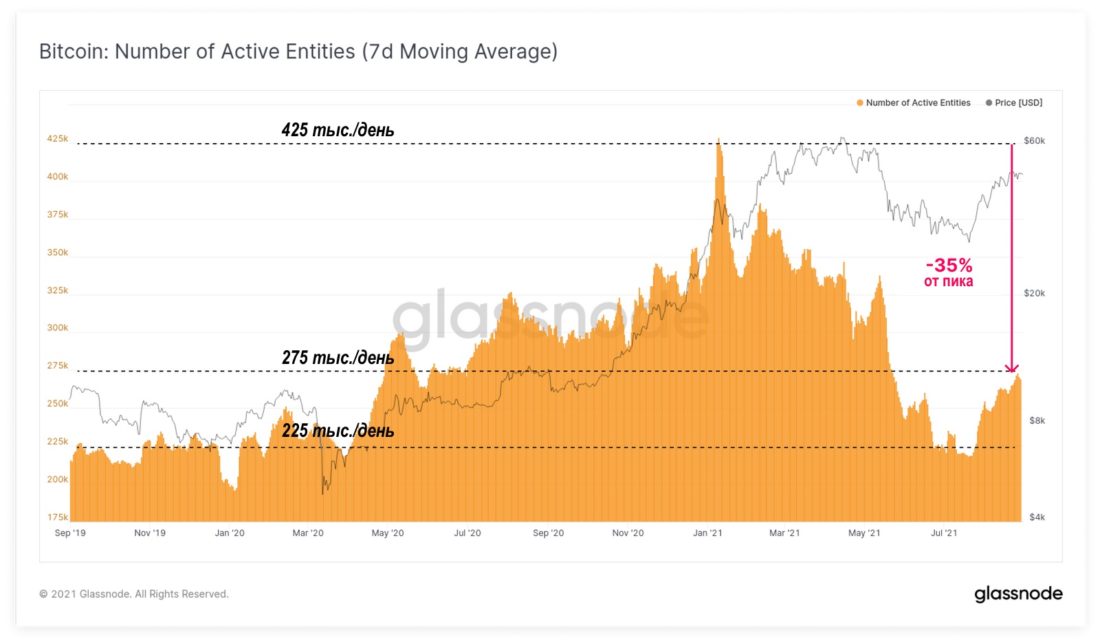
The number of active entities of the Bitcoin network (7d MA) (link to updated source)
The number of active addresses in Ethereum has also decreasedup 33% from the May peak and currently stands at 450 thousand per day. Notably, the current activity on both blockchains is similar to that seen in the stable bullish accumulation range in the mid to second half of 2020.
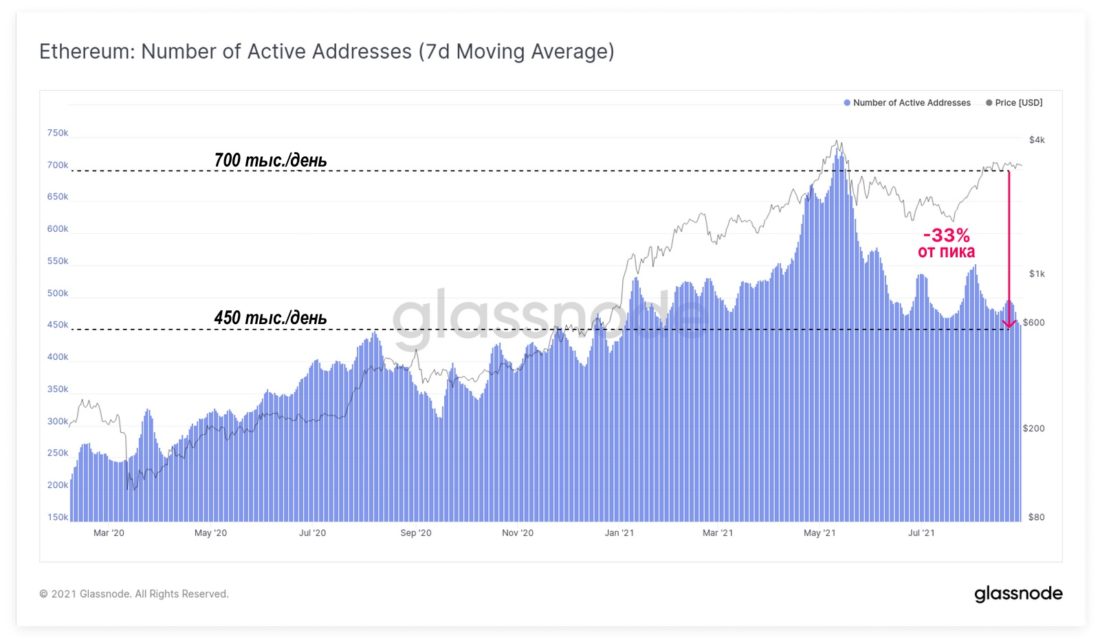
The number of active addresses in Ethereum (7d MA) (link to updated source)
Similar observations can be made inin relation to the number of transactions, a proxy for the demand for block space. The number of Bitcoin transactions has dropped to about 200 thousand per day, down 37.5% from its peak.
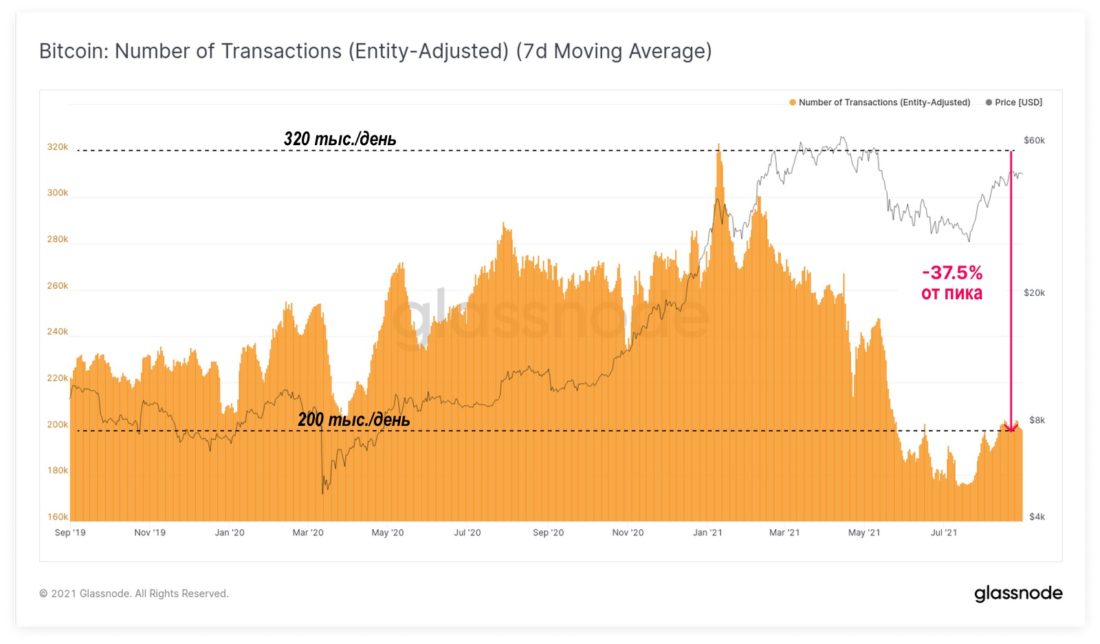
Number of Bitcoin transactions adjusted by user (7d MA) (link to updated source)
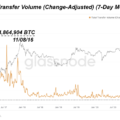
An even more dramatic decline can be seen inthe volume of on-chain transactions in dollar terms, which decreased by 62.5% from April highs: to $6 billion per day. Note that for both the number of transactions (above) and the dollar volume (below), we use user-adjusted data that filters out internal transfers between addresses of the same network entity. That is, these data reflect the size of the economically significant volume.
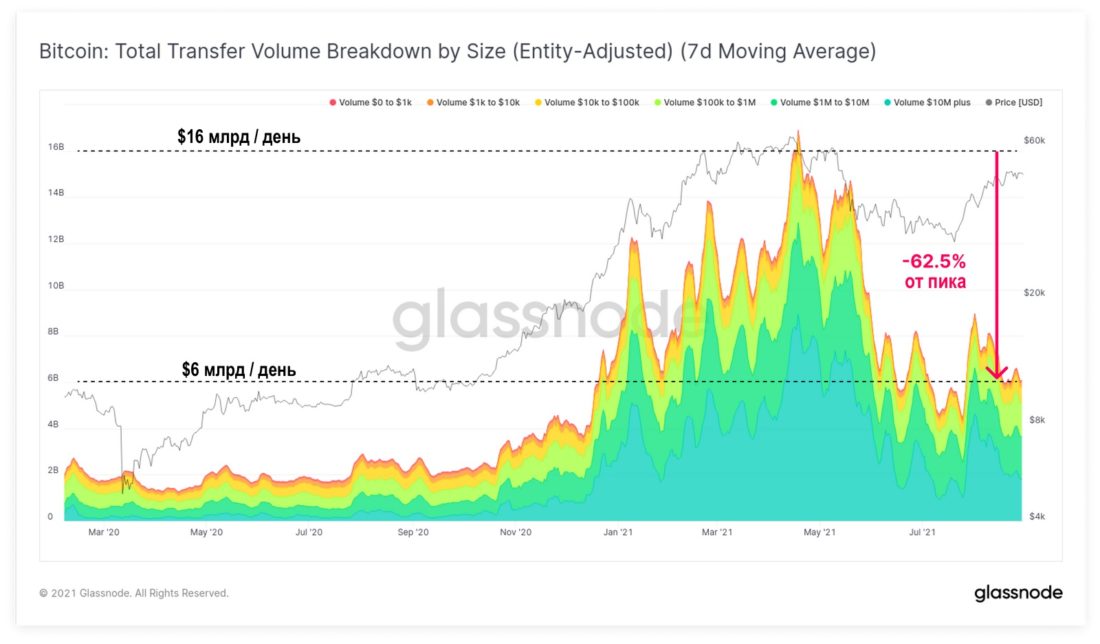
Total volume of transactions by size, adjusted for users (7d MA) (link to updated source)
As a result of such low demand for space inblock, transaction fees on the Bitcoin network have dropped significantly, returning to levels we haven't seen in over a year. Today, an average of 21 BTC/day is collected in transaction fees, which is only 1-2% of the total block reward.
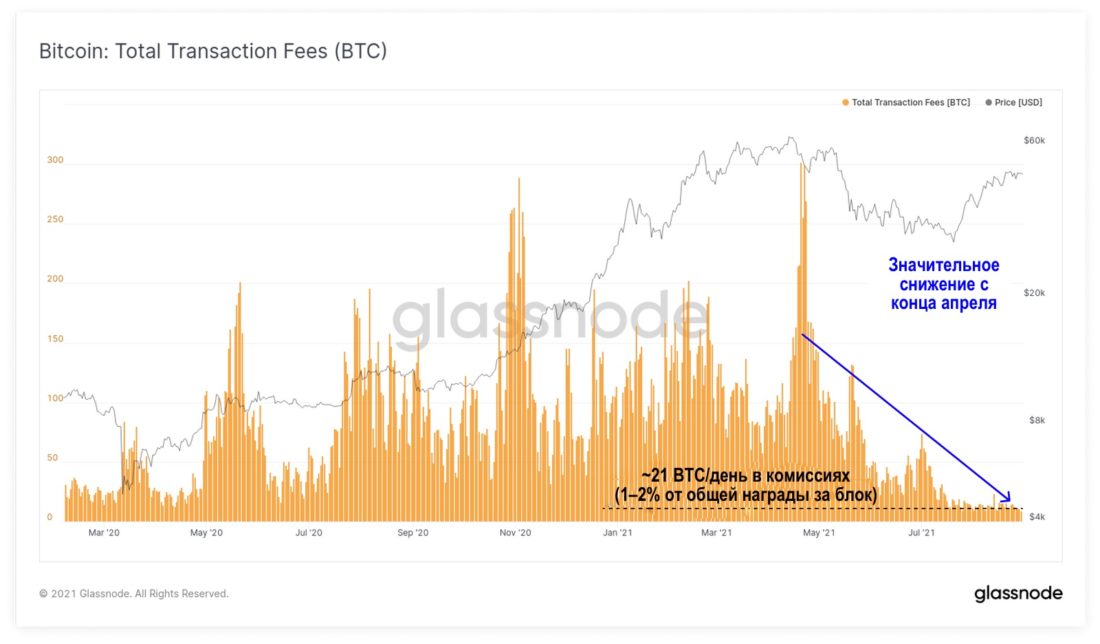
Bitcoin on-chain transaction fees (link to updated source)
On Ethereum, too, the number of transactions is down 33% from its peak, with numbers dropping by about 1.1 million per day in the last week.
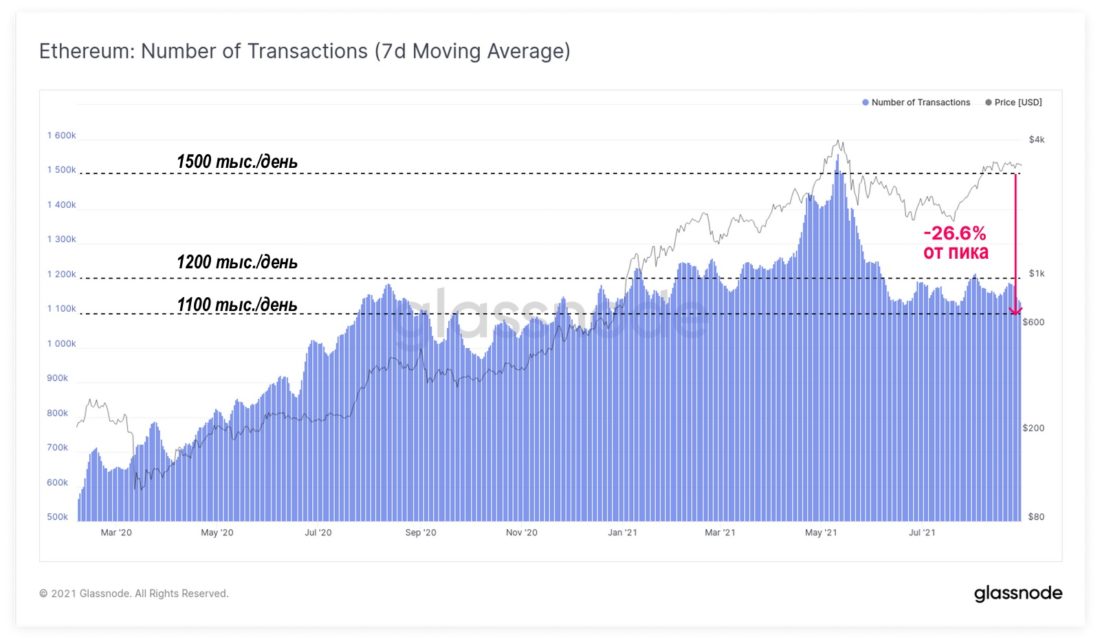
The number of on-chain transactions in Ethereum (7d MA) (link to updated source)
Interestingly, the Ethereum ecosystem has seenquite a strong discrepancy between the change in the number of on-chain transactions and the fees for them. Despite the decrease in the number of transactions and the number of active addresses, the amount of paid commissions has grown significantly lately. This is most likely due at least in part to the high demand for trading and investing in NFTs.
The total amount of fees charged on Ethereum today is around 10K ETH/day, a fairly high level comparable to the “DeFi summer” and the 2021 bull rally.
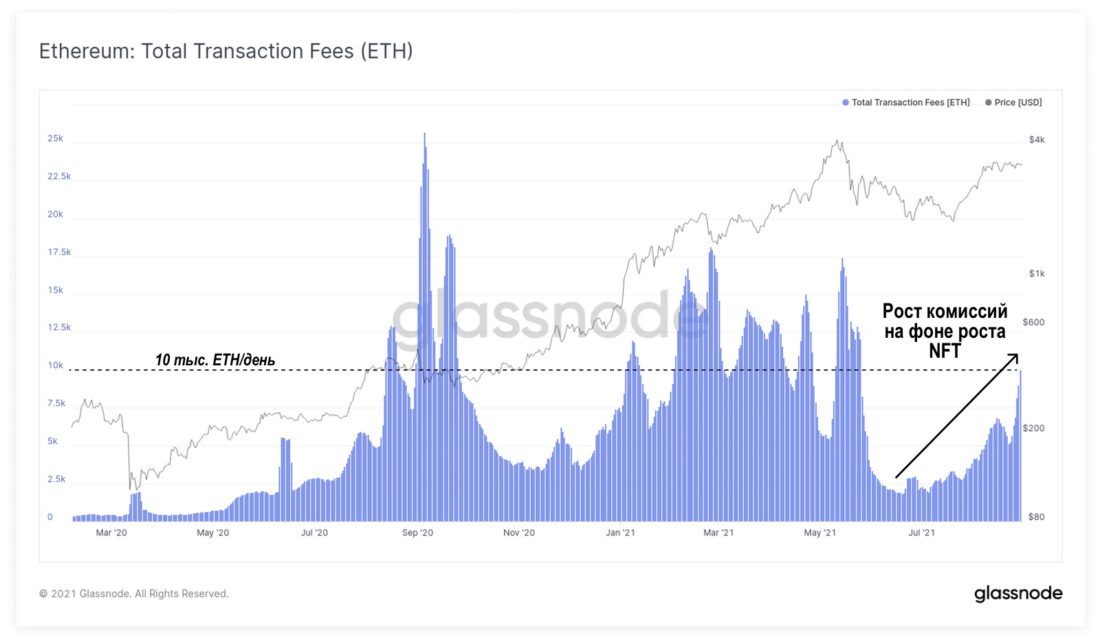
The total amount of fees collected for on-chain transactions in Ethereum (link to updated source)
However, the market's increased focus on NFT has its ownprice, and DeFi tokens were the losers in this equation. The chart below shows on-chain transaction data for the four blue-chip DeFi markets, AAVE, COMP, UNI and YFI tokens. The top row shows graphs of the number of active addresses interacting with tokens, and the bottom row shows the total dollar value of transactions in the corresponding tokens.
In all directions, the picture is gloomy:in all four tokens, one can state a structural decline in investor attention; for the most part, these indicators form new smaller minimums.
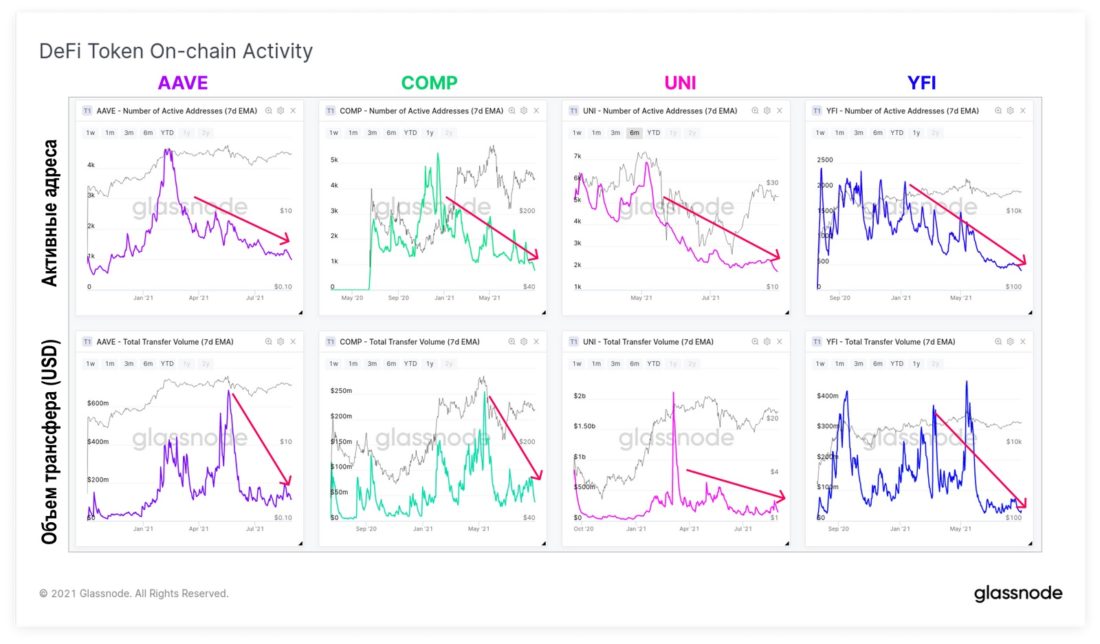
DeFi token metrics (link to updated source)
Bullish supply dynamics
Is this divergence between price andon-chain bullish or bearish activity is a tricky issue as more digital asset trading spills over to off-chain exchanges and derivatives. In addition, advances in technology solutions - batching transactions, the adoption of SegWit, and an increase in the use of the Lightning Network and other second layer protocols - make this task dynamic.
On the other hand, the dynamics of supply changes,especially taking into account the “maturation” of coins, it gives a fairly reliable signal in any direction. While watching accumulation and hodling is typically a "long range" indicator (i.e., the signal takes time to work out), the current market trend is historically strong for bulls.
The following charts show a number of indicatorssupply dynamics for Bitcoin and Ethereum. When looking at them, it is obvious that there are similarities between the values of these metrics for both blockchains and in both cases they look very constructive.
Coins with an age of less than 3 are considered "young"months. They are most likely to be spent in the event of downward volatility. The decline in the share of young coins in HODL waves indicates that the market, on average, prefers to hold assets rather than spend them. Young BTC make up only 15% of the circulating supply and there is a very strong downtrend in this indicator.
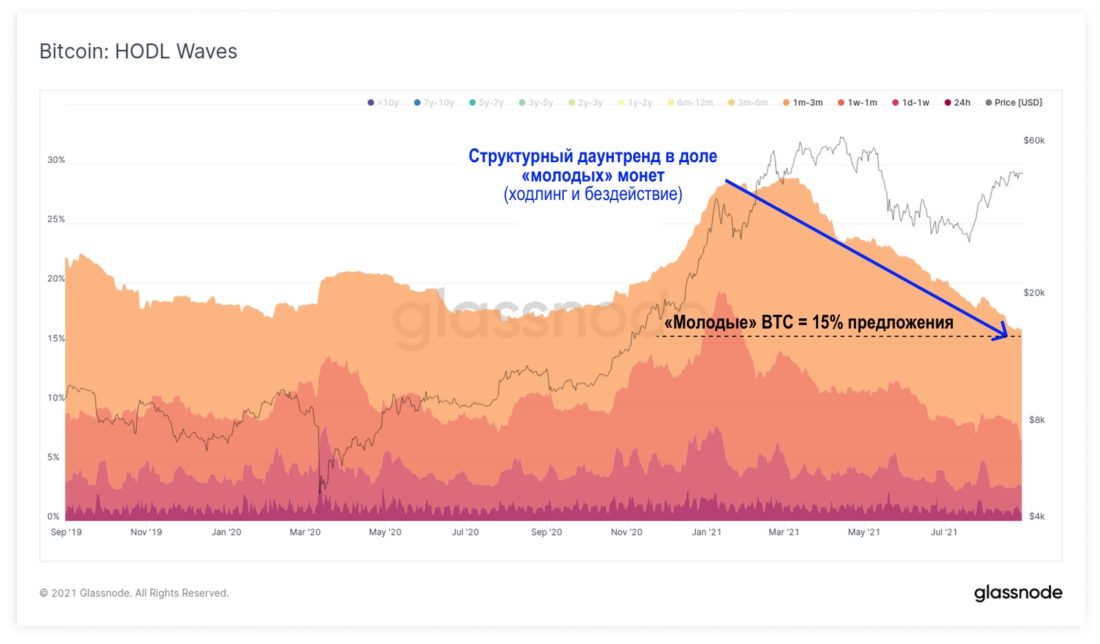
HODL waves for Bitcoin (link to updated source)
The HODL wave chart for Ethereum looks almost identical, with the share of young coins dropping to a long-term low of 12.5% of circulating supply.
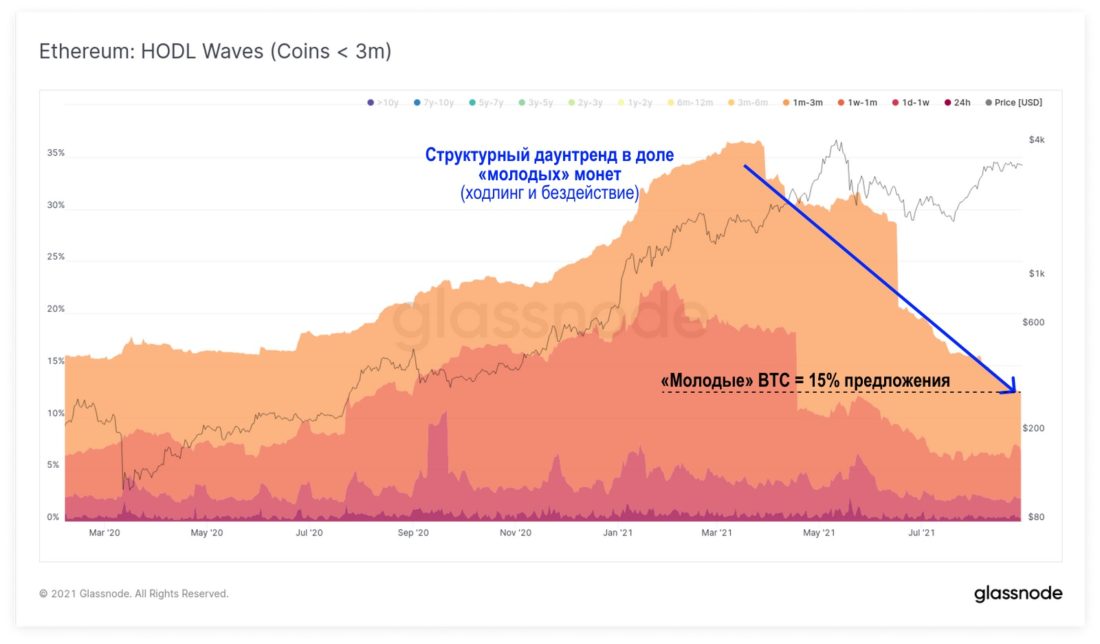
HODL waves for Ethereum (coins under 3 months old) (link to updated source)
As these young coins mature and agemove into the category of middle aged (3 months - 1 year) and old (more than 1 year) coins. More mature coins are less statistically likely to be spent, and an increase in the share of such coins implies an increase in illiquid supply.
Bitcoin has seen a strong upward trend in coin maturation, with nearly 50% of the circulating supply being “aged” between 3 months and 3 years.
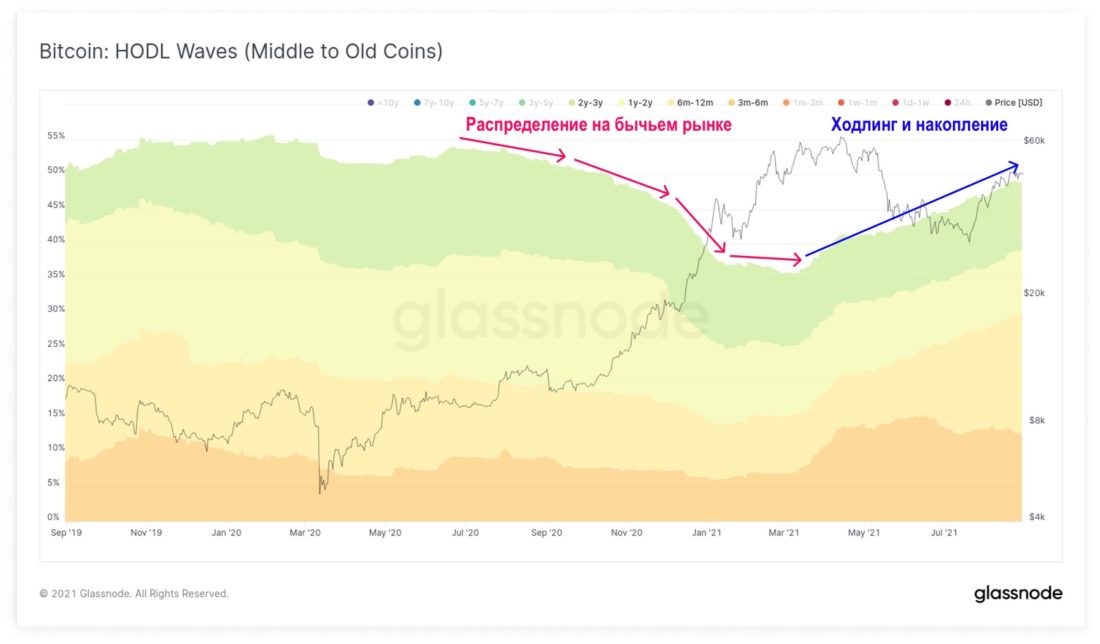
HODL waves for Bitcoin (middle age and old coins) (link to updated source)
Again, the Ethereum proposal showsa similar trend: a whopping 70% of ETH supply is stagnant for at least 3 months. For both assets, these uptrends start sometime in March of this year and therefore reflect strong buy and hold demand in the current bull market.
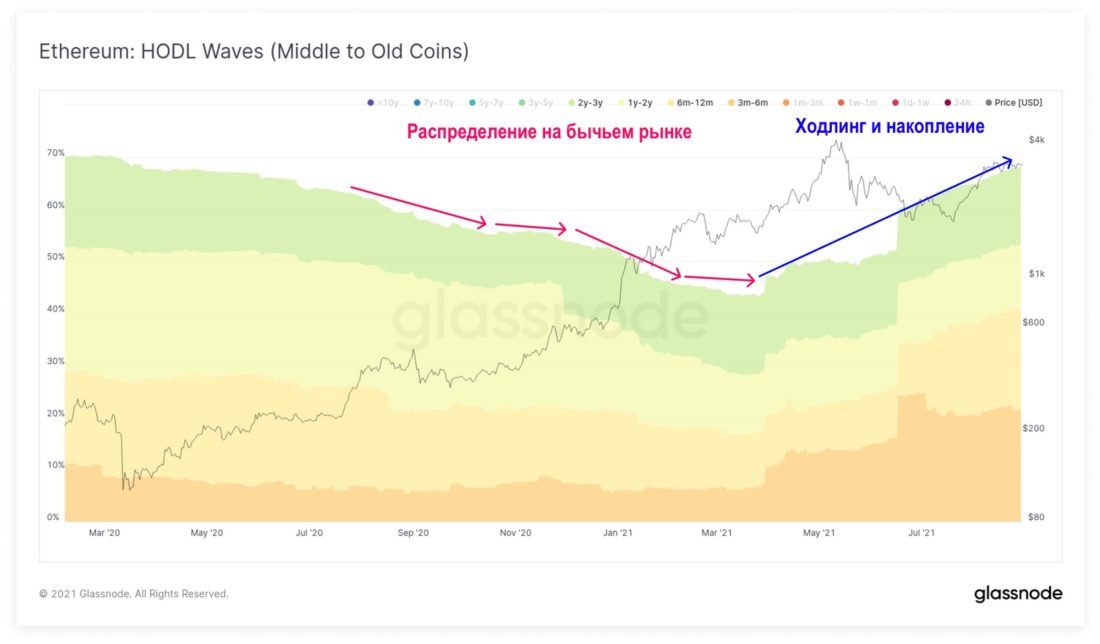
HODL waves for Ethereum (middle age and old coins) (link to updated source)
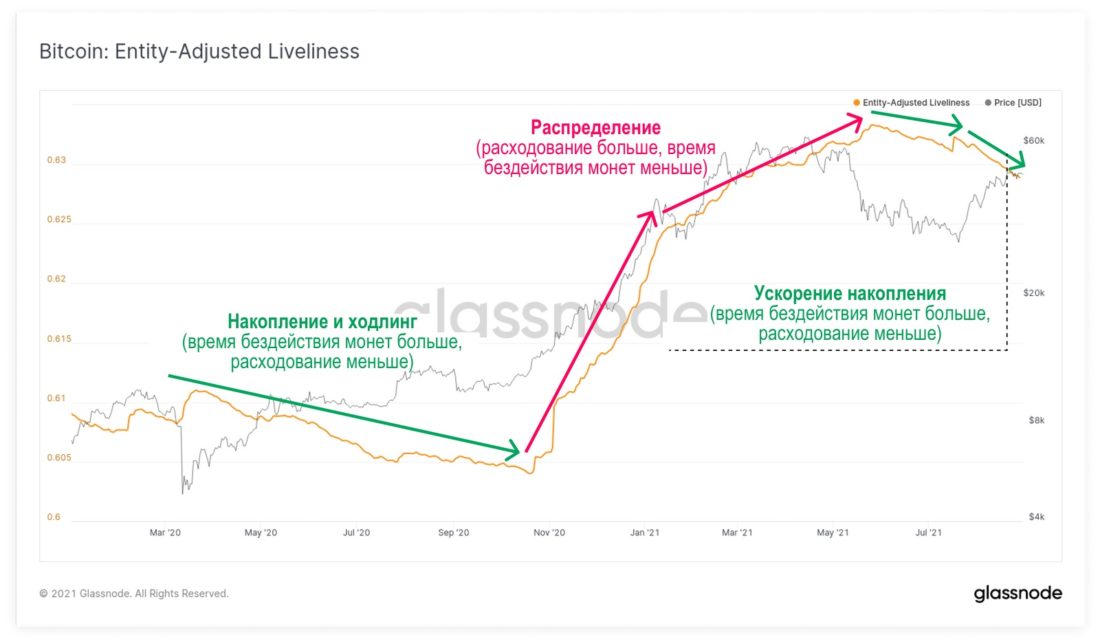
Highlighting this change in market behavior, and inIn line with the lack of willingness among long-term investors to spend their coins, the Liveliness metric for both blockchains has moved into a very strong downtrend. Let us briefly recall what this metric is (you can read more details here):
- Livelinessis calculated as the ratio of the sum of coin-days destroyed (when spent) to the sum of all coin-days accumulated (hodling) at a given moment.
- A downtrend in a metric indicates an accumulationwhen there is an increase in dormancy and maturation of coins and their consumption is reduced.
- An uptrend in the metric indicates a high level of spendingwhen old coins are moved, the accumulated coin-days (idle time) are destroyed and distribution occurs.
- Cooler trendsin the metrics indicate greater strength of the fundamental trends described above.
Bitcoin's liveliness has once again entered a downtrend that accelerated during this price rally.
Liveliness Bitcoin, adjusted for users (link to updated source)
For Ethereum, the "liveliness" indicator draws inmuch the same picture, moving into a strong downtrend after the May sale. Given that today the huge volume of transactions in ETH is somehow related to NFT, this indicates that most of this volume is accounted for by the same tokens changing hands.
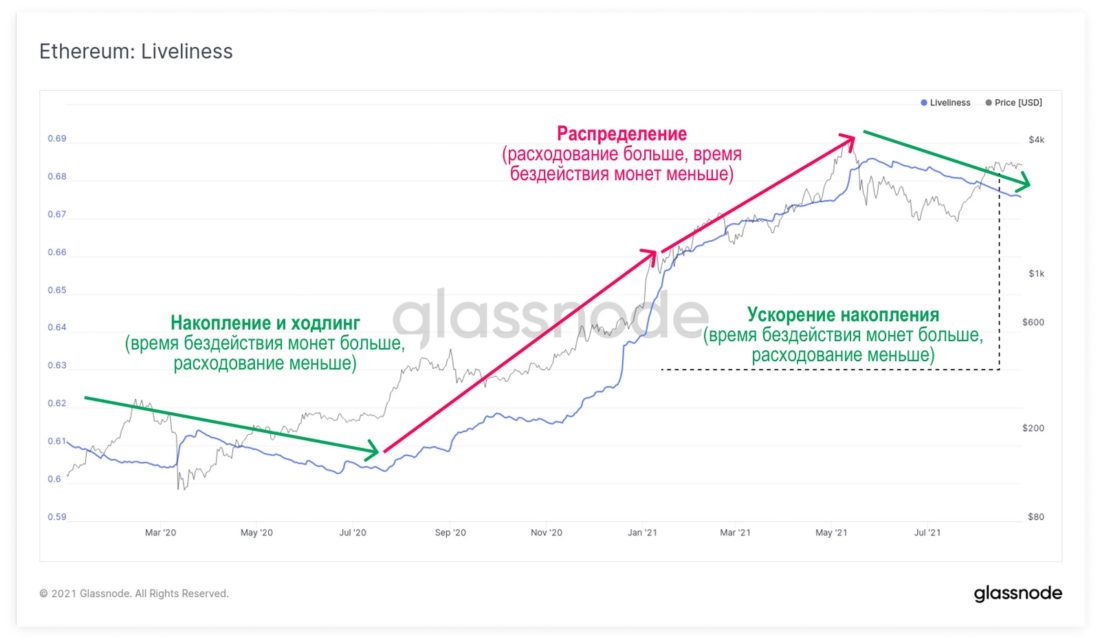
Liveliness for Ethereum (link to updatable source)
Finally, a good indicator of the level of adoption isaccumulation and hodling is the growth of non-zero balances. In Bitcoin, the number of addresses with non-zero balances continues to rise, once again reaching over 38 million, and appears poised to set new all-time highs.
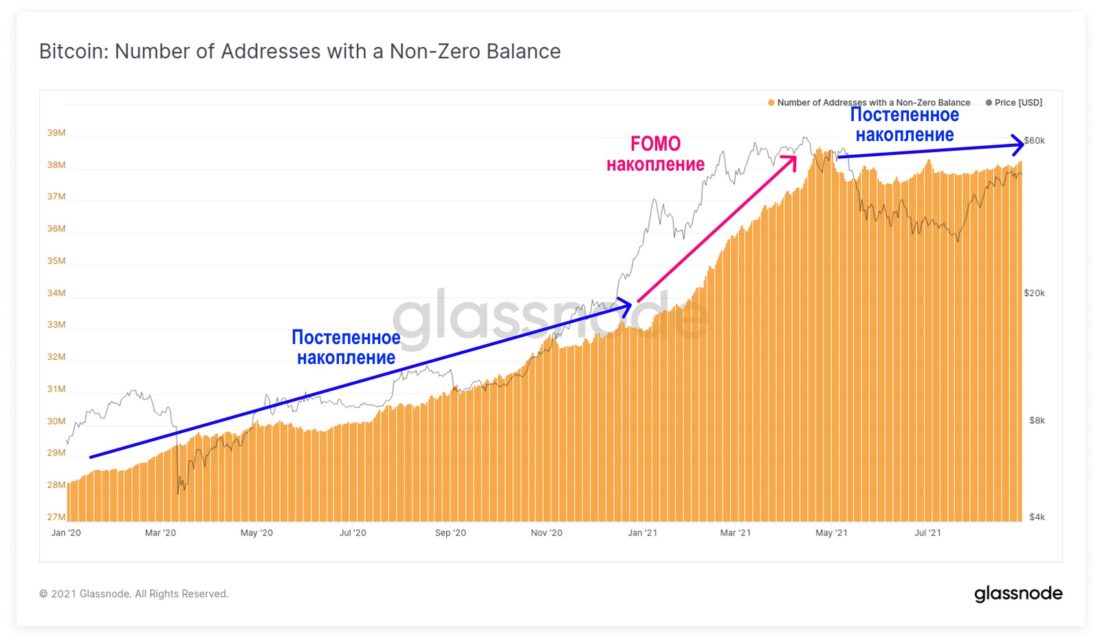
Number of Bitcoin addresses with non-zero balance (link to updatable source)
Like Bitcoin, the number of non-zero balances on Ethereum has also increased dramatically, setting a new all-time high of 60.7 million addresses.
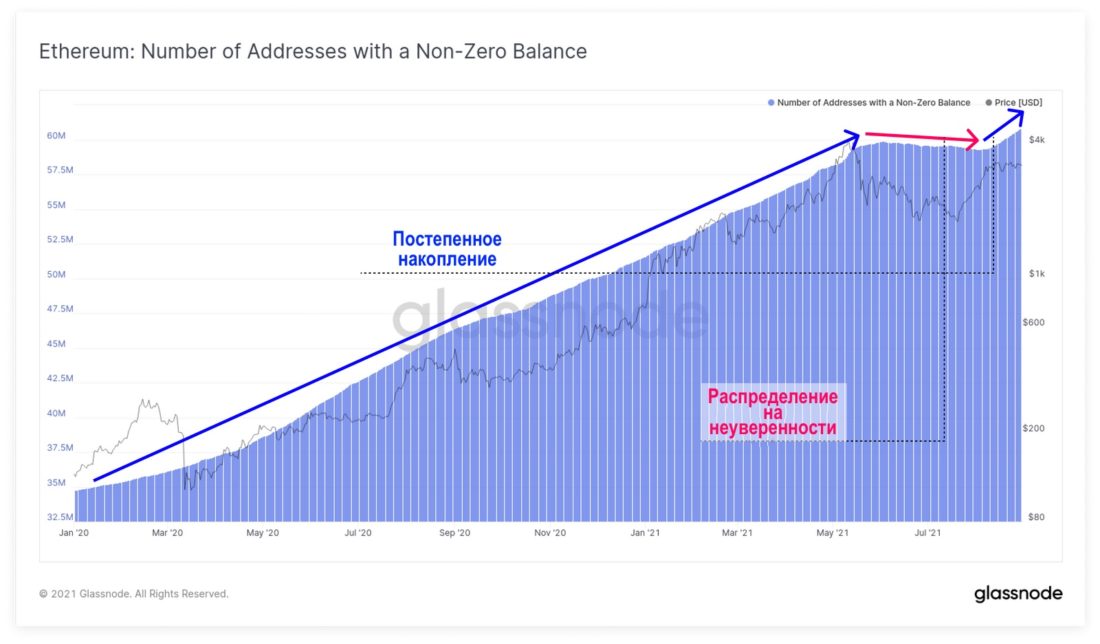
Number of ETH addresses with non-zero balance (link to updated source)
Although such a discrepancy between price and levelOn-chain activity is not historically characteristic of a full-blown bull market, it is not uncommon for the phase before the onset of the bull market and the periods before the supply contraction. Such periods often accompany accumulation after the end of a bear market, when the remaining investors are the strongest hands that are most confident.
The supply dynamics seem to indicatethe presence of extremely strong demand and this should remain a very constructive factor for prices if the trend continues. On the contrary, aggressive spending of older coins would be an important reversal signal for the bullish trend to watch out for.
BitNews disclaim responsibility forany investment advice that this article may contain. All the opinions expressed express exclusively the personal opinions of the author and respondents. Any actions related to investments and trading on crypto markets involve the risk of losing the invested funds. Based on the data provided, you make investment decisions in a balanced, responsible manner and at your own risk.
</p>
Read this:
 Onchain Pulse | May 11, 2021
 Onchain Pulse | 04 May 2021
 Let's measure the correction parameters: on-chain pulse | May 18, 2021
 Bitcoin On-Chain Transfer Volumes at Five-Year Low
 Approaching Pain Threshold: On-Chain Pulse | June 1, 2021
 How China's Tough Measures Affect Bitcoin's On-Chain Performance