He talks about further possible scenarios for the price movement of Bitcoin and several popular altcoins.RoboForex lead analyst Dmitry Gurkovsky.
</p>The market continued to move within the negativescenario and at the moment the best that can happen — This is a correction before the next wave of decline. For Bitcoin, a strong resistance area will be the lower boundary of the «Triangle» — Until it is broken, you should not expect an upward movement.
Ethereum and EOS, on the other hand, lookquite interesting for growth as part of the start of development of upward patterns on the daily charts. Important support levels for them have not yet been broken, which leaves a chance for an upward movement.
Litecoin and Bitcoin Cash may begin to decline as part of reversal models that have been formed for a long time, but the market did not dare to work out such patterns.
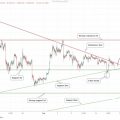
Bitcoin
The leading cryptocurrency was still able to leavelimits of the "Triangle" model, however, the breakdown took place downwards instead of the expected rebound and the beginning of growth. At the moment, the main option is to expect an attempt to further develop the model downwards.
The first target of the fall may be the lowerthe border of the rising channel at the level of $ 7030, after the breakdown of which the next support will be the area below $ 5720. A rebound from the resistance line on the RSI indicator speaks in favor of long-range downward movement. The indicator values broke through region 30, which indicates the presence of a strong bearish impulse. As a rule, a signal for growth should be considered only after a return above level 30.

BTC / USD, TradingView data
At the same time, we should not rule out attemptscorrection with a test of the broken border of the model, and only after that — continued development of the downward movement. Cancellation of the downside option here could be a strong rise and a breakdown of the $10,995 level, which will indicate the return of strong buyers and a potential reversal in favor of the upward trend.
Technical analysis of smaller time periodsintervals also indicates the development of an imminent correction to the resistance level of $9190, where the lower boundary of the “Triangle” model is located. A correction is supported by a test of the support area on the RSI indicator, from which we saw a rebound earlier.

Most likely, the resistance level test will nota reversal for new growth, but will lead to a movement even lower — to the level of $7200. The cancellation of the negative scenario will be a strong growth and a breakdown of the upper boundary of the downward channel with quotes consolidating above the level of $9,800. Only in this case is it worth returning to the option of continuing the ascent. In the meantime, the leading asset remains under strong pressure from the bears.
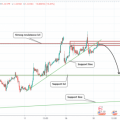
Ethereum
In the case of Ethereum, one should not excludethe likelihood of the formation of a bullish Wolfe Wave pattern, which will indicate the potential for continued growth to the level of $280.60. The lower boundary of this model remained unbroken, which means — There are still chances for a rebound and upward movement. Such a rise may be supported by a test of the rising trend line on the RSI. Previously, we have already observed a rebound in asset prices from the level of $170 to $225. Cancellation of the positive option on the daily chart will be a breakdown of the $125 level. In this case, the target for the decline may be the $75 area.

ETH / USD, TradingView data
On the 4-hour chart, quotes are also onlytesting the support area and the broken border of the «Wedge» pattern. One should not rule out an attempt to grow the cryptocurrency from current levels. An additional signal in favor of such a movement is a rebound from the support line on the RSI. Confirmation of the rise here will be a breakdown of the resistance level and consolidation above $185.25. Cancellation of the growth option will be a strong fall and a breakdown of the $145 area. With this development of events, we should expect a continuation of the decline.

Litecoin
Litecoin quotes continued to move withinnegative variant with development of the «Head and Shoulder» model. As you can see, the asset has pushed off the resistance level and is currently testing the support area around $55.
It is possible that we can see a correction tothe broken border of the ascending channel and the continuation of the decline with a target at $ 40. However, a downward price structure around the $ 80 level potentially indicates a probable fall to $ 21.85.

LTC / USD, TradingView data
The decline scenario will be canceled by a stronggrowth and breakdown of the $90 level, which will indicate that LTC/USD quotes are consolidating above the upper boundary of the Cloud of the Ichimoku Kinko Hyo indicator. In this case, we should expect a change in the trend in favor of an upward trend and a continuation of the rise to the first target at $125.65. Pressure from sellers on the rate of «digital silver» is currently maintained.
On the 4-hour chart, the asset quotes hitthe lower boundary of the downward channel. As long as buyers manage to stay higher, there is a high probability of a correction developing into the area of $65 — $70. Already from these levels we can expect a continued decline.

This option will be supported by the broken testtrend lines on RSI. However, if the bears manage to gain a foothold below the lower border of the channel, this will be a signal to sell towards targets in the range of $40 — $20, which can be reached very quickly.
The cancellation of this scenario will be a breakdown of the upper boundary of the downward channel and the consolidation of Litecoin above the level of $ 80, which will indicate a potential continuation of growth to the first target at the level of $ 107.
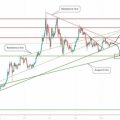
Eos
Movement structure on the EOS daily chartsame as Ethereum. We are observing the formation of an ascending "Wolfe Wave" pattern. Quotes tested the lower boundary of the model, which indicates a potential rebound and the beginning of an upward movement.
An additional signal in favor of such dynamicsstands and test the trend line on the RSI. The goal of the upturn during the development of the upward model is an area of about $ 5.40. Cancellation of this option may be a fall and a breakdown of the support level with fixing quotes below $ 2.

EOS / USD, TradingView data
On a 4-hour chart, quotes start fromsupport level, where the lower border of the downward channel is located. As a short-term trading idea, we should expect an attempt to grow to the first target at $ 4.30.
An additional signal here is a strongdrop in RSI values. As you can see, earlier prices have already shown growth at the time of testing this area. Breakdown of the upper boundary of the downward channel and consolidation above the level of $ 4.30 will indicate the quotes go beyond it and lead to a full continuation of the rise. Cancellation of the positive option for EOS will be a breakdown of the $ 2.05 area, which will indicate an increase in the bearish trend.

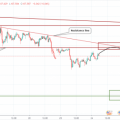
Bitcoin cash
Bitcoin Cash quotes that moved inwithin the framework of the formation of the reversal pattern «Head and Shoulders», they may return to test the broken line «Neck» this pattern and then continue the development of the downward movement. A test of the trend line on the RSI also speaks in favor of a possible correction.

BCH / USD, TradingView data
The next important area of support isthe level of $ 177.05, a breakdown of which will indicate a test area of $ 100.65. Cancellation of this option here will be a strong growth with the surf of the upper boundary of the channel and fixing quotes above the level of $ 355.95. In this case, the asset will have a chance to move up.
On the 4-hour chart we also see a strongpressure from sellers. The crypto asset has left the limits of the «Triangle» and is preparing for a correction with a test of the $245.00 resistance level before the next wave of decline. This scenario is supported by a breakout of the trend line on the RSI, which will act as resistance if the price returns to it. Cancellation of this option could be a strong growth and a breakdown of the level of $320.00, in which case the target for growth will be the areas around the levels of $355.95 and $457.10.

Attention!
Financial market forecasts are privateopinion of their authors. Current analysis is not a guide to trade. RoboForex is not responsible for the results of work that may arise when using trading recommendations from the submitted reviews.
Read this:
 Bitcoin will make an important choice soon
 We are waiting for the decline in USDCAD and the growth of XRPUSD
 Time to choose, Bitcoin.
 Looking forward to move down USDJPY and ETHUSD!
 Analysis of TRX / USD and ADA / USD on 09.24.2019
 The S&P 500 index will become a catalyst for the growth of the Bitcoin rate