He talks about further possible scenarios for the price movement of Bitcoin and several popular altcoins.Leading analyst at RoboForex Dmitry Gurkovsky.
Digital assets continue to test the comingresistance levels. The pressure from the buyers does not decrease and there are high chances to see the continued development of the upward momentum to the next levels.
Unfortunately, the market has not gone downcorrection, thereby canceling the formation of reversal models on the charts of many cryptocurrencies. In turn, the appearance of such models could give customers more profitable and conservative options for entering long positions.
On the other hand, the reluctance of the market to adjust may indicate aggressive continued growth in the near future.
Leading crypto asset Bitcoin is set toupdating of the local maximum near the level of $13,800. But if we assume that the current structure is a “Bull Flag” model, then the target for the rise could be the level of $17,000. Of course, such growth in the main asset will most likely trigger a rise in the rest of the cryptocurrency market.
Bitcoin
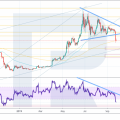
On a daily chart, the value of a bitcoin assetagain testing an important resistance area near the $ 9800 level. Bulls have already managed to push the price beyond the downward channel, but it is important for them to gain a foothold over the level of resistance in order to talk about the full continuation of growth.
A strong signal in favor of the development of an upward trendmovement is the intersection of the Moving Averages, the second signal will be the next test of the broken trend line on the RSI indicator. Moreover: the current structure of the movement is very much reminiscent of the ascending Flag pattern, where the target for growth may be the area at $17,000.
If the price rebounds from current levels,then it is worth considering the option of forming an inverted “Head and Shoulders” pattern. In this option, the target for completing the downward correction will be the $7,625 area. Already from this level we can expect a strong price increase. Cancellation of the option with the development of an upward trend will be a fall below the level of $6875.

TradingView BTC / USD daily chart
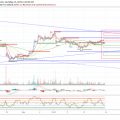
On a 4-hour chart, the price rises withinascending channel. As you can see, quotes are already repelled by moving averages, which indicates pressure from buyers. A strong signal in favor of continued growth is the test of the trend line on the RSI indicator, demonstrating the presence of a good support area.
Cancellation of the option with growth will be the fall and consolidation of quotations below the level of $ 8355, which will indicate the price goes beyond the upward channel and the continued development of the downward correction to the level of $ 6875.

Four-hour BTC / USD chart from TradingView
Ethereum
Ethereum buyers were able to break through the $ 180 area,however, so far the quotes have not risen above the level of $ 200. As you can see, this level also acts as a serious area of resistance, the breakdown of which will open the way to the level of $ 260.
Previously, quotes successfully pushed off the topCloud boundary Ichimoku Kinko Hyo, indicating the presence of an upward trend. At the moment, the potential for continuing the rise remains, but do not exclude the test of the upper boundary of the downward channel.
The test is also in favor of a probable correction.overbought areas on the RSI indicator. Cancellation of a positive option for buyers of an asset will be a strong fall and a breakdown of the $ 155 area, in which case it is worth considering the resumption of a downward trend with a continued decline in the value of the digital asset.

TradingView ETH / USD daily chart
On a 4-hour chart, the price is rising within the channel,however, here the proximity of the resistance level is also observed. Expect a slight correction in the value of the asset to the upper boundary of the Indicator Cloud and the continuation of the price increase to the first target at $ 225.
A strong signal here is a rebound from the bottomthe boundaries of the upward channel, as well as the test of the support line on the RSI indicator. A confirmation of the development of this idea will be a breakdown of the resistance level and consolidation above $ 200.
If the bears manage to drop prices below the level of $ 155, then we should expect continued development of the downward correction to the first target near the area of $ 138.

Four-hour ETH / USD chart from TradingView
Xrp
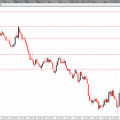
XRPUSD quotes on the daily chart rested againstthe upper boundary of the downward channel, where the resistance area is located. There are risks of a downward correction with a test of the upper boundary of the Ichimoku Kinko Hyo Cloud indicator. In favor of this option is a test of the trend line on the RSI indicator.
Also, one should not exclude the possibility of the formationinverted "Head and Shoulders" model. In this case, after the decline and test of the $0.24 area, a strong growth towards the target at $0.42 is expected.
Cancellation of the positive option for the bulls will be a fall below the level of $ 0.18, after which we should expect the resumption of the bearish trend and the continuation of the fall.

TradingView XRP / USD daily chart
On a 4-hour chart, quotes broke through the upper border of the downward channel. There is every chance for continued growth to the first goal at $ 0.32.
A strong signal in favor of this optionthe location of quotes above the Cloud of the indicator appears, which indicates the presence of a bullish impulse, as well as the likely rebound from the support line on the RSI indicator. As you can see, the indicator values previously repelled from this line and the price moved up.
Cancellation of the scenario with the rise in quotations will be their fall below the level of $ 0.23, which will indicate a resumption of decline to the level of $ 0.17.

Four-hour XRP / USD chart from TradingView
Bitcoin cash
On the daily chart quotes Bitcoin Cashdemonstrate steady growth; at the moment, a breakdown of the upper boundary of the downward channel has taken place. The price tested the upper border of the channel for several days and now the upward movement continues.
Apparently, the next goal of the ascentstands area at $ 520. Moving averages also intersect in favor of a bullish trend. A strong signal in favor of continued growth from current levels is a rebound from the support line on the RSI indicator.
The cancellation of the growth option may be a strongfall and breakdown of the $315 level, in which case the current movement structure will resemble the reversal pattern «Double Top» with the goal of working off at the level of $195. This scenario can be canceled by a strong increase in asset prices with a breakdown of the $410 level.

TradingView BCH / USD daily chart
On a 4-hour chart, the price of a crypto asset is testingarea of resistance. Here, moving averages also indicate a bullish trend. Quotes have already started from the area between the moving averages, which indicates the dominance of buyers.
The values of the RSI indicator are clamped within the Triangle model, so with the breakdown of its upper boundary, we should expect an acceleration in the growth of the value of Bitcoin Cash towards the first target at $457.
Cancellation of the option with the rise will be a fall with a breakdown of the level of $ 375, which means the price goes beyond the rising channel and the continuation of the decline to the level of $ 315.

Four-hour BCH / USD chart from TradingView
Litecoin
Litecoin quotes on the daily chart were able togain a foothold above the resistance level. The next resistance area is at $79. As we can see, the bears failed to provoke the development of a correction and the formation of a reversal inverted “Head and Shoulders” pattern.
However, this does not exclude a high probability of growth.quotes for the width of the price structure, where the target may be an area of $ 100. A good signal in favor of this movement is the rebound from the broken trend line on the RSI indicator.
Cancellation of the option with growth will be a breakdown of the lower border of the Bollinger Bands indicator with consolidation below $ 64, which will indicate a resumption of the downward trend.

TradingView LTC / USD daily chart
On a 4-hour chart, the price continues to developupward movement within the channel. An important area of support is located at $ 64. An additional signal in favor of this scenario is a rebound from the support line on the RSI indicator, as well as a test of the lower boundary of the upward channel.
Cancellation of the option with growth will be a fall with a breakdown of the level of $ 56, which will indicate the price goes beyond the rising channel and the continuation of the fall to a potential target at $ 44.

TradingView LTC / USD four hour chart
Attention!
Financial market forecasts are privateopinion of their authors. Current analysis is not a guide to trade. RoboForex is not responsible for the results of work that may arise when using trading recommendations from the submitted reviews.
Read this:
 Cryptocurrency price analysis: the next possible stop for bitcoin is $ 7,030
 Technical analysis: cryptocurrency market is ready for a new wave of growth
 TradingView Blog | Bitcoin Review
 Forex Academy. Lesson 15 Determine local price lows and highs on the chart
 Is the pound heading to new highs? Bitcoin – final push?
Copy-paste | The number of bitcoin ATMs sets new records
Is the pound heading to new highs? Bitcoin – final push?
Copy-paste | The number of bitcoin ATMs sets new records