Chainalysis is preparing to release an updated index of global cryptocurrency adoption for 2022 and presented the firsta generalized view of it.Emerging markets are leading the way in mass adoption, China continues to have high user activity despite bans, and cryptocurrency market fundamentals look healthy. In this post: methodology, top 20 (→)and main findings (→) from the index.
</p>What do we call the mass distribution of cryptocurrencies?
We could just rank countries by volumecrypto transactions, and this would give us a visual representation of where the most crypto activity takes place. But we are not interested in this. The purpose of our index is to measure where most people invest the majority of their money in cryptocurrencies. Institutional activity plays an important role, but we also want to highlight the countries where individual non-professional investors use digital assets the most. Next, we will talk about our methodology and present the top 20 countries of the resulting index. The place occupied by any of the countries can also be viewed on the interactive map in the source.
Methodology
Cryptocurrency Global Adoption Index fromChainalysis is calculated on the basis of five sub-indices, each of which is based on the use of different types of cryptocurrency services in certain countries. We ranked all 146 countries for which we have sufficient data for each of these five indicators, took the geometric average of each country's ranking for all five, then normalized the final value on a scale from 0 to 1, and thus received for each country a score that determines its position in the index. The closer a country's final score is to 1, the higher its ranking.
To calculate our sub-indices, we estimate volumescryptocurrency transactions by country for various services and protocols based on web traffic data of these services and protocols. This approach does not take into account the use of VPNs and other methods of masking web traffic, however, given that our index is calculated on the basis of hundreds of millions of transactions, the use of VPNs must be extremely widespread in order to significantly distort the data obtained. Experts we interviewed additionally generally agreed that our index is in line with their perceptions of the markets they operate in, which increases our confidence in the methodology used.
In the following, we describe in detail each of the five sub-indices and how they are calculated.
The value of cryptocurrencies received in on-chain transactions by centralized exchanges, weighted by purchasing power parity (PPP) per capita
The purpose of this sub-index is toassess the overall level of activity of each country in interaction with centralized cryptocurrency services, but weigh the value in favor of those countries where the amount received is more significant in relation to the well-being of its residents and the value of money in general in the country. To calculate this indicator, we estimated the total value of on-chain transactions received by users of centralized services in each country and weighted the resulting value by PPP per day. as a measure of the country's wealth in terms of the average resident. The higher the ratio of the total volume of incoming on-chain transactions to PPP per day, the higher the rating, that is, with the same volume of received cryptocurrency transactions, the country with a lower PPP per day. will rank higher.
The value of cryptocurrencies received by centralized exchanges in retail-sized on-chain transactions, weighted by PPP per d.
The purpose of this indicator is to assess the levelactivity on centralized services of non-professional private cryptocurrency users based on the ratio of the volume of their cryptocurrency transactions to the average level of well-being of residents of the corresponding country. We estimated the total volume of retail transactions, in this case defined as any cryptocurrency transactions under $10K. We then ranked countries according to the resulting value, but weighted it in favor of countries with lower PPP per day.
Trading volume on peer-to-peer (p2p) platforms, weighted by PPP per day. and by the number of Internet users
The volume of p2p transactions accounts for a significant share ofof all cryptocurrency activity in emerging markets. For this subindex, we ranked countries by the volume of p2p transactions and weighted the resulting value in favor of countries with lower PPP per day. and fewer Internet users. The goal was to highlight countries where more residents invest a larger share of their wealth in peer-to-peer cryptocurrency transactions.
The value of cryptocurrencies received in on-chain transactions from DeFi protocols, weighted by purchasing power parity (PPP) per capita
In the last two years, DeFi has been one of the mostfast growing areas of the crypto market. In fact, as we can see from the comparison of decentralized and centralized exchanges, decentralized cryptocurrency protocols, which primarily use Ethereum rather than Bitcoin, have already overtaken centralized services in terms of on-chain transaction volume. Given the importance of DeFi to cryptocurrency innovation, we wanted our adoption index to highlight countries where a disproportionate share of user financial activity is concentrated in DeFi protocols. For this sub-index, we rank countries by volume of DeFi transactions, and apply a weighting factor in favor of countries with lower PPP per day.
Per capita purchasing power parity (PPP) weighted value of on-chain retail-sized transactions derived from DeFi protocols
Just like we want to count in the indexactivity of non-professional, individual users of cryptocurrencies on centralized services, we want to get the same for DeFi. Thus, this sub-index ranks each country by the volume of retail-sized DeFi transactions, and applies a weighting factor to the resulting result in favor of countries with lower PPP per day.
How the methodology has changed this year
The biggest change fromgeography report for 2021 is due to the addition of two new sub-indices based on the volume of DeFi transactions and changing the other two sub-indices so that they take into account only the volume of transactions associated with centralized services. This decision is dictated by two reasons: first, as mentioned above, to highlight the countries leading the spread of DeFi, given the importance of these technologies for the entire cryptocurrency ecosystem. Secondly, we wanted to solve the problem of transaction volume inflation caused by DeFi. In the case of centralized services, deposit and withdrawal transactions from them are counted in the volume of on-chain transactions, but transactions within these services, such as trading on centralized exchanges, are not. Centralized services process such transactions on their own, and this data is not available using blockchain analysis tools. But with DeFi protocols, things are different. They do not accept user funds for storage and only route cryptocurrency transactions between private wallets, so all DeFi transactions are displayed on-chain. This means that if you base reports on on-chain data, then the transaction volumes in DeFi protocols will have a strong additional advantage compared to centralized services. In the context of our index, this can artificially rank countries with higher DeFi penetration compared to countries with more centralized services, even if the actual volumes of cryptocurrency transfers in them are the same.
To solve this problem, we decided to measureCeFi and DeFi transfer volumes for each of the countries separately - both in general and for retail size transactions - and use the points received as equal components when calculating the overall index. In this way, we achieve greater accuracy in comparing the volume of transactions in each of the countries and greater transparency regarding where there is a relatively large volume of transactions in the DeFi ecosystem.
Top 20 Cryptocurrency Global Adoption Index 2022
</p>| Country | Position in the index | Total score | Ranking by volume of centralized services | Rating by retail volumes of centralized services | Rating by trading volumes on p2p platforms | Ranking by incoming DeFi transfer | Ranking by inbound retail DeFi transfer |
| Vietnam | 1 | 1000 | 5 | 5 | 2 | 7 | 6 |
| Philippines | 2 | 0.753 | 4 | 4 | 66 | 13 | 5 |
| Ukraine | 3 | 0.694 | 6 | 6 | 39 | 10 | 14 |
| India | 4 | 0.663 | 1 | 1 | 82 | 1 | 1 |
| USA | 5 | 0.653 | 3 | 3 | 111 | 3 | 2 |
| Pakistan | 6 | 0.609 | 10 | 10 | 50 | 22 | 16 |
| Brazil | 7 | 0.562 | 7 | 7 | 113 | 8 | 7 |
| Thailand | 8 | 0.560 | 12 | 12 | 61 | 5 | 3 |
| Russia | 9 | 0.541 | 8 | 8 | 109 | 11 | 12 |
| China | 10 | 0.535 | 2 | 2 | 144 | 6 | 4 |
| Nigeria | 11 | 0.521 | 18 | 18 | 17 | 20 | 17 |
| Turkey | 12 | 0.519 | 9 | 9 | 121 | 19 | 15 |
| Argentina | 13 | 0.510 | 13 | 13 | 26 | 21 | 25 |
| Morocco | 14 | 0.507 | 19 | 19 | 21 | 33 | 18 |
| Colombia | 15 | 0.496 | 23 | 23 | 10 | 27 | 29 |
| Nepal | 16 | 0.478 | 17 | 17 | 19 | 34 | 41 |
| Great Britain | 17 | 0.473 | 14 | 14 | 71 | 12 | 11 |
| Ecuador | 18 | 0.409 | 37 | 37 | 6 | 45 | 56 |
| Kenya | 19 | 0.397 | 43 | 43 | 5 | 9 | 34 |
| Indonesia | 20 | 0.396 | 16 | 16 | 129 | 18 | 13 |
source
Key takeaways from the Cryptocurrency Adoption Index 2022
Overall adoption slows globally in bear market conditions but remains above pre-previous bull market levels
Our data shows that in the last yearGlobal adoption levels have stabilized after a period of continued growth since mid-2019. We see this trend in the chart below, where we apply our index methodology to the world as a whole, summing the quarterly performance of all 154 countries from Q2 2019 to present, and re-indexing that number to show how global adoption has trended over time.
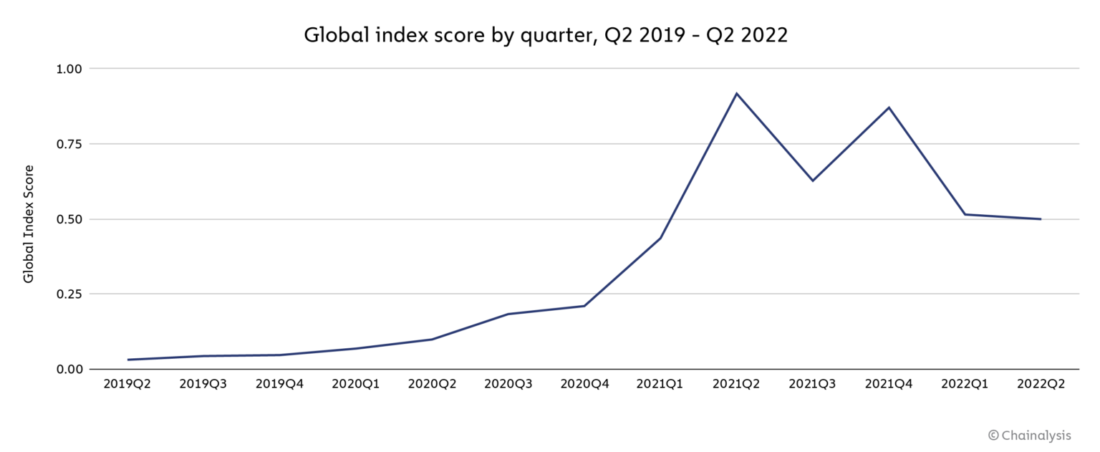
Global adoption of cryptocurrencies has reachedthe latest record high to date in Q2 2021. Since then, cryptocurrency adoption has come in waves, falling in the third quarter as market prices fell, rebounding in the fourth as it rallied to new all-time highs, and declining in the next two quarters as we entered a bear market. However, it is important to note that global adoption remains well above levels seen before the 2019 bull market.
This suggests that many of those whoattracted price increases in 2020 and 2021, remained in the crypto market and continue to invest a significant part of their funds in digital assets. This is also in line with our previous data showing that crypto markets have been surprisingly resilient in recent downturns. Large long-term hodlers continued to hold onto their cryptocurrencies in the bear market as well, and on-chain data suggests that this class of holders is generally bullish on the prospects for a recovery, keeping market fundamentals relatively healthy.
Emerging Markets Dominate Global Crypto Asset Adoption Ranking
The trend we noted last year inthis year has only intensified: emerging markets dominate the index. The World Bank classifies countries into one of four categories based on income levels and overall economic development: high income, upper middle income, lower middle income, and low income. Using this classification, we found that the middle two categories dominated the top of our index. From the top 20 countries in our ranking:
- ten with lower middle incomes: Viet Nam, Philippines, Ukraine, India, Pakistan, Nigeria, Morocco, Nepal, Kenya and Indonesia;
- eight with upper middle incomes: Brazil, Thailand, Russia, China, Turkey, Argentina, Colombia and Ecuador;
- two high-income countries: the United States and the United Kingdom.
As we will see later in the report, users inLower and upper middle income countries often rely on cryptocurrencies to send remittances, maintain their savings during fiat currency volatility, and meet other financial needs unique to their economies. Users from these countries also tend to rely on Bitcoin and stablecoins more than residents of other countries. In the coming years, it will be interesting to see what solutions the cryptocurrency industry can offer to increase the adoption rate of cryptoassets in high and low income countries.
Vietnam holds first place, US climbs to fifth, China returns to top ten
There are a few individual countries whose ratings stand out from the rest.
Vietnam ranks first for the second year in a rowon the level of acceptance of cryptocurrencies. The sub-index values show that Vietnam is showing extremely high purchasing power and adoption (adjusted by population) of centralized, DeFi and p2p crypto-currency instruments. Other sources also note the craving of the Vietnamese for cryptocurrencies. A 2020 survey found that 21% of Vietnamese consumers reported using or owning cryptocurrencies, second only to Nigeria at 32%, and since then, the adoption rate of cryptocurrencies in Vietnam has likely only grown. According to local media reports, games based on cryptocurrencies, including play-to-earn (P2E) and move-to-earn (M2E) models, are especially popular in this country. This applies not only to user interest, but also to developers: the developer of the most profitable P2E game in the world, Axie Infinity, is based in Ho Chi Minh City, and its success has inspired many startups in the field of cryptogaming.
The United States has risen to fifth place in ourranking from eighth in 2021 and sixth in 2020. The U.S. is in the top three in every sub-index, with the exception of p2p exchange usage adjusted for population and purchasing power, where it ranked only 111th. This is generally not surprising as our research shows that p2p usage tends to be more common in countries with low purchasing power. Perhaps the most interesting thing here is that the US is by far the leader in cryptocurrency adoption among developed countries and one of only two countries in this category in the top 20 of our index, along with the UK.
Finally, China this year re-entered the toptop ten of the index after 13th place in 2021. Our sub-indices show that China scored highest in the use of centralized services, ranking second in terms of purchasing power-adjusted transaction volume both overall and in retail category transactions. This is interesting, given the Chinese government’s ban on any cryptocurrency-related activity in the country, including both mining and trading. Our data suggest that the ban has proved to be ineffective and poorly enforced in practice.
Bear Markets Can't Undo Growth in Adoption During Bull Trend Periods
As we noted above, although with the beginning of the currentbear market growth has become more sporadic, global adoption remains well above pre-2020 bull market levels. The data suggests that a critical mass of new users investing in cryptocurrencies during periods of rising prices tend to remain in the crypto market even when it declines, which has so far allowed the ecosystem to grow steadily from one market cycle to the next. One of the reasons for this may be the value that users in emerging markets receive from cryptocurrencies. These countries dominate the adoption index, in large part because cryptocurrencies provide unique tangible benefits to people living in unstable economic conditions.
BitNews disclaim responsibility for anyinvestment recommendations that may be contained in this article. All the opinions expressed express exclusively the personal opinions of the author and the respondents. Any actions related to investments and trading on crypto markets involve the risk of losing the invested funds. Based on the data provided, you make investment decisions in a balanced, responsible manner and at your own risk.
</p>
Read this:
 Russia and Ukraine lead the cryptocurrency adoption index
 Ukraine and Russia lost leadership in the global cryptocurrency adoption index Chainalysis
 Russia in the TOP-10 countries in terms of cryptocurrency adoption index
 The Central Bank of the Russian Federation calls for the development of a digital ruble instead of the adoption of cryptocurrencies
 Exit the triangle using the arrows. VA index DEFI tokens
 The strengthening of the US dollar index caused Bitcoin and the S&P 500