Declining trading volumes and a continuing sideways trend foreshadow an imminent jump in price volatilitybitcoin.
The markets have been quite behaving over the last couple of monthsboring, and BTC has been trading in the range of $10,200–$11,000 for the last month. In recent days, the range has narrowed even more, based on which many traders predict a sharp exit from it in the very near future.
At the same time, the price of BTC does not show anya certain direction, while altcoins are predominantly trending downwards. Most markets are in a phase of strong correction, and this can hardly be regarded as a positive signal for the crypto market as a whole.
BTC price stuck in sideways range


1-day BTC/USD chart. :TradingView
On the daily Bitcoin chart, we see continued fluctuations in a rather narrow range formed after the price fell below the important support level of $ 11,200 - $ 11,400.
As long as the Bitcoin price remains below this zoneresistance, there is hardly any point in expecting a strong upward movement. However, volatility has come very close to its minimum historical values, and this clearly indicates that the critical moment of exiting the range is approaching.
When volatility begins to subside, trading volumes decline, which ultimately leads to a strong price momentum.


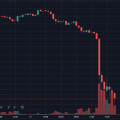
Bitcoin volatility index, 7-day chart. :TradingView
Despite all the negativity surrounding the crypto marketsRecently, Bitcoin volatility continues to decline. Even to a series of events such as the KuCoin hack, a lawsuit against BitMEX and the FCA ban on trading in crypto derivatives, the price of BTC did not react at all.
Actually stabilizing the price of bitcoin on thisbackground is not a sign of weakness. In addition, the documented increase in the number of new addresses suggests that a potential bullish move is just waiting in the wings.
But will this move spread across all markets or is it just about the price of Bitcoin?
A correction after impressive spikes in growth in a number of cryptocurrencies was inevitable. The question is whether it is finished or will be continued.
The total cryptocurrency market capitalization is stuck between key levels


Total capitalization of the crypto market, 1-day chart. :TradingView
While Bitcoin price fluctuates betweendecisive levels, the same can be said about the total capitalization of the entire sector. The chart shows a clear breakdown of support, after which the cryptocurrency market capitalization continues to fluctuate between $ 307 billion and $ 338 billion.
As with Bitcoin, name a specificthe direction in the short term seems difficult. After reaching $ 12,400, the BTC price is in a downtrend. However, if we count from the March collapse, the trend is upward.
Seen in this light, Bitcoin's potential confirmation of a higher low around $ 9,000 would also fit well into this bullish macro trend.


Total capitalization of the crypto market, 1-week chart. :TradingView
Obviously, there is no sense in the crypto marketseuphoria comparable to 2017, and this is completely normal. Building a sustained bull cycle takes a significant amount of time before any climactic rally can occur.
Anyway, total capitalizationthe cryptocurrency market was unable to overcome the resistance at the level of $ 380 billion. After that, a retest of support in the zone of 255–280 billion dollars, which also corresponds to the levels of 100-week and 200-week moving averages, appears to be a very likely scenario.
Potential scenario for Bitcoin


1-day BTC/USD chart. :TradingView
Bitcoin is still trading belowresistance and loses momentum as trading volumes dwindle. Within the downward trend formed after the top of $12,400 and not yet interrupted, another downward movement seems more than likely. This would mark a pullback after the failed resistance attempt at $11,200–$11,400.
However, if Bitcoin overcomes this resistance, this will open the way for it to new highs in the near future.
In case of a bearish move, the most likely support levels are in the $9500-$9800 and $8800-$9100 zones.
If the correction continues to these levels, then, most likely, it will end there. If so, then 2021 could be a very bullish year for the entire cryptocurrency market.
The article does not contain investment recommendations,all opinions expressed are solely the personal opinion of the author. Any activity related to investing and trading in the markets carries risks. Make your own decisions responsibly and independently.
�
</p>Read this:
 Unsuccessful attempt to break through $ 11,000 increases the likelihood of a pullback to the CME trading gap
 The cryptocurrency market capitalization exceeded $ 300 billion, but the share of bitcoin decreased by 6.5%
 Bitcoin price has fallen below $ 6,000. Market capitalization dropped to $ 150 billion
 Bitcoin leaves the downtrend and is preparing for growth in February
Should traders worry about a series of smaller highs after a pullback from $ 12K?
How to Determine a Trend Reversal
Bitcoin leaves the downtrend and is preparing for growth in February
Should traders worry about a series of smaller highs after a pullback from $ 12K?
How to Determine a Trend Reversal