The topic of today's article will be the Coin Days Destroyed metric, as well as the study of the latesttrends associated with this indicator. The metric was first mentioned by a Bytecoin user asbitcoindays destroyedon the BitcoinTalk forum back in 2011.
Coyne days are the total number of days duringwhich the coin remained motionless. If one bitcoin did not move during the year, it would accumulate 365 coin-days. Likewise, if 365 bitcoins were last moved one day ago, they also accumulated 365 coin days in total.
So Coin Days Destroyed (CDD)takes into account all the individual coins (technically: UTXO) that moved during a given day and multiplies them by the number of days that those coins were previously dormant. The resulting number is the number of coin days destroyed that day. Analyzing this metric can provide insight into the activity of longer-term investors, as well as whether Bitcoin transactions over the network are carried out predominantly by short-term or long-term owners.
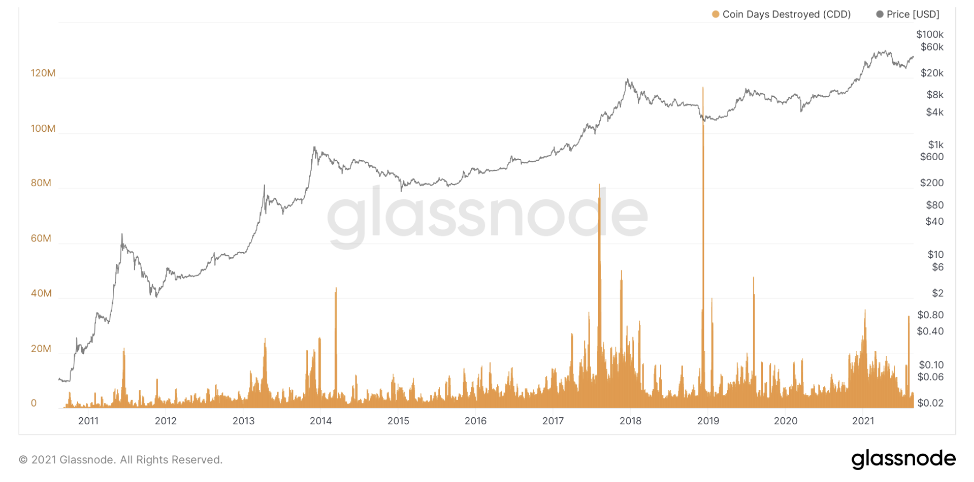
Watch only on Coin Days Destroyed notespecially informative since reading daily data is hampered by large outliers, but for context, here's a daily chart for the entire history of bitcoin:

Bitcoin: Coin Days Destroyed Indicator Dynamics
Bitcoin: Coin Days Destroyed (Seven-Day Moving Average)
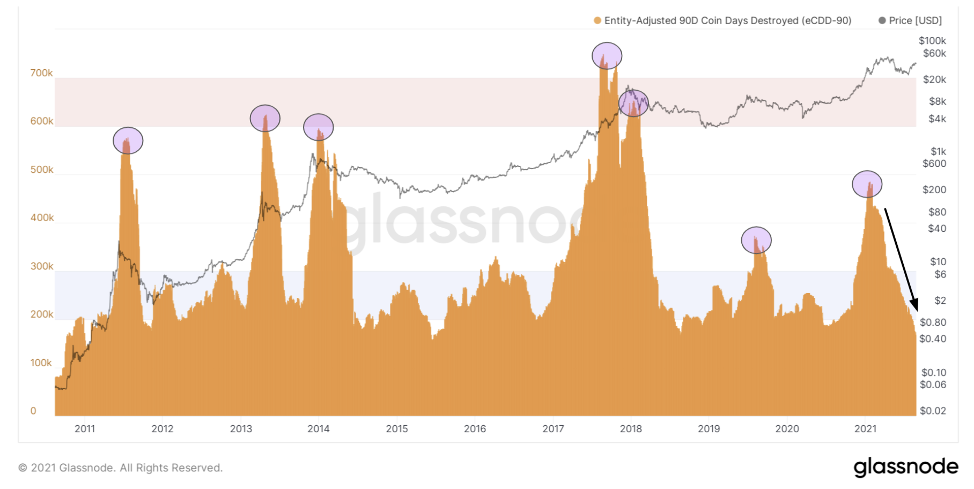
When applied to data, a seven-day movingthe average graph is still not very informative, but the trends are becoming more pronounced. When using data on broken coin days, using moving averages with a longer time frame gives investors a clearer picture of the general trends in investor / holer behavior.
Throughout Bitcoin history periodsparabolic rallies were accompanied by increases in CDDs as investors used them to lock in some return on their investments. 2013, 2017 and most recently 2021 saw high CDDs, which is pretty clear below:
Bitcoin: 90-Day Rolling Sum Coin Days Destroyed
When looking at the 90-day moving amount (other than the moving average) of the CDD, there are clear trends in the history of bitcoin.
However, it is interesting that, unlike othersbullish rallies with renewed price highs and a steep downtrend in the 90-day moving amount of CDD that followed a large spike in the metric and renewed local highs, we saw price react in a meaningful way this time around, rallying ~ 70% from last low to local high the peak, while the 90-day sliding sum metric of the destroyed coin-days continued to decline to nearly five-year lows.
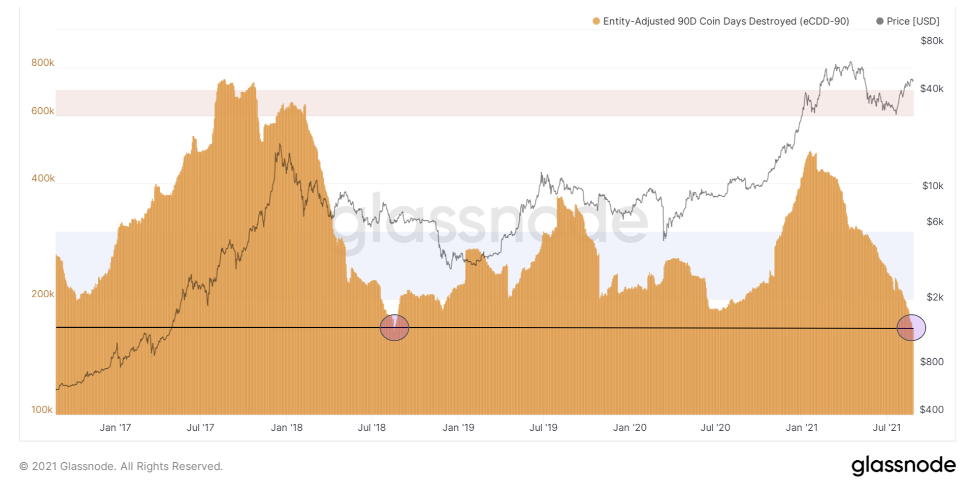
Bitcoin: 90-Day Rolling Sum Coin Days Destroyed
Summary:Investors sit quietly and do not sell aggressively on the rebound, using it as liquidity to exit the market.
Earlier, we talked in detail about a largeaccumulation of bitcoins, and the significance of these accumulation trends in relation to price movements is real. If we continue to observe aggressive accumulation by both new and relatively long-standing market participants without a rebound in CDD, then the market will struggle for a small amount of available for sale bitcoins, which means that we should expect parabolic dynamics on the chart of its quotes.
The dichotomy between the CDD value is stilla retest and renewed price highs over the next few months, and the odds still remain, would be one of the most bullish signs the market has to offer, and this is a very likely scenario.
We will monitor this dynamic.
BitNews disclaims responsibility forany investment recommendations that may be contained in this article. All opinions expressed express exclusively the personal opinions of the author and respondents. Any actions related to investment and trading in crypto markets involve the risk of losing invested funds. Based on the data provided, you make investment decisions carefully, responsibly and at your own risk.
�
</p>