— consider Glassnode analysts and substantiate their point of view in detail.
In this post we will look at the currentbitcoin price evolution and understand what the recent correction means in 2022 perspective, using 2021 bullish and bearish sequences and Glassnode’s own signals for context.
Let's start by analyzing the continuationbitcoin's rise from 2020 to January 2021, the subsequent rotation into altcoins from February to April, and finally the capitulation in mid-May. Toward the end of the review, we will look at the second part of 2021, outline the similarities and differences between the 4th quarter of 2020 and the first half of 2021, and based on this, we will predict what should happen in 2022.
Well, let's get started.
What does the recent correction mean for the big picture?More importantly, what does it mean in terms of the overall outlook for bitcoin in the near future? To understand how long this change in price trend is, you need to take a closer look at the demand side.
Does the tide change into the tide?
Since the beginning of February we have seen potentiala trend reversal in Bitcoin and the crypto market in general, caused in part by the closing of the CME gap at $40K, which led to a short-term rise in the price to ~$44K. At the time of writing, the constant selling pressure that the market has been experiencing over the past few weeks is being neutralized quite effectively. In today's post, we will analyze the current market structure and point out the main elements that will influence the price in the future.
CME gaps set support and resistance levels:
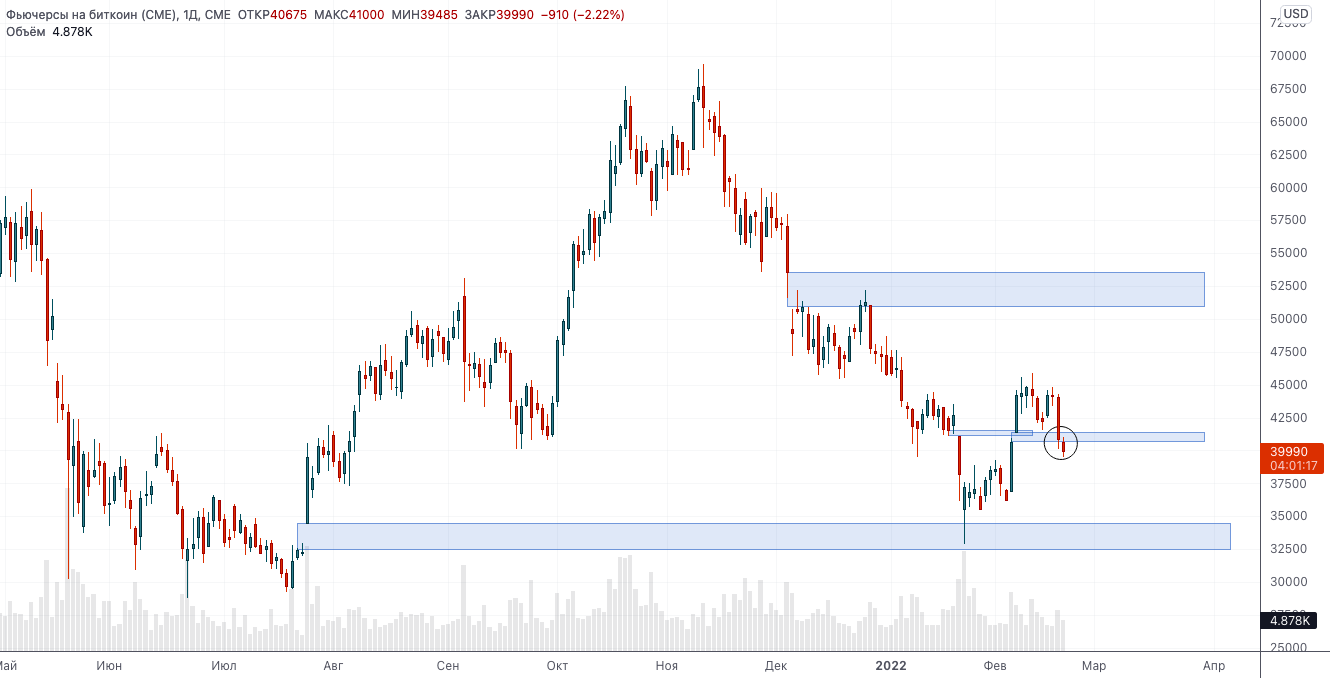
Institutional investors have a significant impact on BTC price movements, directing it between CME gaps: $44k, $40k and the lowest ~$34k.
It is important to start by analyzing the types of current market participants to understand how stable the current price levels in the $40-44K range are. Strong and sustainable demand is necessary for sustainable price growth.
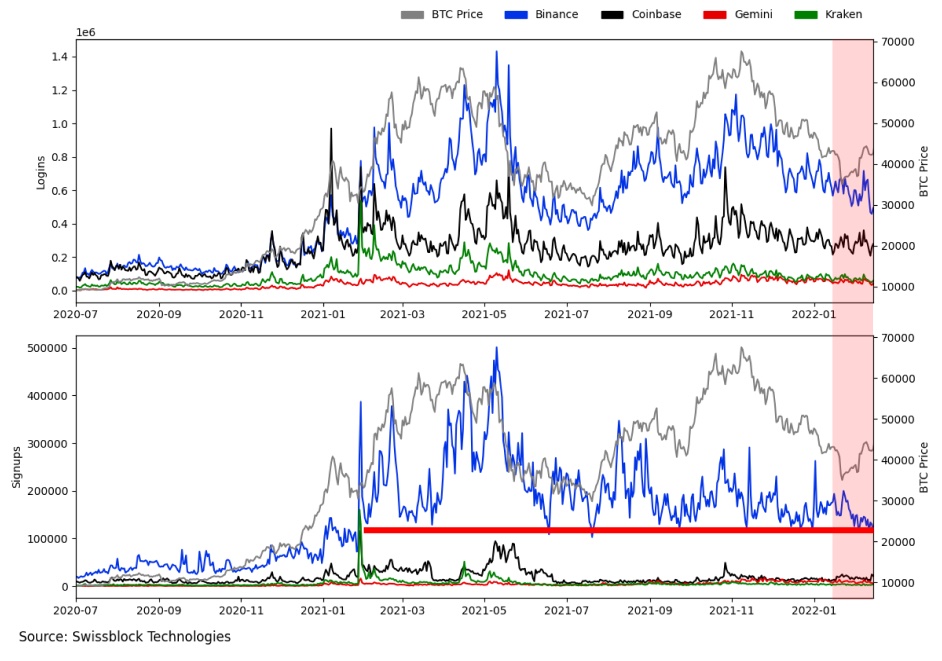
From December 2021 we are seeing a changedominant types of investors/traders in the ecosystem. The number of new registrations on the largest exchanges is at a 12-month low (red line, bottom graph) and the number of entries to existing accounts during the first month of 2022 is also declining.
Investors of a different type are active on the exchanges:
At the same time, the relative sizeon-chain transactions increased significantly by the end of 2021 - the beginning of 2022. At the same time, the number of transactions has decreased significantly since June 2021, while the volume of transfers has doubled on average over the same period. In short, fewer transactions of significantly higher volume in BTC means that institutional investors, not retail ones, are in charge of the market.
Fewer larger transactions:
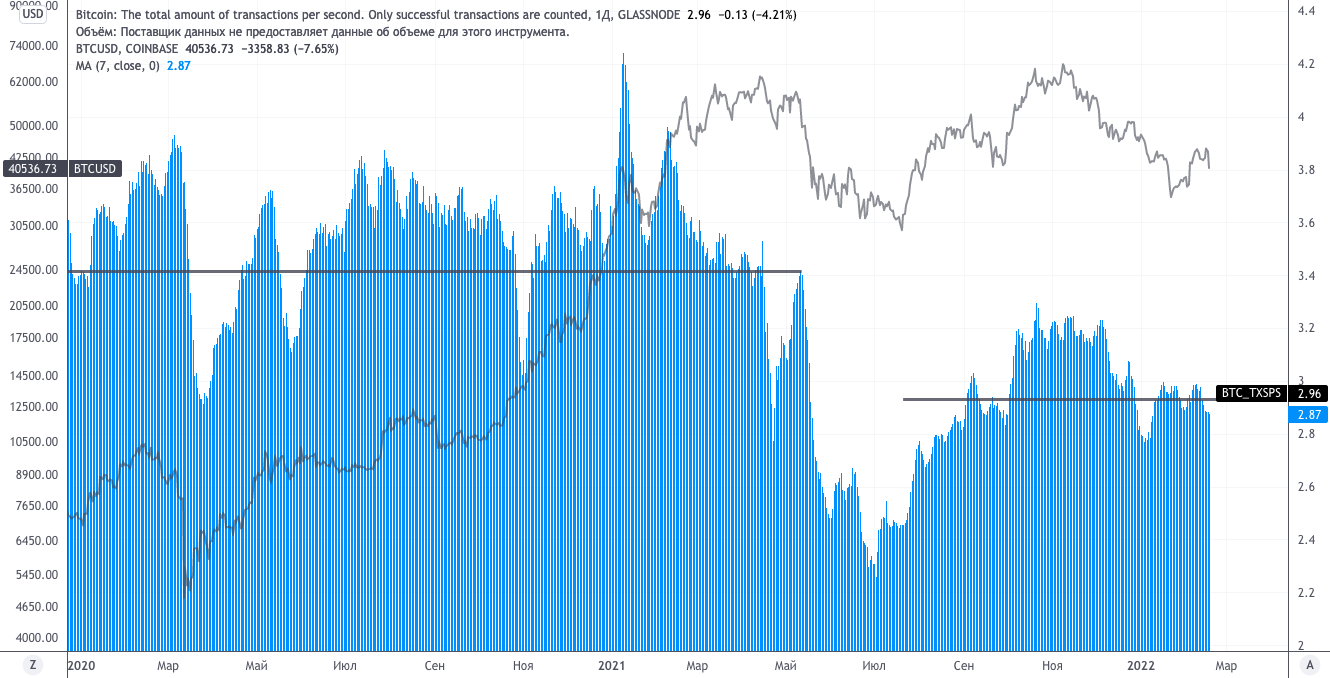
BTC: transactions per second (7d moving average)
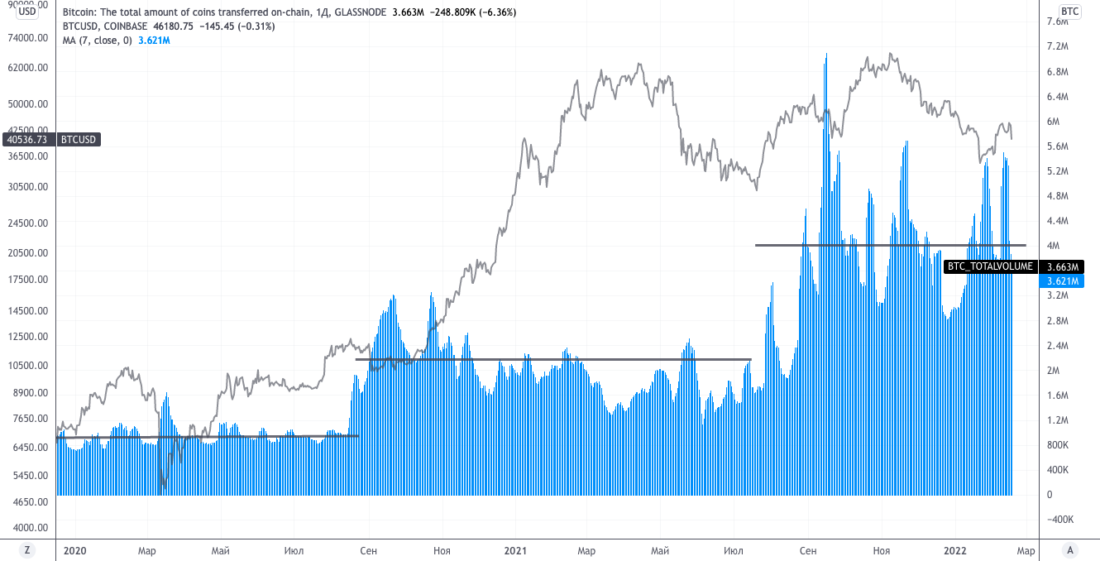
BTC: total transfer volume (7d MA)
With transaction volume rising, long-term holders bought an additional 3 million BTC: an increase of approximately 20% compared to January 2021 (left chart).
Looking at the total number of network entities,in profit, we see that there are over 2 million more BTC in the hands of long-term holders since the last major cycle peak in 2017, and they held these tokens through the most recent dip in November 2021 (right chart). In other words, the last time most network entities were profitable, long-term holders controlled less supply (red areas, right graph). The latter is strong evidence that the market is strongly supported and has many new committed long-term investors.
More long-term holders are convinced of the viability of Bitcoin:

Short-term price movements can be determinedCME gaps, but long-term holders added about 3 million BTC to their holdings at lower price levels. Their confidence in Bitcoin's long-term viability is only growing.
Summarizing the points listed above, the marketbigger players came in with deep pockets. However, the question of how large they are remains open. In order to answer it, it is necessary to classify the subjects of the network on the basis of balance and evaluate the behavior of the resulting groups over the past 12 months.
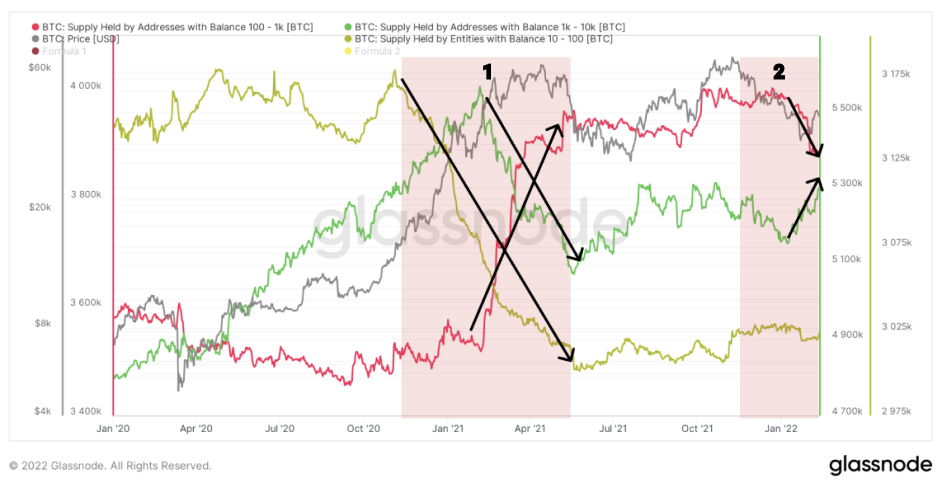
Taking a closer look at the dynamics since January2020 shows that the market is controlled by three main cohorts: entities with a balance of 10-100, 100-1k and 1k-10k BTC, who control a total of 12.3 million BTC.
At the beginning of the current bull cycle (November 2020), wefirst saw a Bitcoin rotation from entities with a balance of 10-100 BTC (yellow line), followed by entities with a balance of 1-10k BTC (green line) since the beginning of 2021 (area 1). At the same time, there was active accumulation in the cohort of 100 – 1 thousand BTC (red line), which accumulated a total of 400 thousand BTC in 1.5 months. This phenomenon broke the cycle that had been in effect since the March 2020 collapse.
From the beginning of 2022, rotation began to occurcoins from the 100-1k BTC cohort back to the 1-10k BTC cohort (area 2). Large entities have moved from accumulating large amounts to distributing the amount to smaller accounts and using the delta to invest in derivatives for hedging or to gain directional exposure to the market.
Large entities accumulate bitcoins:
Verdict on the current state of the market:
- We have come to levels where long-termholders and hoarders remain optimistic about the prospects for bitcoin. Notice how the NUPL (Net Unrealized Profit/Loss) indicator for long-term holders bounced off mid-2020 support and is starting to move potentially towards the high yield zone it was in in April 2021 (area 1).
- Confidence in short-term holdersis recovering, capitulation is weakening (area 2) - compared to the longer period of hope and fear caused by the bearish divergence in April 2021 (area 1).
Optimistic accumulation of long-term holders and capitulation of short-term holders:
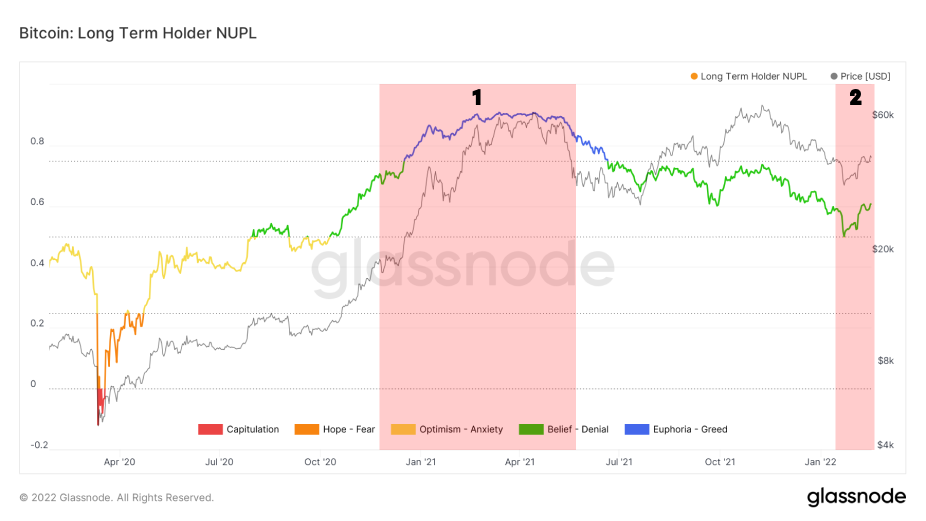
NUPL for long-term holders
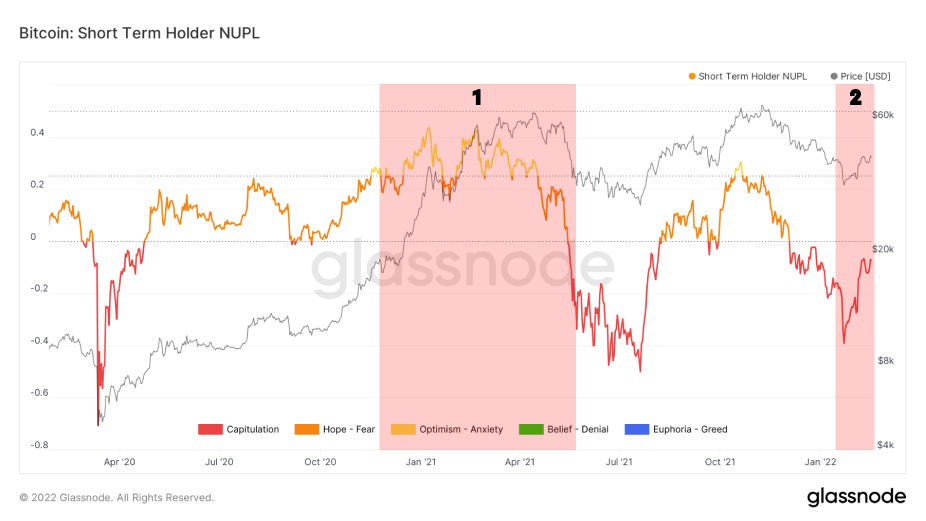
NUPL for short-term holders
New sheriff in town: who sets the price?
A permanent reduction in the total exchangeBTC balance sheets have been a hot topic since the start of the current bull market, and are leading the trend with low barrier-to-entry exchanges such as Coinbase. However, looking at the macro picture of BTC outflows from exchanges from above, we sometimes lose sight of the more subtle changes taking place below the surface.
Fewer bitcoins on exchanges in the absence of retail investors:

BTC exchange balances: all exchanges (left), Coinbase (right)
Looking at changing the balance of bitcoins on individualexchanges, it quickly becomes clear that the story here is quite different. Bitfinex, Binance and FTX have seen net BTC inflows since the mid-2021 crash.
There is a type of market participants who "switchedtransfer” and began to trade on exchanges specializing in derivatives and more complex instruments. Two of the main reasons for the flow of BTC from large fiat exchanges such as Coinbase to leading derivatives exchanges are: 1) optimization and reduction of counterparty risk (when holding physical bitcoins on the exchange) from funds and large money managers. In low volatility environments, using perpetual swaps and futures/options contracts is sometimes cheaper and requires far fewer physical bitcoins. 2) In the absence of a directional trend, many market participants need tools to protect their capital, and options and futures in low volatility conditions are a cheap alternative to cash and holding physical tokens.
The change in investor profile has led to an increase in BTC balances on Binance, FTX and Bitfinex:

BTC Exchange Balances: Binance, FTX, Bitfinex
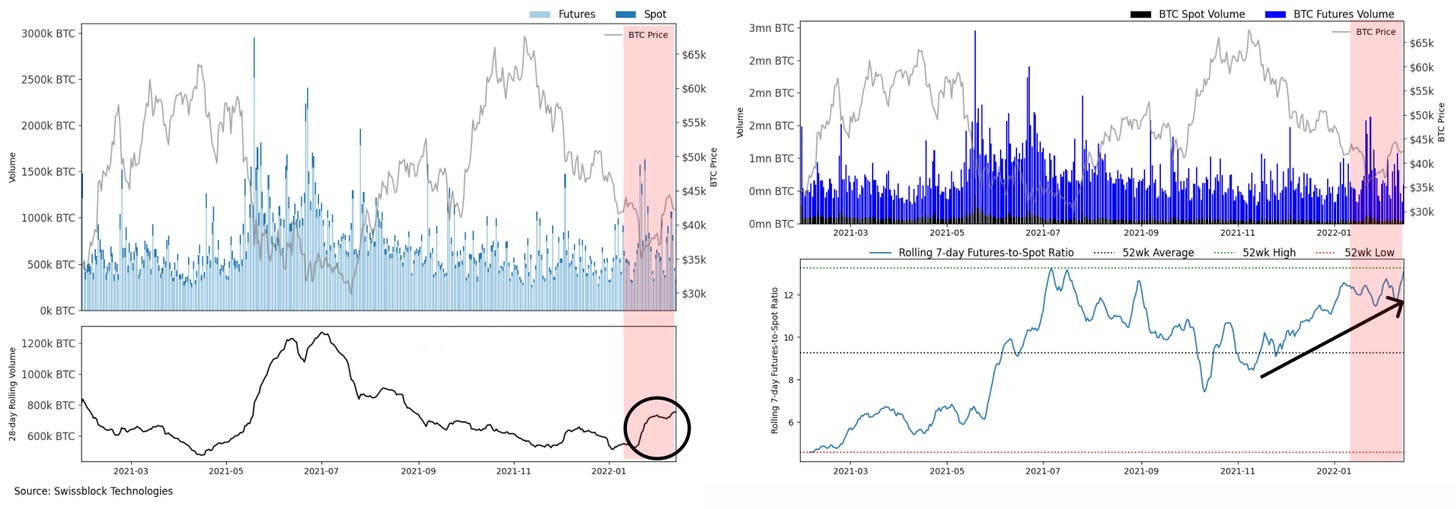
If we take the same exchanges and analyze themspot and futures trading volumes, a similar picture emerges by the end of 2021. You can see how both the moving volume (circle on the left chart) and the ratio of futures volume to spot volume (arrow on the right chart) increase by the beginning of 2022. More importantly, we see a similar ratio in mid-2021, before the uptrend reverses.
Increasing leverage and trading volumes on Binance, FTX and Bitfinex:
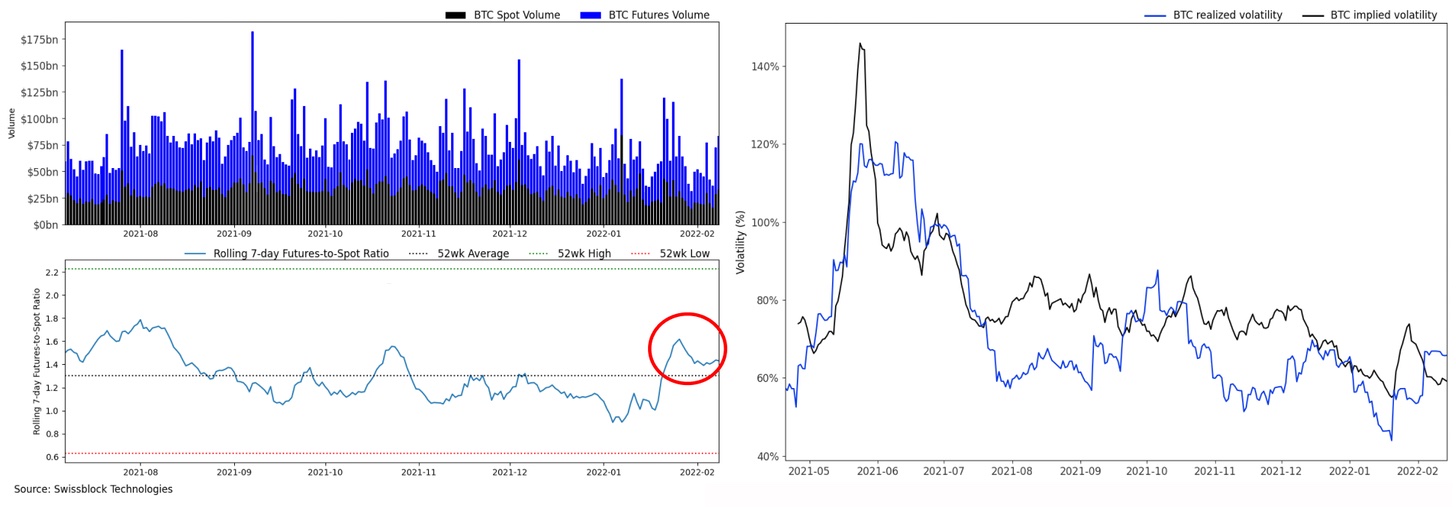
Returning to the macro level, it is clear that thisthe change in the ratio of futures and spot is also manifested in the scale of total trading volumes. While the market is far from the insane levels of early 2021, we are seeing a resurgence in derivatives trading with more experienced traders entering the market, using these tools to gain directional market exposure when expected volatility is low, and to hedge exposure on their spot positions.
The resurgence of derivatives trading:
Follow the money: where will the next source of Bitcoin demand come from?
So what does it all mean for the current price and wherewill she move on? As with any bull market in the past, the sustained rise in prices is the result of organic demand from retailers and large investors buying bitcoin directly or through various market instruments. While we are far from the levels of crazy greed that marked the top of the bull cycle in early 2021, with low spot demand, a new leverage pump in the system to exorbitant heights could happen very quickly.
Capital inflow to the crypto market:

Following billion-dollar outflows from short-term capital markets in January, crypto-asset exchange-traded funds attracted more than $132 million, led by Bitcoin funds with an inflow of $90 million.
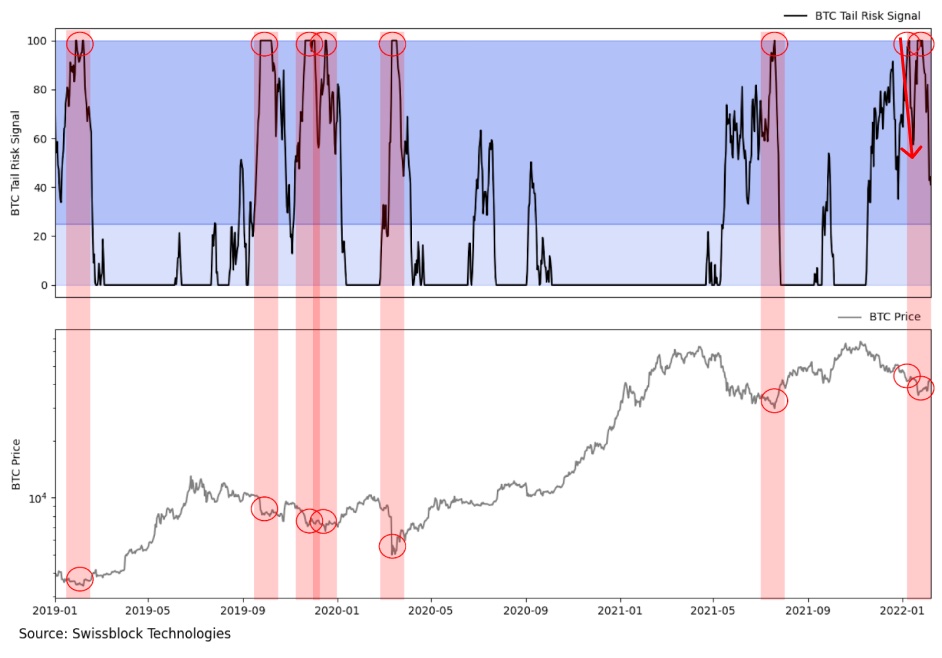
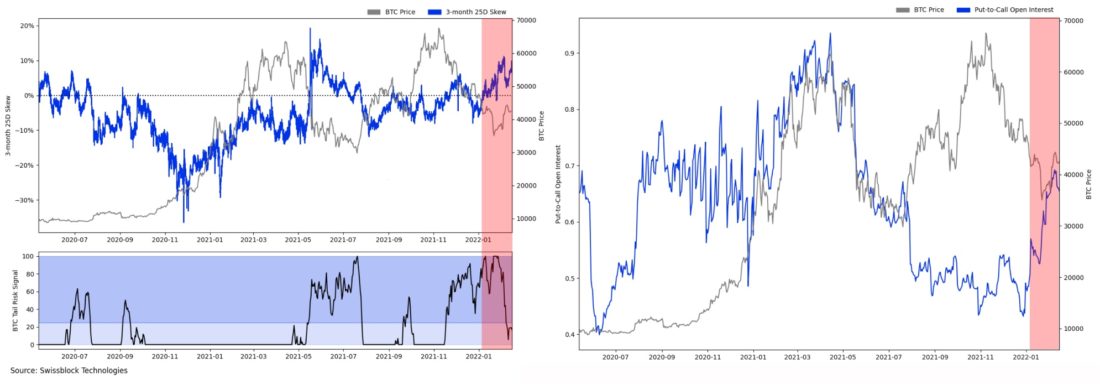
Bitcoin Risk Signalfrom Swissblock shows that the Bitcoin marketreached a structural bottom, with the signal forming two peaks at once during a major sell-off at the end of 2021. After the bottom at $34K, the indicator returns to the low-risk zone (light blue). We will closely monitor developments while awaiting confirmation of the price bottom. Every sustainable price increase always starts from a solid foundation.
Formation of a structural bottom while reducing risk:
In terms of open interest (histograms ontop charts) you can also see slow growth again, very similar to the situation after the crash of May 2021. Looking at the rate of change in open interest, the pattern between these two periods indicates similarities between these structural events. Futures open interest (right chart) paints a similar picture with this indicator returning to slow growth.
Slow increase in open interest:
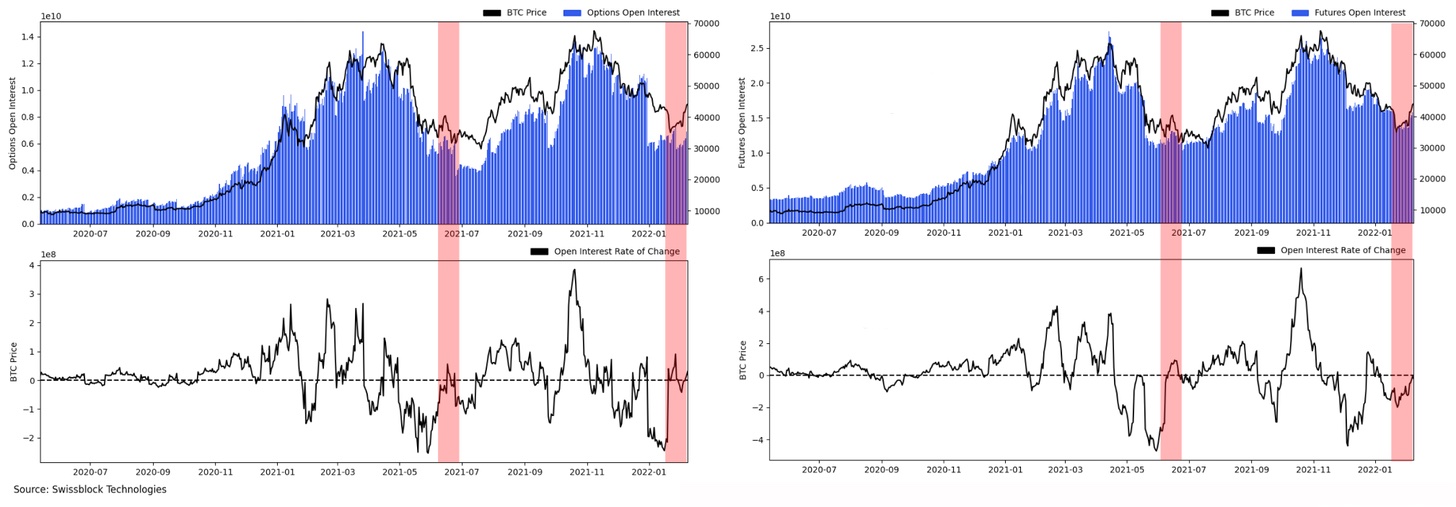
Gradual growth of open interest in the marketsfutures and options indicates an increase in demand. A structural event unfolds reminiscent of June-July 2021, but with a faster recovery in the options market.
An interesting artifact noticeable in comparisonthe rate of change of open interest in options and futures is how these rates recovered during the periods highlighted in red. The recovery slope for options and futures has changed. In June 2021, the change in open interest for options was slower than for futures (area 1); whereas in January 2022, the change in open interest for options was much faster than for futures (area 2). We will discuss the significance of this difference in the following posts.
The recovery of the options market in 2022 is happening very quickly:
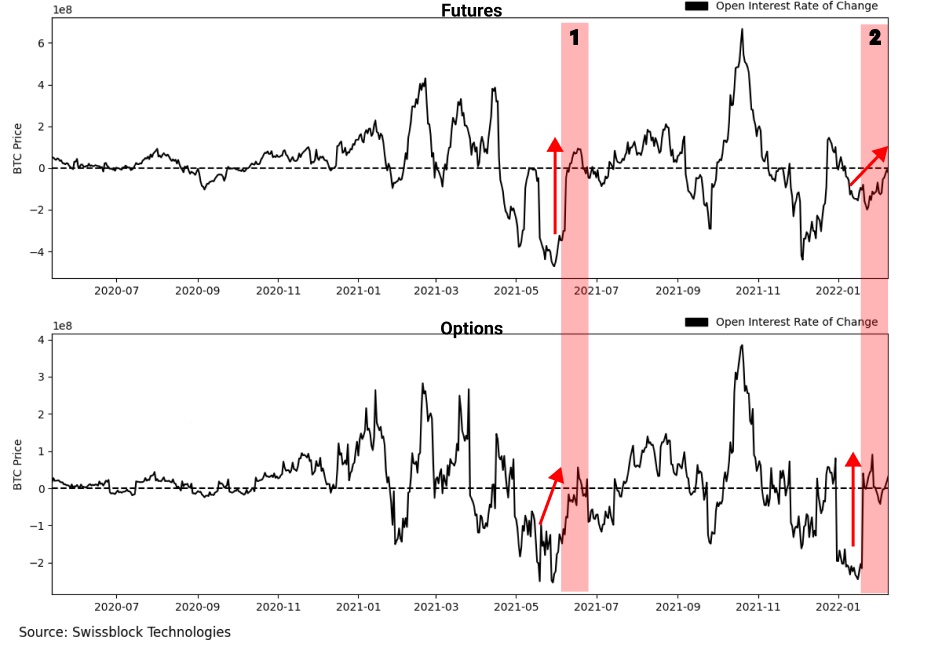
To show how open interest changes over time, we focus on the rate of change in open interest.
A similar increase in use is seen incrypto-backed futures (area 2) is evidence that market participants are willing to take on more risk through token-backed margins instead of stablecoins.
Growth of open interest on futures with collateral in cryptocurrencies:
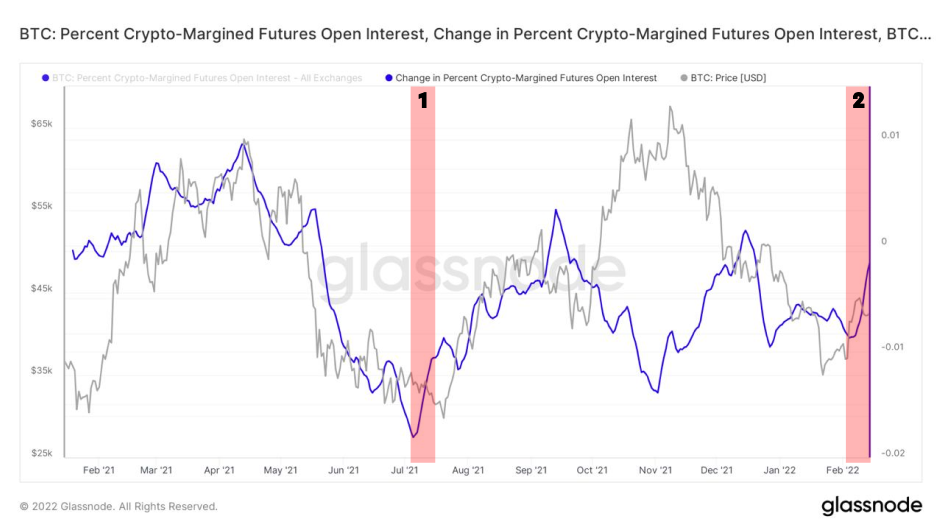
In times of great greed and optimismthere is an increased appetite for risk as derivatives are backed by tokens, which increases the likelihood of liquidating a position when volatility increases. The following shows how you can understand the state of the market, looking through this prism.
Change in sentiment: investors are willing to take on more risk:
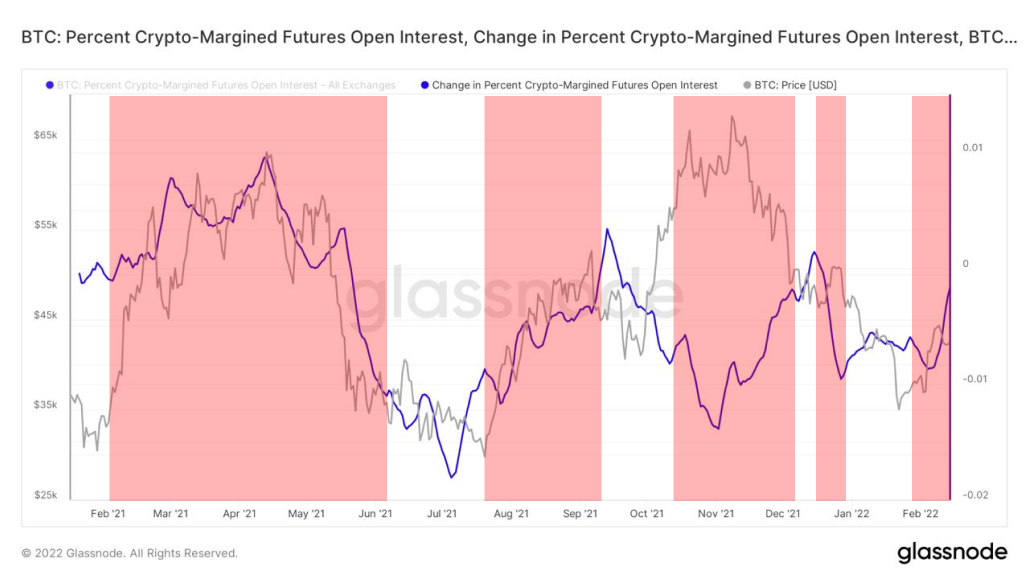
BTC: Changing Open Interest on Futures Collateralized in Cryptocurrencies
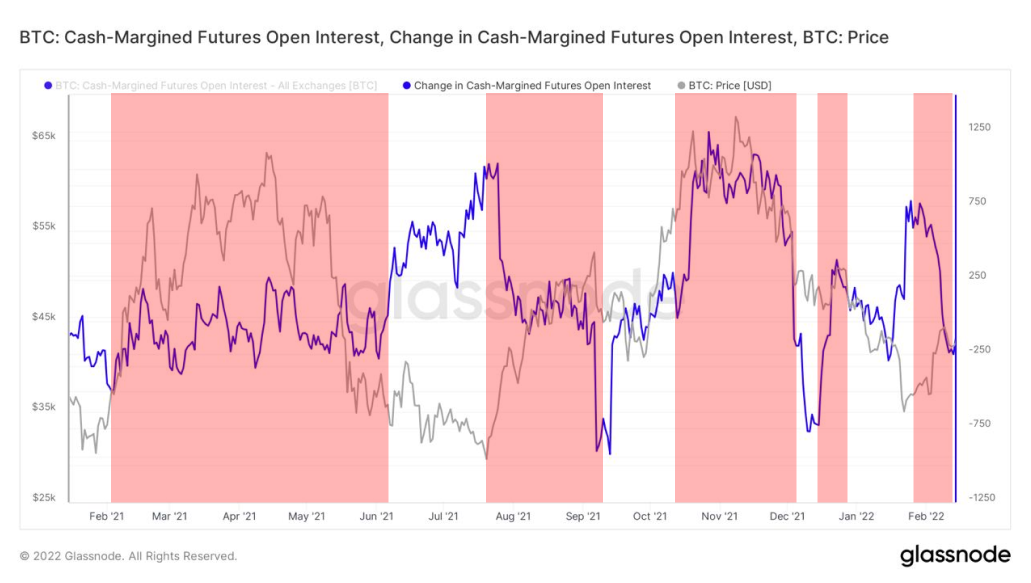
BTC: Change in Open Interest on Cash-Backed Futures
An increase in leverage indicates an increase in speculation and confidence, however, a steady increase in prices is a consequence of organic demand.
Let's now take a look at the basis of demand for bitcoinapart from derivatives. First, let's try to understand where this demand will come from. It must be admitted that bitcoin is no longer an isolated system: the macro world for him today is more important than ever.
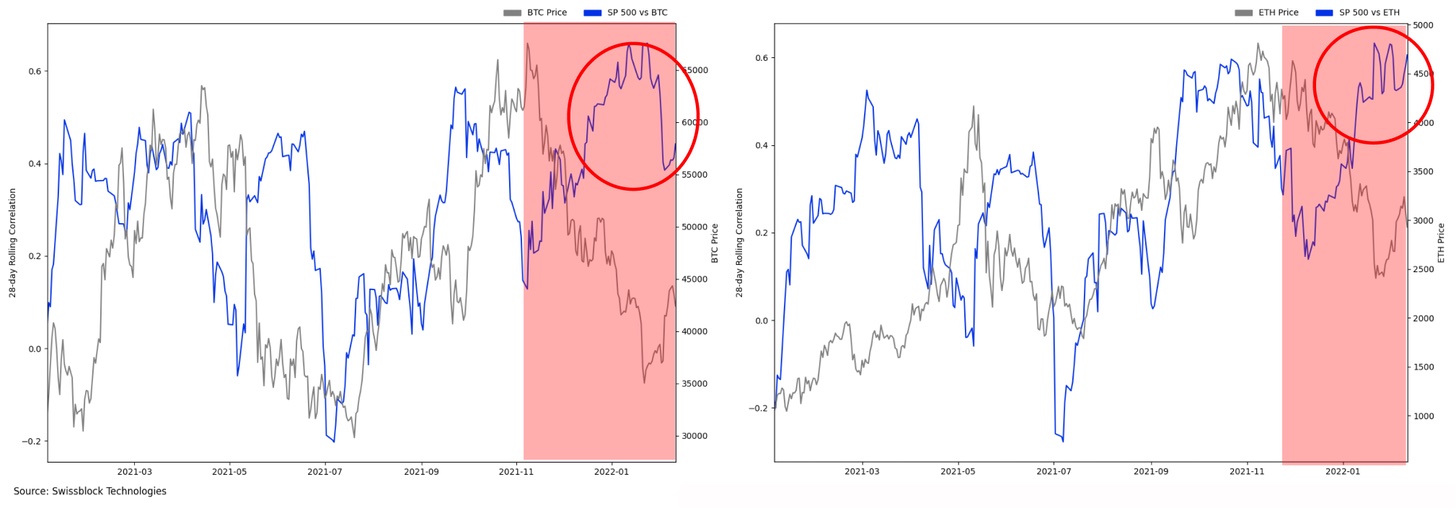
In the past few months, the correlation betweenstocks and Bitcoin were quite strong, and the major events affecting risky growth stocks spilled over into Bitcoin and other digital assets. The correlation between the S&P 500 and Ethereum remains elevated despite the slight divergence between the S&P 500 and Bitcoin in recent days.
Strong correlation between cryptocurrencies and the US stock market:
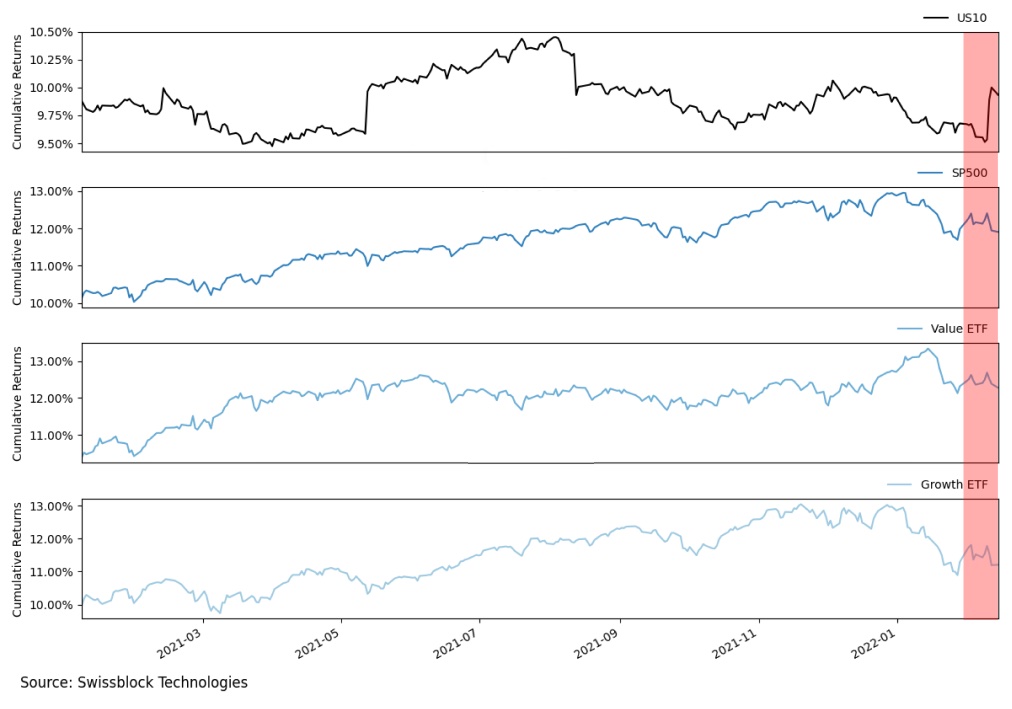
The market is at a stage whererecent macro events such as rising inflation and tensions between Russia and the West are already reflected in prices. However, the surge in US 10-year bonds shows that investors are rebalancing their portfolios and replacing sold fixed-income bonds. The portfolio balancing effect is due to the fact that the Fed accumulates supply of long-term treasuries, and investors raise the price, reducing the yield on 10-year bonds. This is not the case.
Surge in 10-year returns driven by fixed income replacement in investor portfolios:
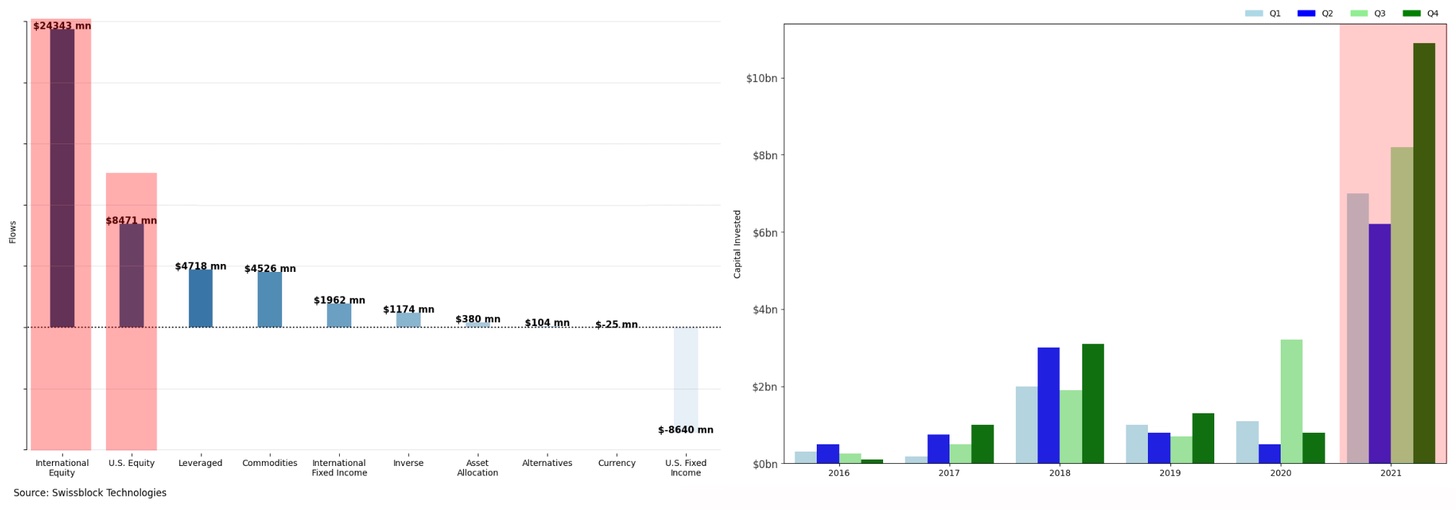
In January alone, the short-term debt marketsliabilities saw an outflow of nearly $1 billion as investors switched from chasing yield to seeking opportunities with higher Sharpe ratios. This implies a general tendency for investors to seek opportunities for higher returns. This thinking is clearly reflected in the net capital inflows that have occurred in undervalued international stock markets with relatively higher expected returns. In other words, investors are looking for opportunities to earn higher returns to offset the impact of unprecedented inflation on risk-free assets in the US. Capital released from bonds is channeled more into global equity markets than into U.S. equities. A similar trend can be observed for higher-risk assets, judging by the venture capital market: in 2021 alone, non-venture funds invested $300 billion in it.
Investors rotate capital in search of opportunities with the best Sharpe ratio:
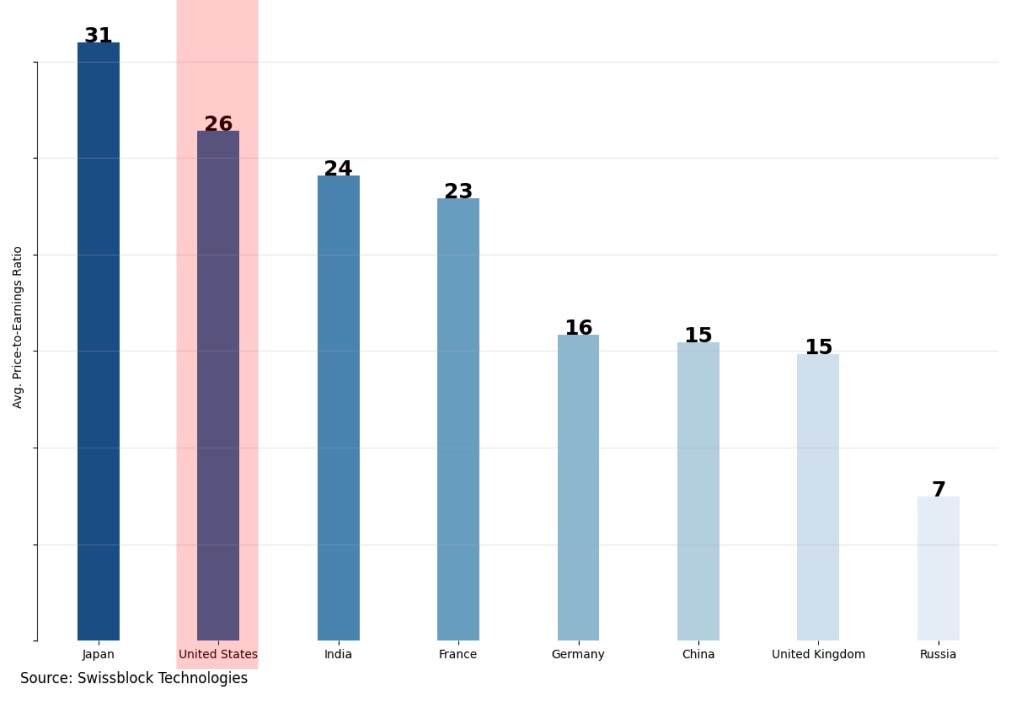
Flow of capital towards global marketsshares is potentially related to the overvaluation of the US market compared to the price-to-earnings ratio for the markets of other countries. Given the tight macro environment, investors are looking for risky opportunities that are not as heavily dependent on growth assets and are undervalued relative to the US market.
Capital rotation towards undervalued global equity markets:
A similar picture is observed in the stockthe US market as value stocks have outperformed growth stocks since the start of the year. Note the Vanguard Growth Index Fund ETF (right compass) moving averages falling due to selling pressure. On the other hand, VanEck MSCI International Value ETF (left compass) moves into the bullish (upper right) quadrant as the value of the VanEck MSCI International Value ETF rises.
Value ETF Outperforms Growth ETF:
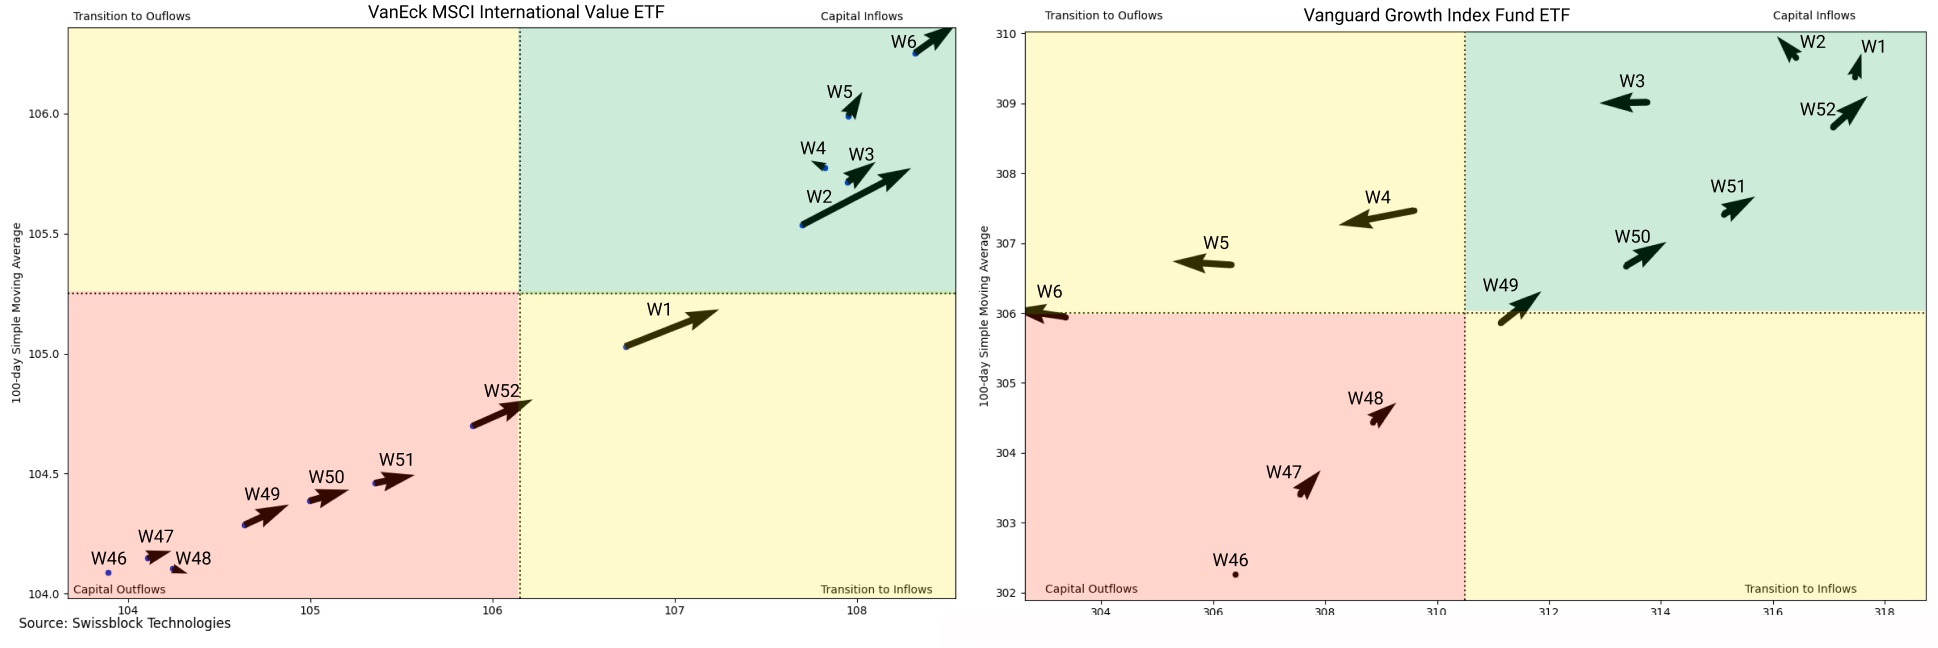
Comparing two moving averages - the 50-daythe x-axis and the 100-day y-axis, you can determine whether capital is moving into or out of an asset class. As the price declines, moving averages fall, indicating a capital outflow from the asset class, and vice versa.
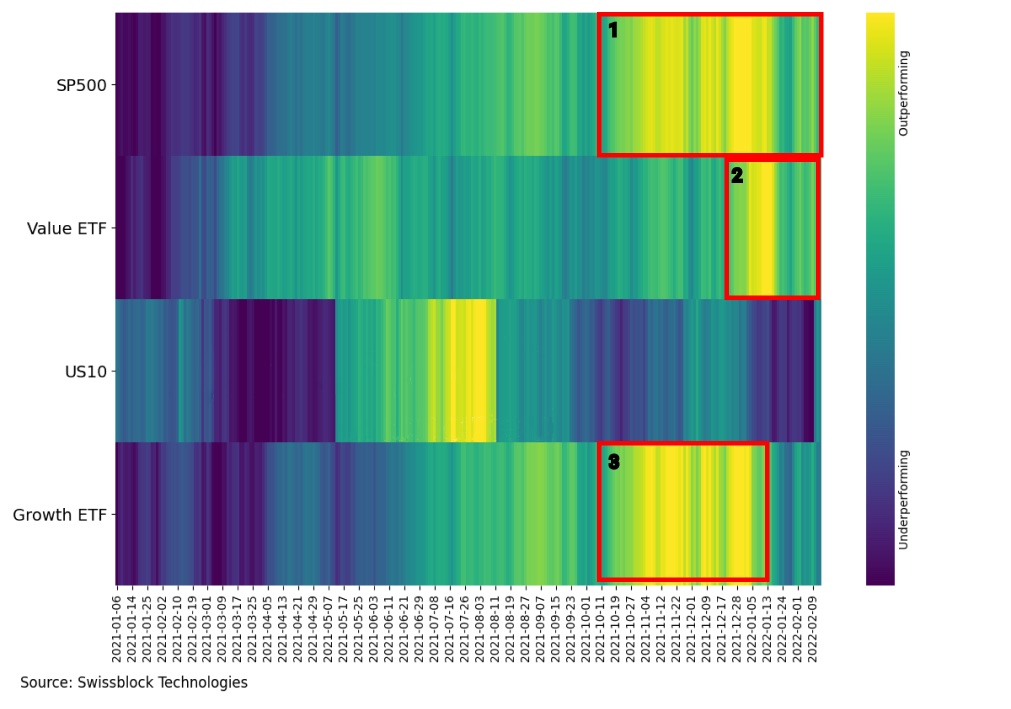
This rotation is also clearly visible instock market returns. The last six months can be divided into two broad areas: the outperformance of growth stocks (area 3) and value stocks (area 2). It is possible to identify periods when the S&P 500 returns (area 1) from August to September were driven by growth stocks, and when there was a rotation of capital into value stocks that determined the rest of the September returns.
Rotation of capital into shares of value in the US market:
Last time a similar market structure onagainst the background of expectations of growth in rates was observed in May 2013. The Fed has threatened to tighten policy after a multi-year cycle of monetary stimulus. Although the Fed did not ultimately make the expected raises, the market reacted with a marked rotation of capital into value stocks and a correction. This correction coincided with an increase in bond yields (meaning a fall in stock prices) and a subsequent rally in the stock market for the remainder of the year.
The potential tightening has led to a rotation of capital into value stocks, weakening bonds and a rally in the stock market:
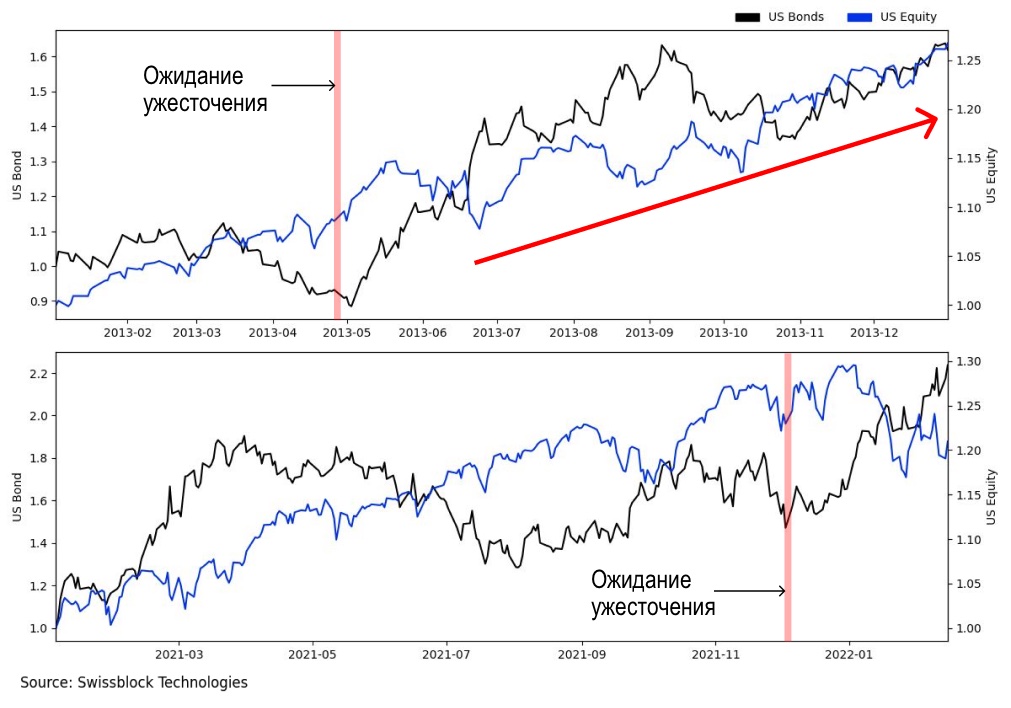
Expectations of tightening (increasing rates) leadin the rotation of capital from risk-free to risky assets. Bitcoin remains highly correlated with the US stock market. So if capital inflows into stocks push prices up, bitcoin will follow.
So what does all this mean for the market as a whole?We identified two major episodes of capital rotation as a result of expected Fed tightening. The first is a rotation from growth stocks to value stocks as real growth expectations are lowered by fear of inflation and a flat yield curve; the second is a strong rotation from bonds and other short-term capital markets to global and US equities.
These flows, combined with lower expectationsfuture growth and higher rates eased selling pressure. What we need to understand now is where the catalyst for the next movement will come from. One area to look at is retail open interest on put options. The longer the market stays at current levels and the closer the expiration date is, the faster brokers will need to buy the underlying asset to balance their books, which will increase pressure on outstanding put options. This can, under certain circumstances, create the right conditions for further growth of the shares.
Purchases by retail investors of put options push brokers to buy the underlying asset:

The same can be said for Bitcoin.Notice how the put/call open interest ratio has increased as Bitcoin has recovered to ~$40k. The current increase in demand for put options has caused call option premiums to rise to "overvalued" levels, which was not the case from the end of 2020 and the fall in May 2021. Investors' heavy buying of put options creates upward pressure on the underlying asset as brokers and market makers need to balance their books. This is a semi-ideal setup for brokers and large players, as they get the opportunity to buy at a discount along with long-term investors and hodlers during a period when the risk of a pronounced correction is reduced (light blue area of the indicatorBitcoin Risk Signalfrom Swissblock).
Bitcoin is preparing for the third wave of growth:
What's next?
Spot volume in the crypto market remains low,as trading volumes, overall and for altcoins, decreased compared to August and May 2021. In the crypto market one can observe the same shift in “value assets”: indicatorAltcoin Cycle Signalfrom Swissblock indicates that the marketcontrols Bitcoin (yellow area on the right chart). However, altcoin trading volumes have been accelerating since Bitcoin recovered and held above $40K. Notice how altcoin volumes increase towards the end of January (arrow on the left chart).
Spot trading volumes remain low:
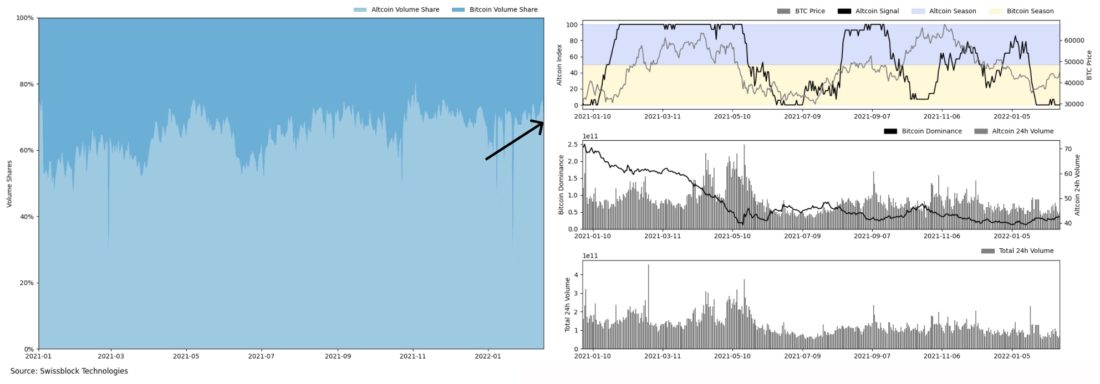
Altcoin Cycle Signal from Swissblock points todominance in the crypto market of bitcoin or “alts” based on the profitability they demonstrate. We extended this analysis by separating the share of bitcoin and the share of altcoins from the total to determine if trading demand increases returns.
So what have we come to?First, the market situation is fundamentally different than in January 2021. Short-term holders are capitulating while long-term investors and hodlers are buying Bitcoin at a discount. More experienced subjects with deep pockets dominate the market while retail investors wait for the bull trend to resume before re-entering the market. Bitcoin is bracing for another wave of bullishness as the risk of a pronounced correction is waning, on-chain fundamentals are strong and the macro environment is shifting back towards riskier assets as investors rebalance their portfolios towards global equity markets. Bitcoin dominates the crypto market. However, as capital flows into crypto assets, more and more of it will flow into altcoins.
Bitcoin is preparing for the next wave of growth:
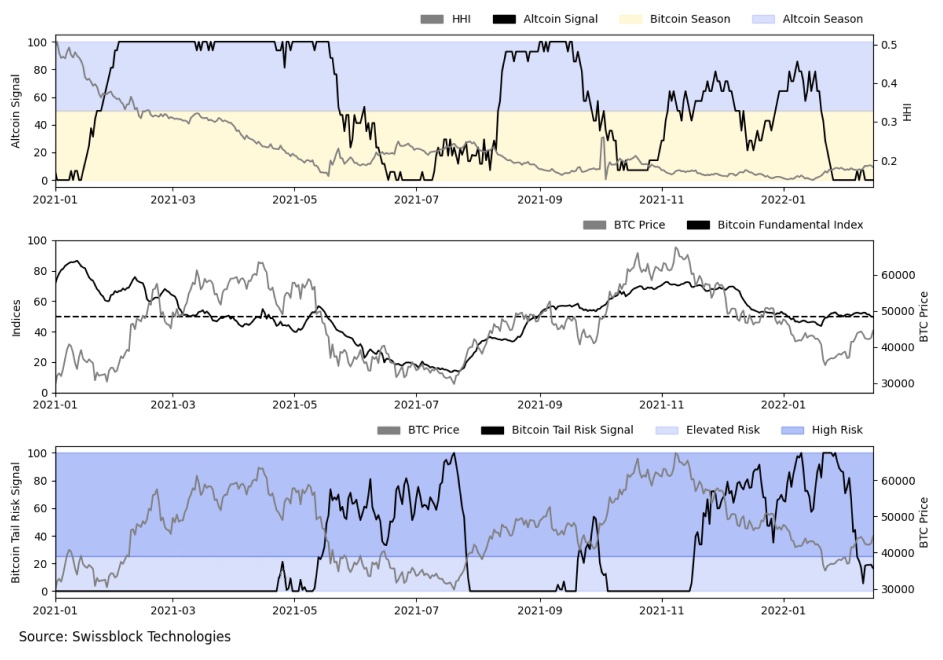
We combined signals from Swissblock toget a holistic view of the market, allowing us to analyze the market in terms of network health (Bitcoin Fundamental Signal), risk level (Bitcoin Risk Signal) and return (Altcoin Cycle Signal).
BitNews disclaim responsibility for anyinvestment recommendations that may be contained in this article. All the opinions expressed express exclusively the personal opinions of the author and the respondents. Any actions related to investments and trading on crypto markets involve the risk of losing the invested funds. Based on the data provided, you make investment decisions in a balanced, responsible manner and at your own risk.

