Bitcoin's Dominance Index is a metric that shows how strong the marketcapitalization of BTC compared to other cryptocurrencies.
The way to calculate it is quite simple - you just need to divide the market cap of BTC, expressed in dollars, by the total market cap of all cryptocurrencies, including BTC.
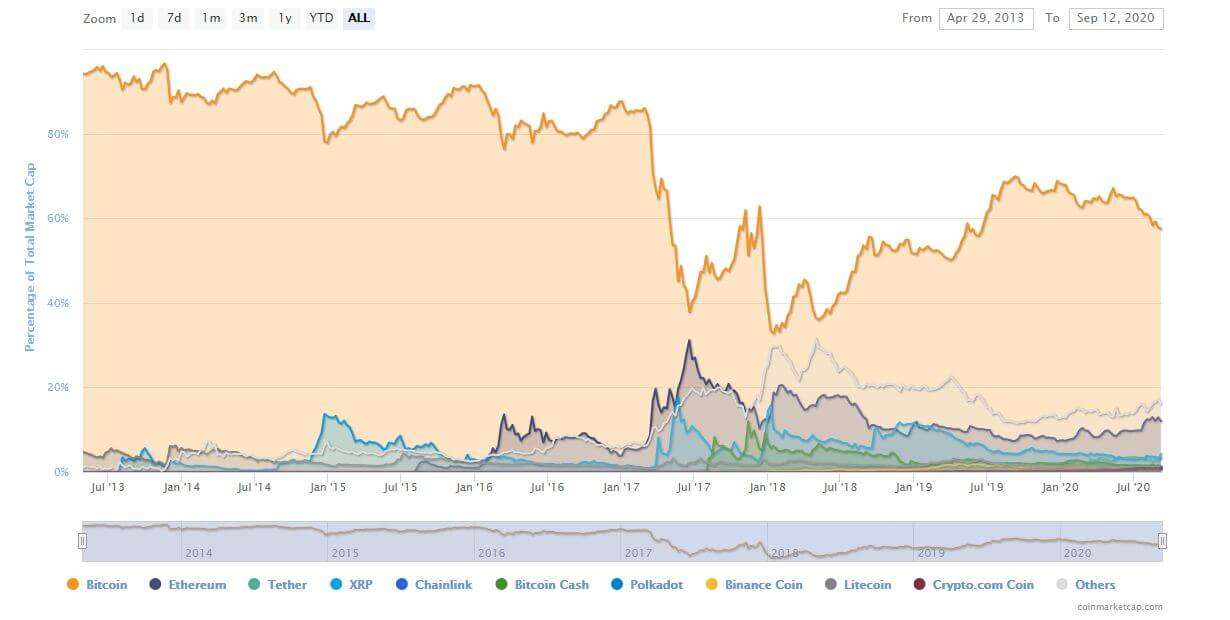
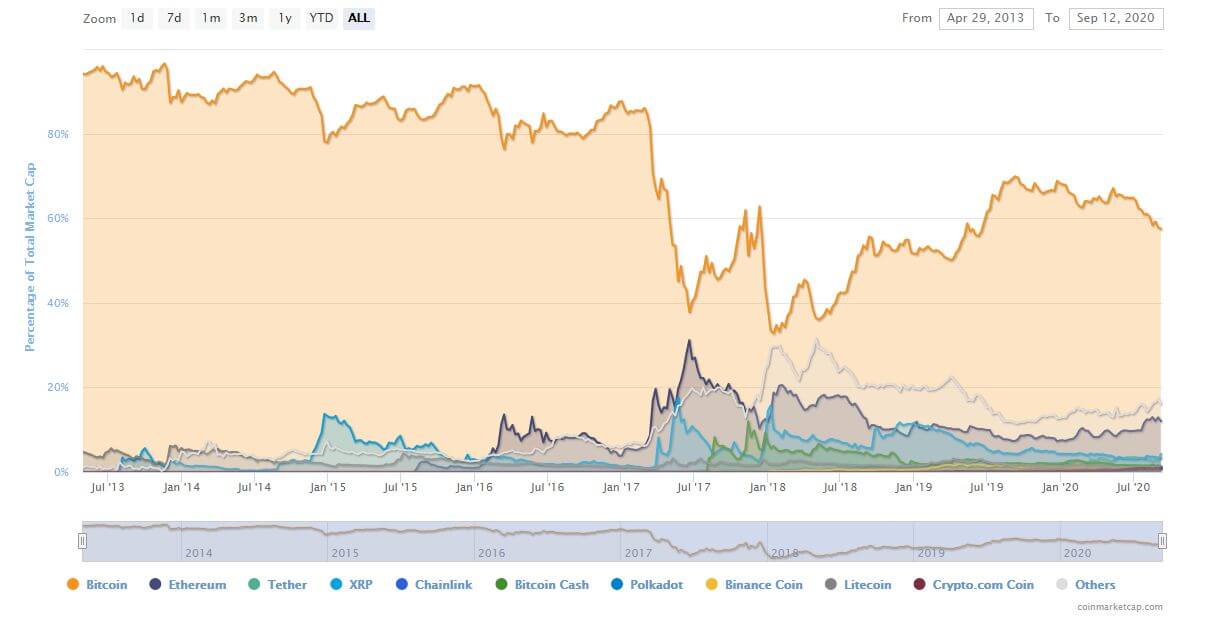
For example, now, according to CoinMarketCap,Bitcoin's market capitalization is about $ 190 billion, and the total market capitalization of all cryptocurrencies is approximately $ 334 billion. Therefore, 57% of them belong to Bitcoin, and this percentage is the amount of its dominance.


It's also worth mentioning that the market capis calculated by multiplying the dollar value of one coin by the total number of tokens in circulation. Accordingly, if there are almost 18.5 million BTC in circulation at a price of just over $ 10,000 each, we will just receive $ 190 billion.
At the beginning of 2020, it was almost 70%, but then capital began to flow into altcoins, in particular ether and DeFi tokens, such as Polkadot (DOT).
Thus, the bitcoin dominance index is not a fixed value, it changes depending on:
- BTC price changes;
- changes in altcoin prices;
- the emergence of new altcoins with significant market capitalization.
As we can see, new coins are constantly appearing.in the market, sometimes gaining great and, as a rule, temporary popularity. It turns out that the bitcoin dominance index is difficult to perceive as a good indicator of market trends.
However, under certain market conditions, it can provide information that is better perceived as a probability.
For example, after a rapid decline in dominanceBitcoin is followed by an increase in alcoins, but when the BTC price recovers, money flows back to the main cryptocurrency at the same rate. It should be noted that very rarely the reasons for the growth of altcoins are associated with the infrastructure successes of the project, most often it is about pump and dump schemes and financial bubbles.
Interestingly, in 2017, in just four months, BTC's dominance fell from 85% to 38%, then it rose again to 62%, reaching its lowest level on January 15, 2018 at around 33%.
Since then he has never returned to 85%, sohow a lot of cryptocurrencies appeared on the markets, drawing off part of the funds. Currently, this figure fluctuates in the range of 50-60%, and from the point of view of common sense, we are unlikely to expect any major changes.

Rate this publication


