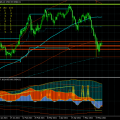
The medium-term correction of the long-term trend continues. As noted earlier, the goals of this correction arelevel 40026 were implemented, and in excess.Moreover, the market also tested the lower boundaries of the long-term (support level 34972) and main (support level 37148) trend channels, forming a new low at the level of 29927, which, within the SWT method, is interpreted as technical support for a short-term trend. As a working forecast, we the scenario of market recovery from a fairly wide support cluster zone 29927-34972-37148-40026 has been accepted, and the cancellation or suspension of the implementation of this scenario will be a breakthrough of the support level 29927. The market has already made several attempts to go up, but so far these attempts have not received development. In the current At the moment, Bitcoin is strengthening again, remaining in the weekly trend channel 29927-43402 and despite the increase in local volatility, no significant changes have yet occurred.

The main trend remains upward; the long-term downward medium-term correction continues with signs of growth recovery.

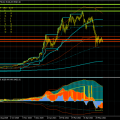
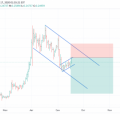
The medium-term trend wave again marked a corrective upward reversal, shown by the indicator marked with an arrow in the lower chart window.

We noted earlier that before starting a newthe growth cycle may be released downward in order to unload the market from accumulated short-term longs with high risks. And at the beginning of this week, an attempt at such a release took place, but did not develop. The market stopped at the border of the short-term trend volatility channel - the turquoise line marked by the lower arrow, and from this border the quotes went up quite quickly and quite far by the standards of recent weeks. They left, but stopped at the upper boundary of the volatility channel of the weekly trend cycle - the red line marked by the upper arrow on the chart. Only the market knows how the current pause will end, with a new test of the lows or a breakthrough of the upper boundary of the volatility channel of the weekly trend. And we continue to adhere to the growth scenario. Good luck!
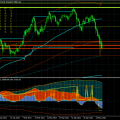
Resistance levels: 43402, 50804, 64810, 67959, 71361, 87926.
Support levels: 40026, 37148, 34972, 30909, 29927.
The analysis was performed based on indicatorsSWT method
Read this:
 Bitcoin – 06/07/21. Consolidation before growth.
 Bitcoin – 05.27.21. When to start shopping?
 Bitcoin – 05.22.21. Where can I buy a correction?
 GBPUSD continues to decline. BTCUSD is going up.
 Trading signals! | Ripple: flag inside the channel