This article is based on a tweet thread with a brief report on the global money supply for Q2 2019,published by the authors of the educational cryptoeconomic podcast Cripto Voices. In it, they give their calculations of the world money supply and the place of Bitcoin among other monetary bases.
To measure the relative success of Bitcoinyou need to choose the right “barometer”: it is important to distinguish between the total monetary base and the various aggregates of the money supply, since some of them include requirements for the monetary base, which can significantly distort the result. By monetary base we mean physical hard money, such as gold and silver, as well as bank reserves (digital dollars, yen, yuan, etc.) controlled by central banks and through them accessible to the entire banking system. It is with this aggregate of monetary aggregates that Bitcoin should be compared. Fortunately for us, the authors of the study deeply studied the topic, completed all the most difficult work and presented the result in a compact and visual form.
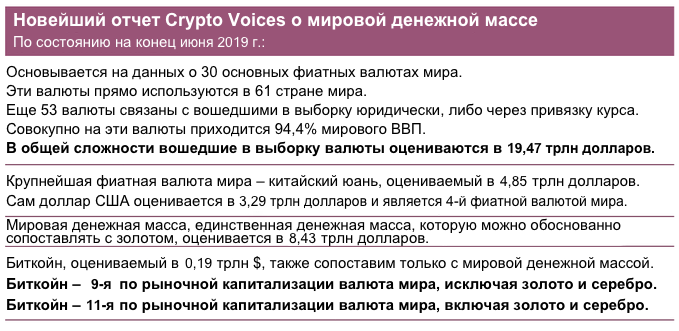
The picture below shows a fragment of the report onglobal money supply for the 2nd quarter of 2019. (The report for the 1st quarter is here.) This is the only money supply with which 21 million bitcoins can reasonably be compared. Bitcoin is by far the 11th largest currency in the world. About what this means, and will be discussed below.
Gold and silver are the monetary bases of the past. Fiat money issued by governments is today's monetary base. They include both cash and their digital equivalent. Bitcoin may become the monetary base of the future. Before we get into the charts, it’s important to dispel some common misconceptions about money.
First, when talking about the market valuation of Bitcoin, everyone usually falls into a discussion of either a "narrow" or a "broad" money supply (M1/M2/M3), which is not true, since they essentially representFor what exactly?
Fiat monetary bases today include both physical (banknotes and coins) and digital (bank reserves at the central bank) components.The digital part can be likened to the "account" that each bank holds at its central bank.This and only this total money supply can be economically compared to 21 million BTC.
Another common mistake isthat when comparing Bitcoin with the world of analogue money, people often look at simple charts like US M1 or Eurozone M2. In addition to the fact that this is not true as a comparison with M1 / M2 / M3, this method is also incorrect because Bitcoin is global, and US M1 and Eurozone M2 are not.
We cannot determine the depth of anythere was a market simply by looking at the monetary base of one or two nation states. The selection must be global. Therefore, we prepared a comparison with a sample of 30 major world currencies with a floating rate. This is what the real volume of global fiat money bases looks like since 1970.
Monetary bases: the supply of fiat money since 1970 (in trillion $).
This sample of 30 major base currencies in the mostIt accounts for 95% of global GDP, covering 114 countries and 83 currencies. Why? One reason is the euro. The other is that all other countries either use one of these top 30 currencies directly, or are legally linked to them, or their domestic currency rate is tied to one of the main world currencies.
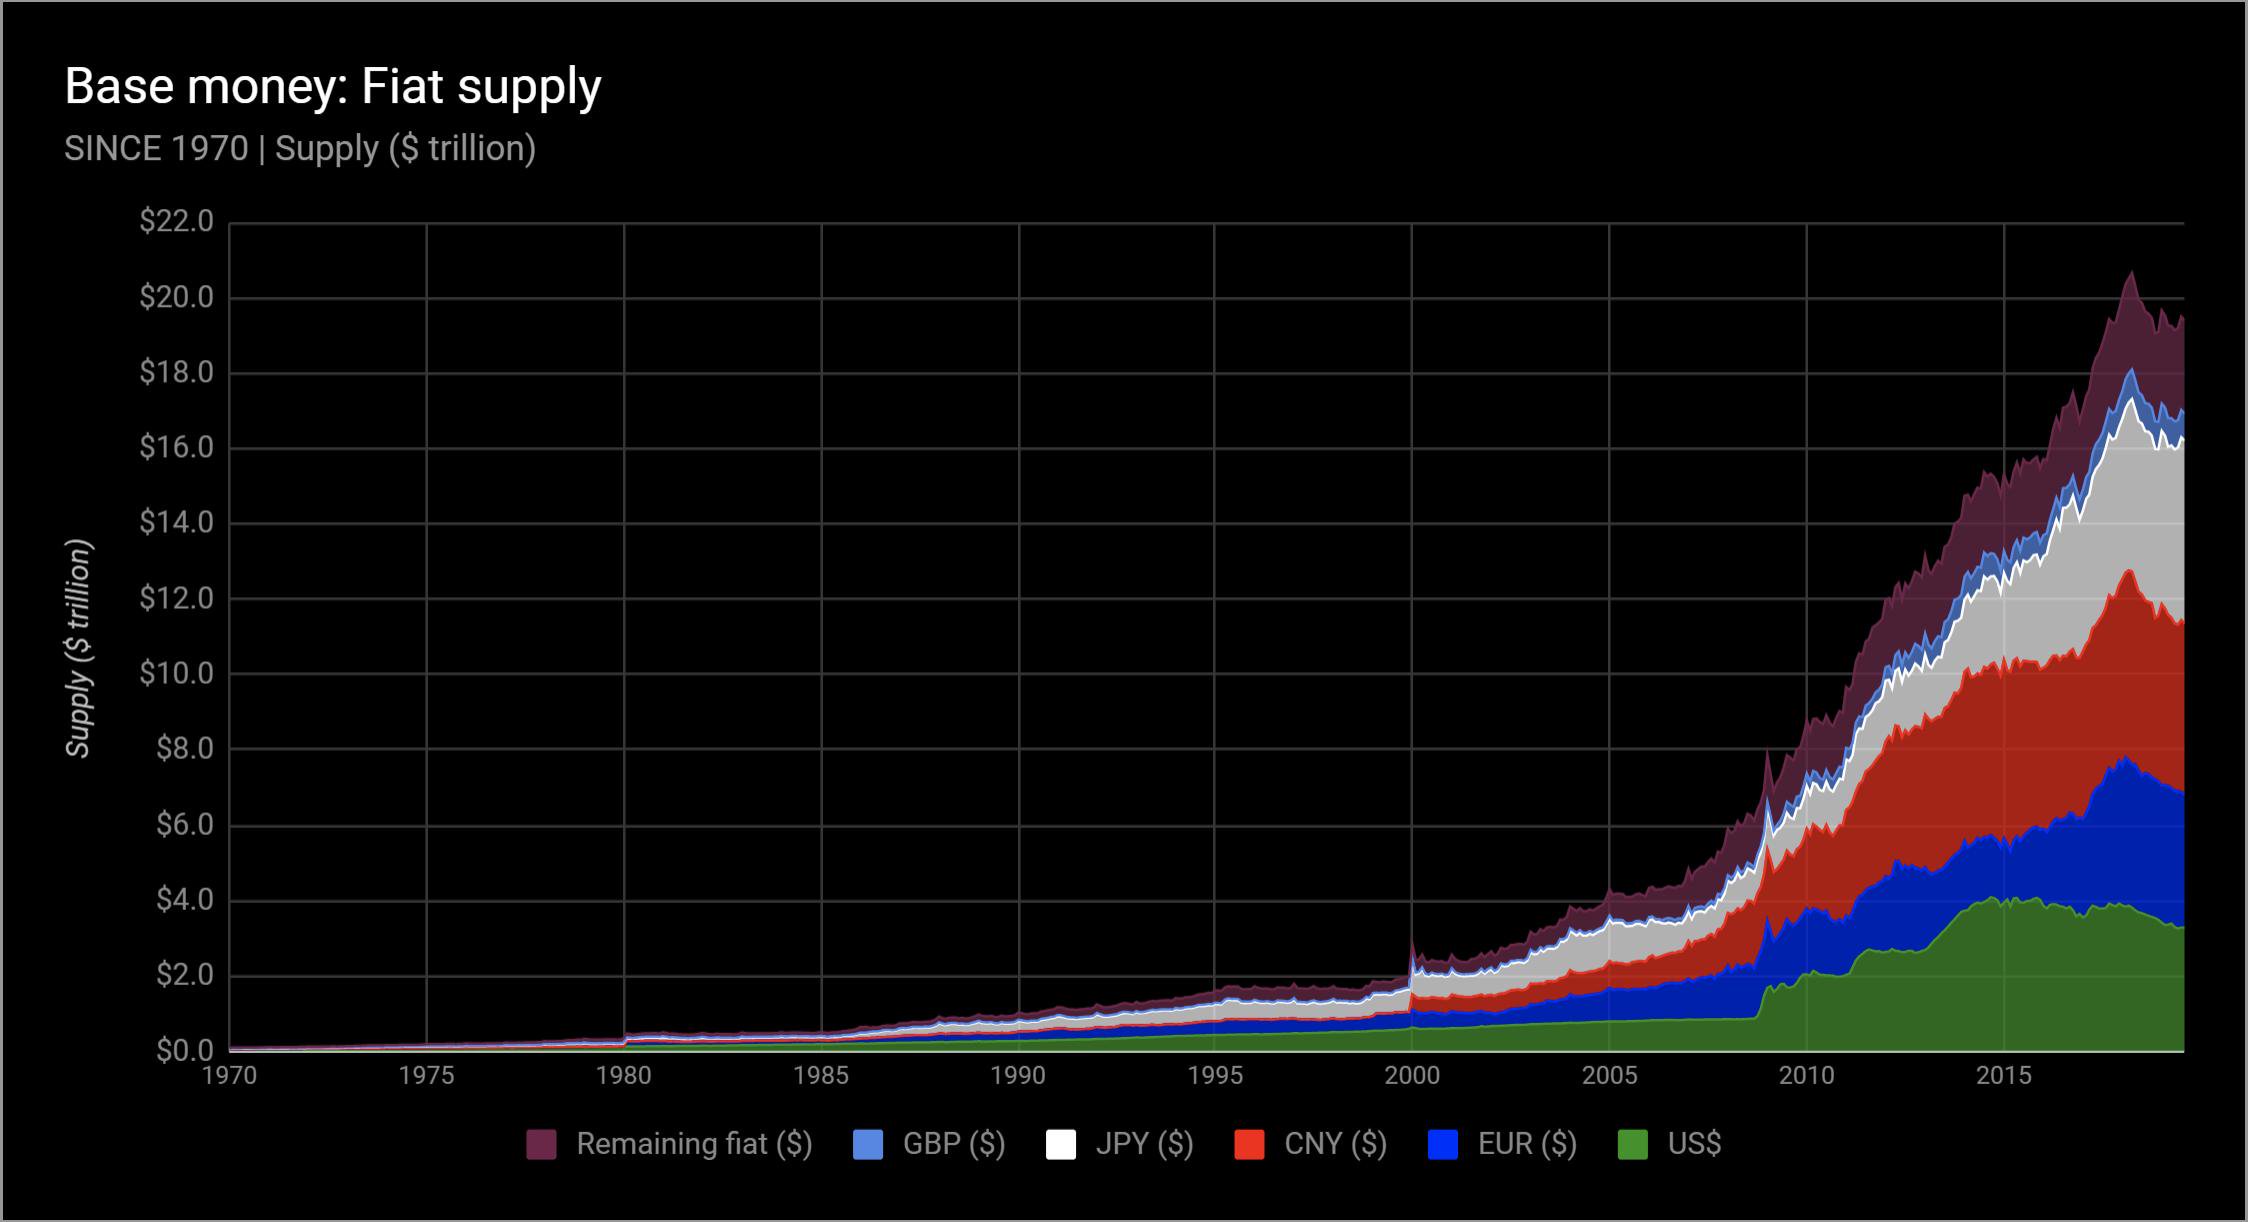
Let's take another look at the world curvemonetary base since 1970, but this time we focus on the gap between physical and digital money. Please note that after the 2008 financial downturn, the percentage of bank reserves (digital printing press) sharply increased.
The gap between the volume of digital and physical money (in trillion $). Bright area - reserves (digital component); dark area - currency (physical component); line is the weighted average.
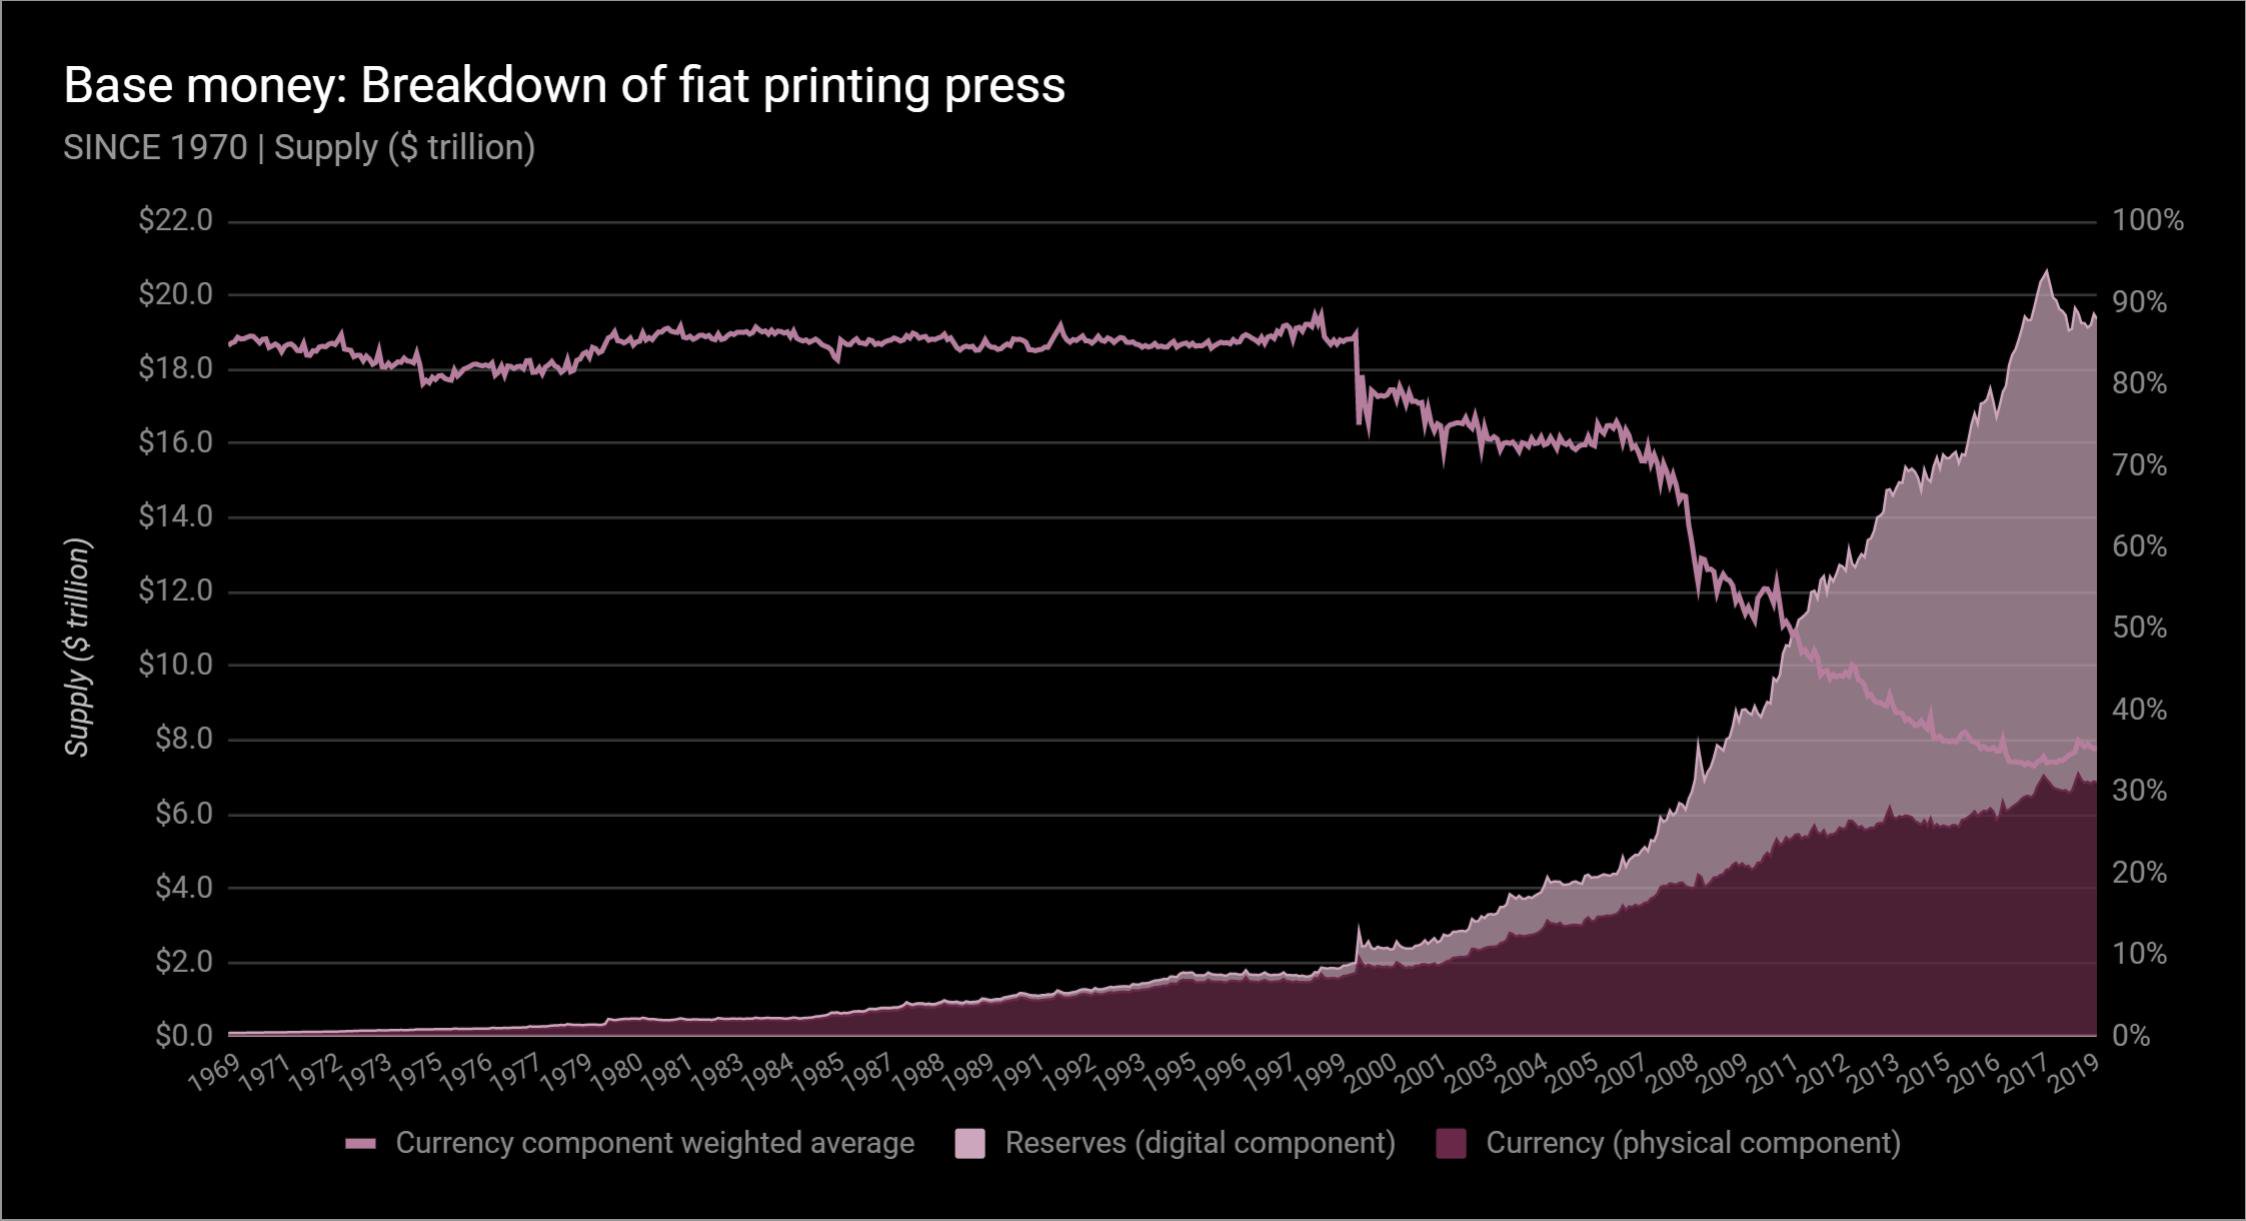
And on the current distribution of the "printing press" of each of the countries included in the top 30 in terms of the size of the money supply base, the proportion of physical and digital money for each currency.Here's the graph.
Printing machine malfunction: an unprecedented percentage of the total money supply. Light columns - reserves (digital component); dark columns - currency (physical component); line is the weighted average.
And the last thing about fiat money.The money supply base today actually representsIt is also the basis for the monetary monopoly schedule, since the monetary base is the source of the "printing press" and is controlled by theIf you want to know where to look for this data, the answer isSimple: on the balance sheets of every central bank!
Now let's look at gold. Although central banks own gold, it is no longer a monetary base. This is a separate topic, which we will not dwell on today, but nevertheless it is important to have an idea of the size of the world gold reserve both in its own market units (ounces) and in today's currency units (US dollars).
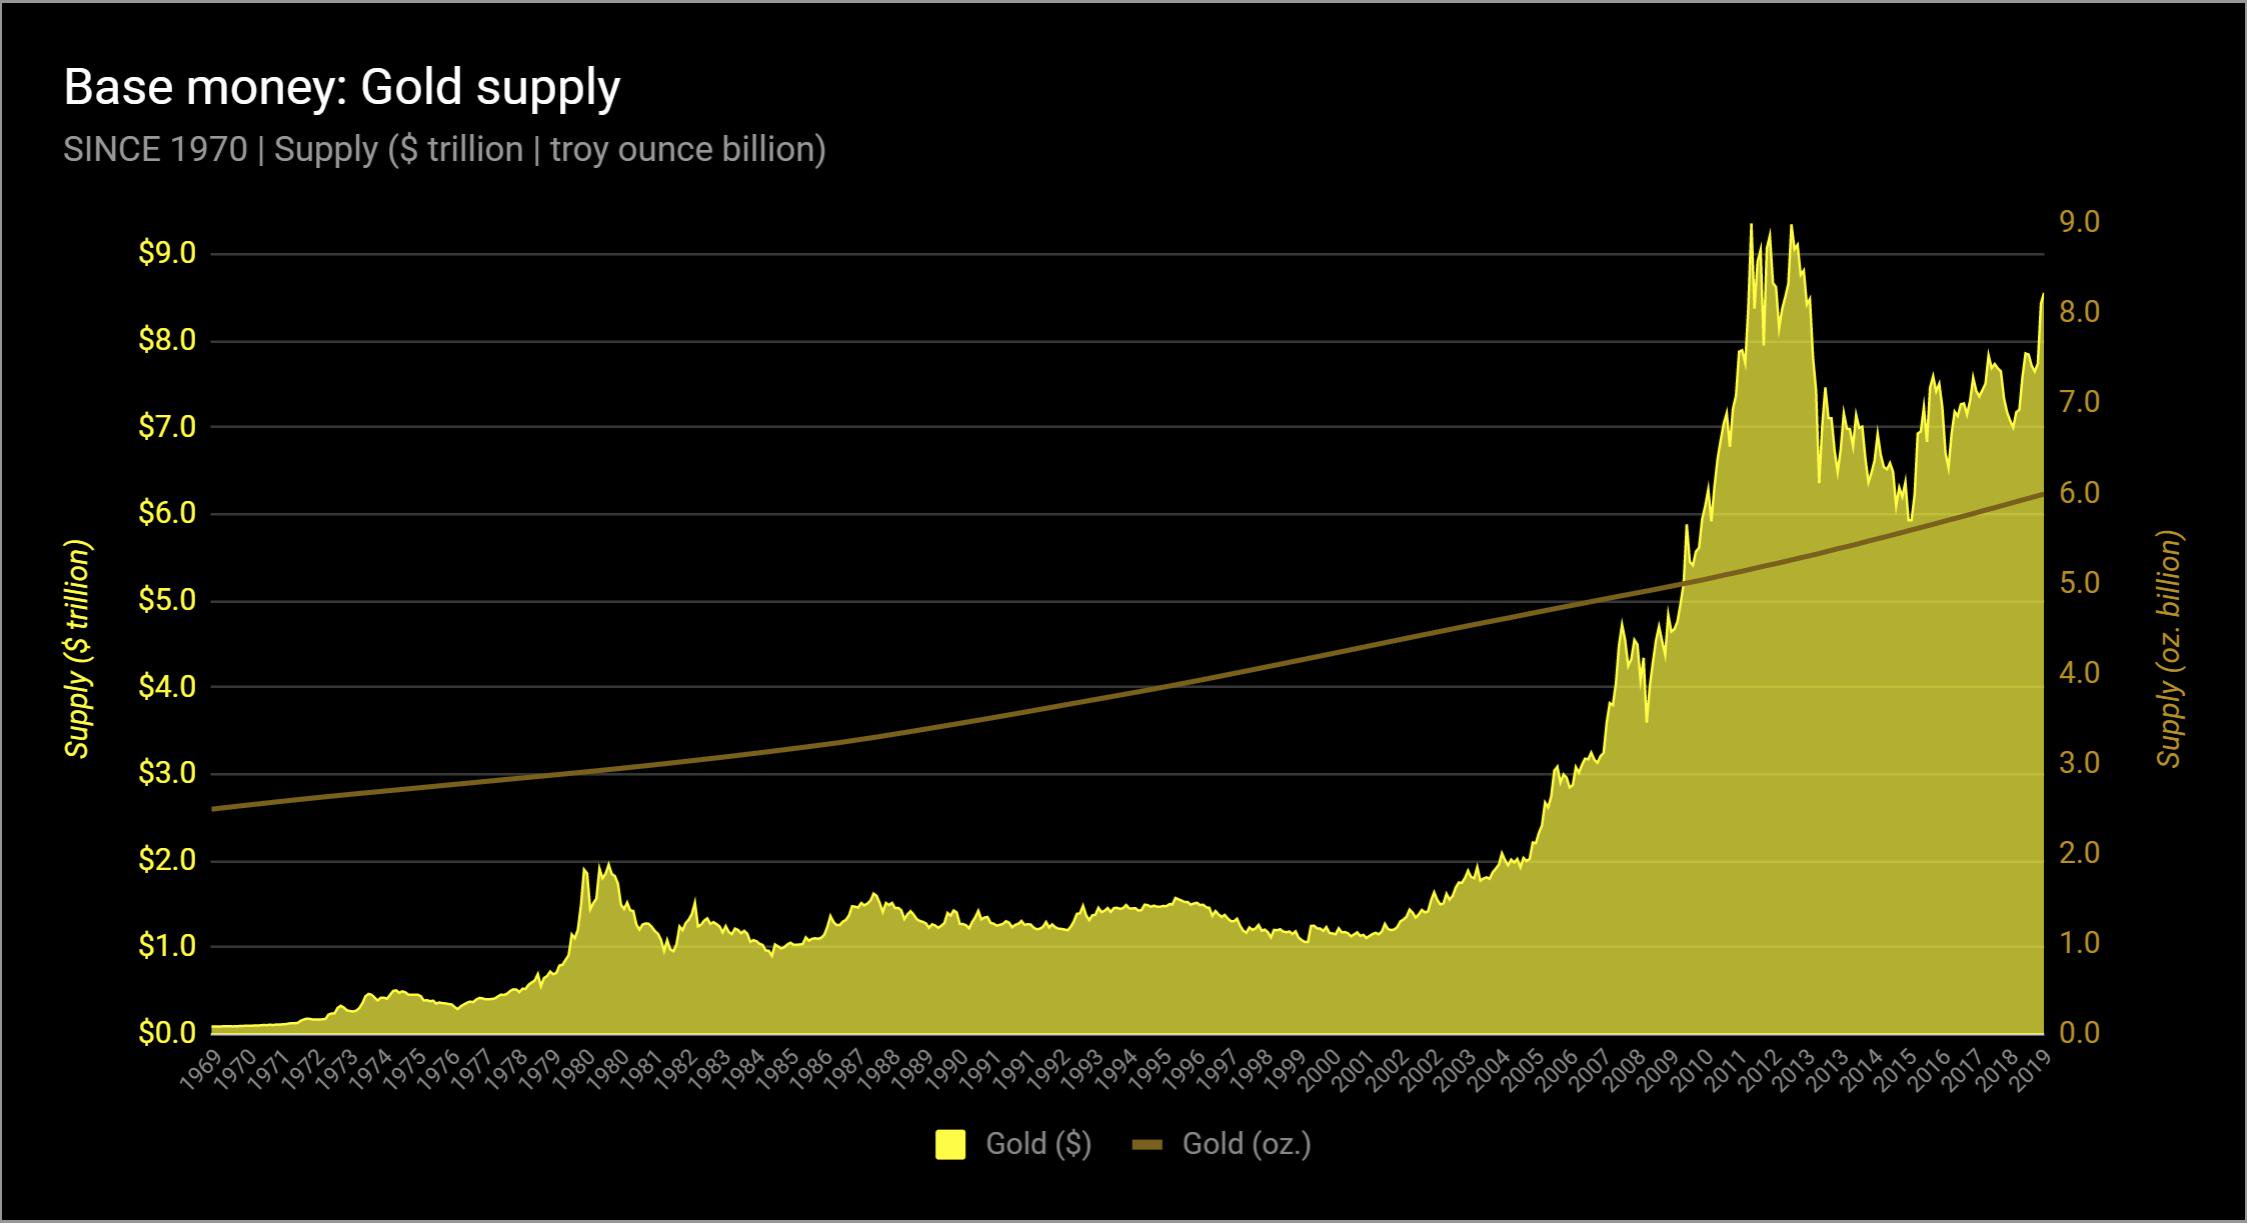
Gold supply volume (region and left scale in trillion dollars; line and right scale in billion ounces).
Now silver. It is true that today more than 50% of the demand for silver falls on industry and is not monetary in any way. But silver was the monetary base long before gold. A total of 50 billion ounces of this material has been extracted by humanity, and its supply curve is worth a look. Here it is, since 1970
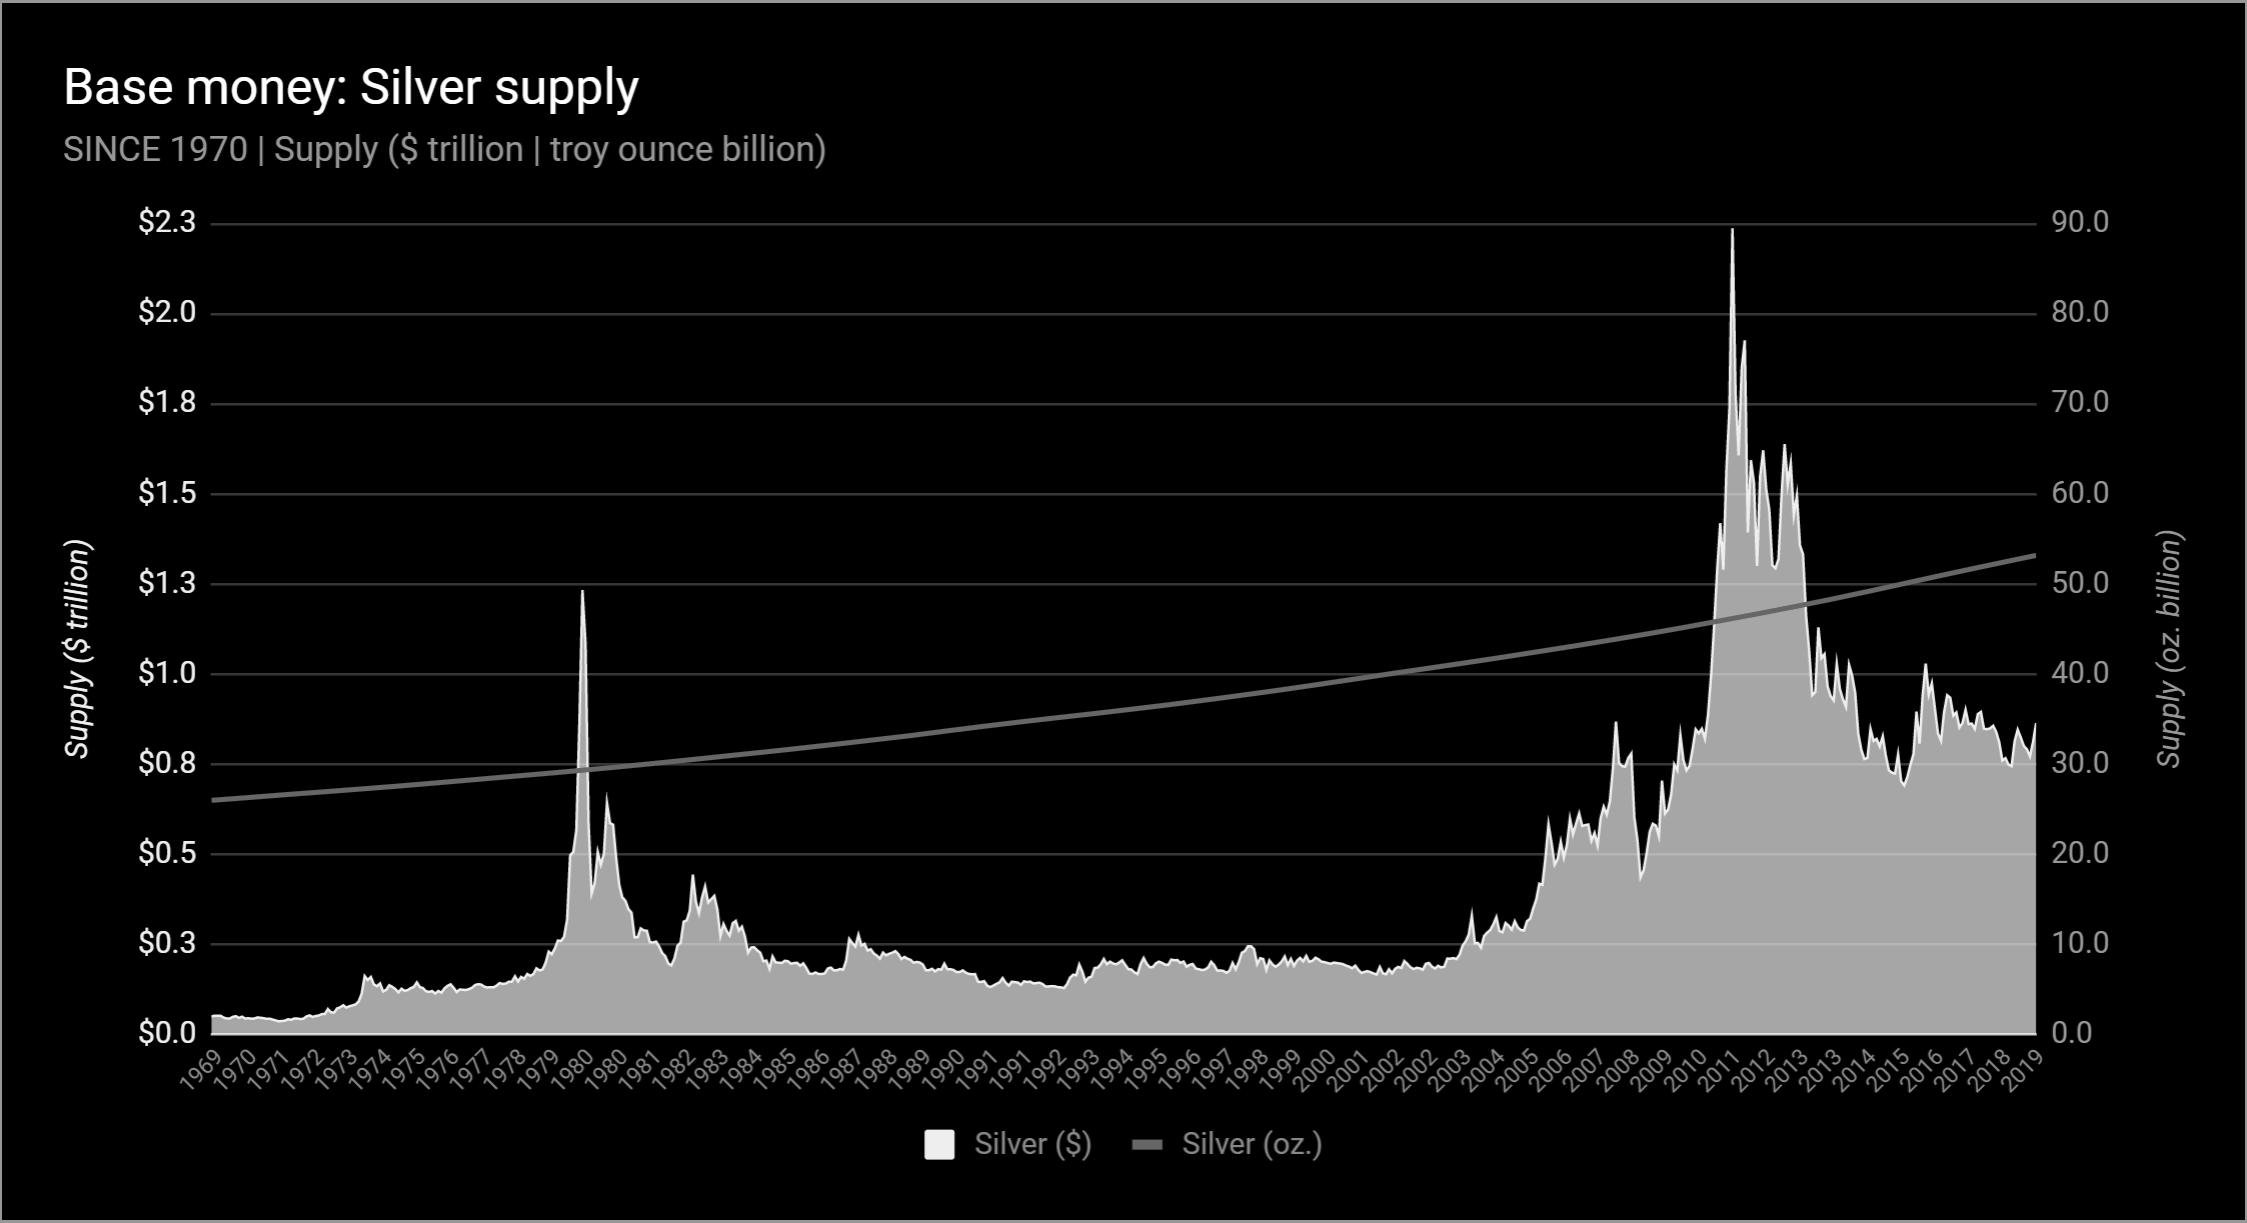
Silver supply volume (region and left scale in trillion dollars; line and right scale in billion ounces).
And finally, Bitcoin. Bitcoin's issue volume is limited at the protocol level to 21 million coins, which will be issued before 2140. Bitcoins can circulate as the base money of the future. Here is a graph of the global supply volume in its own market units (BTC) and in today's current monetary units (US dollars).
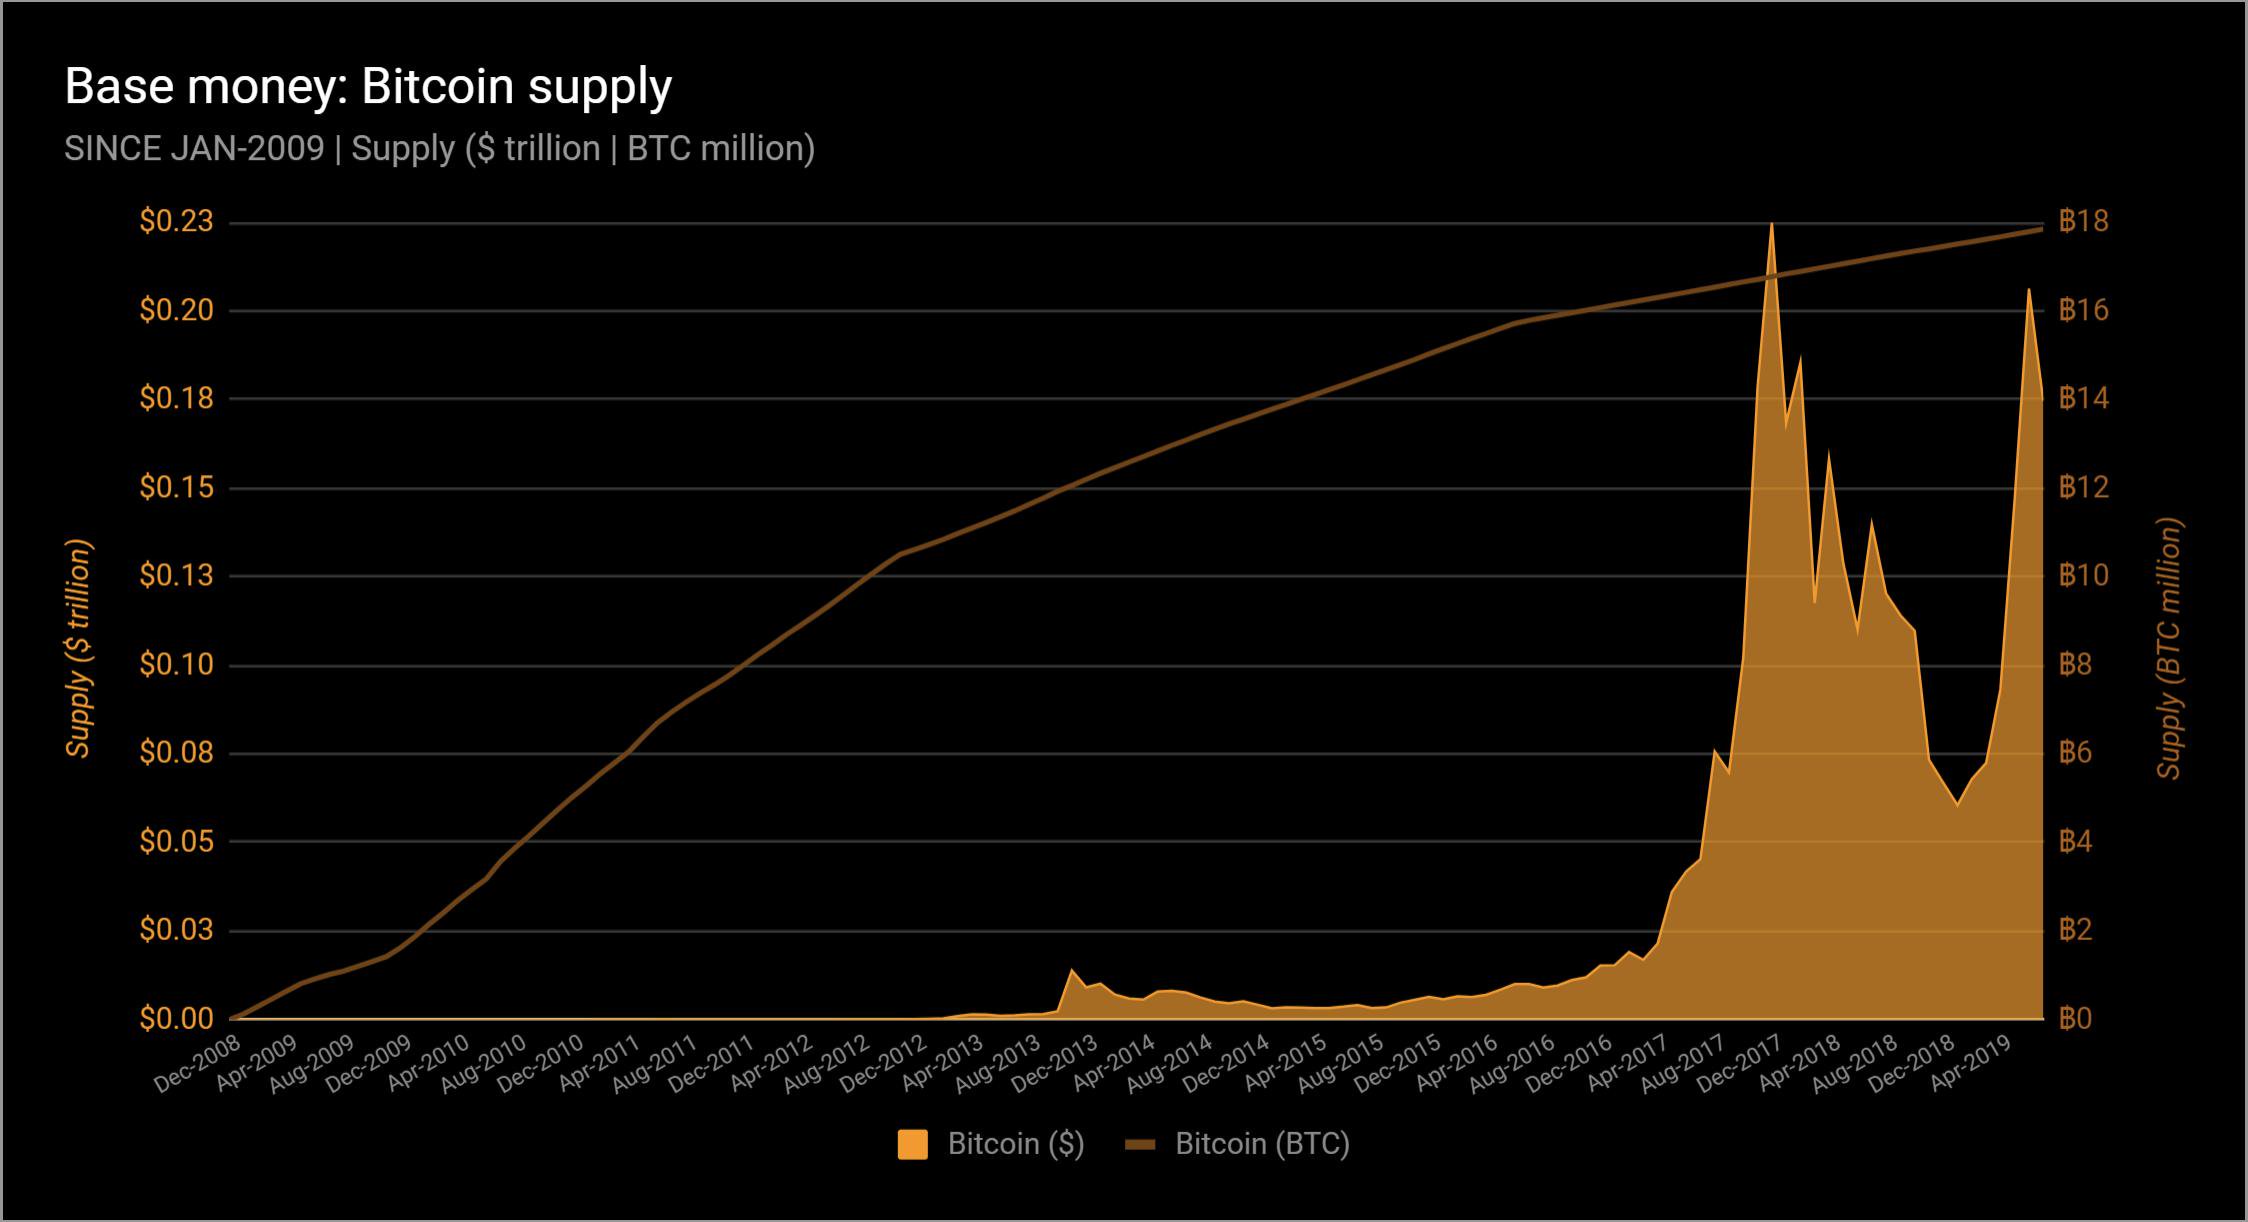
Bitcoin supply volume (region and left scale in trillion dollars; line and right scale in million BTC).
Now let's put them all together - the worlda base of fiat money, gold, silver and Bitcoin. Without any further comments on this, simply note that the Bitcoin system is 11th among all monetary units in the world and 9th if gold and silver are excluded.
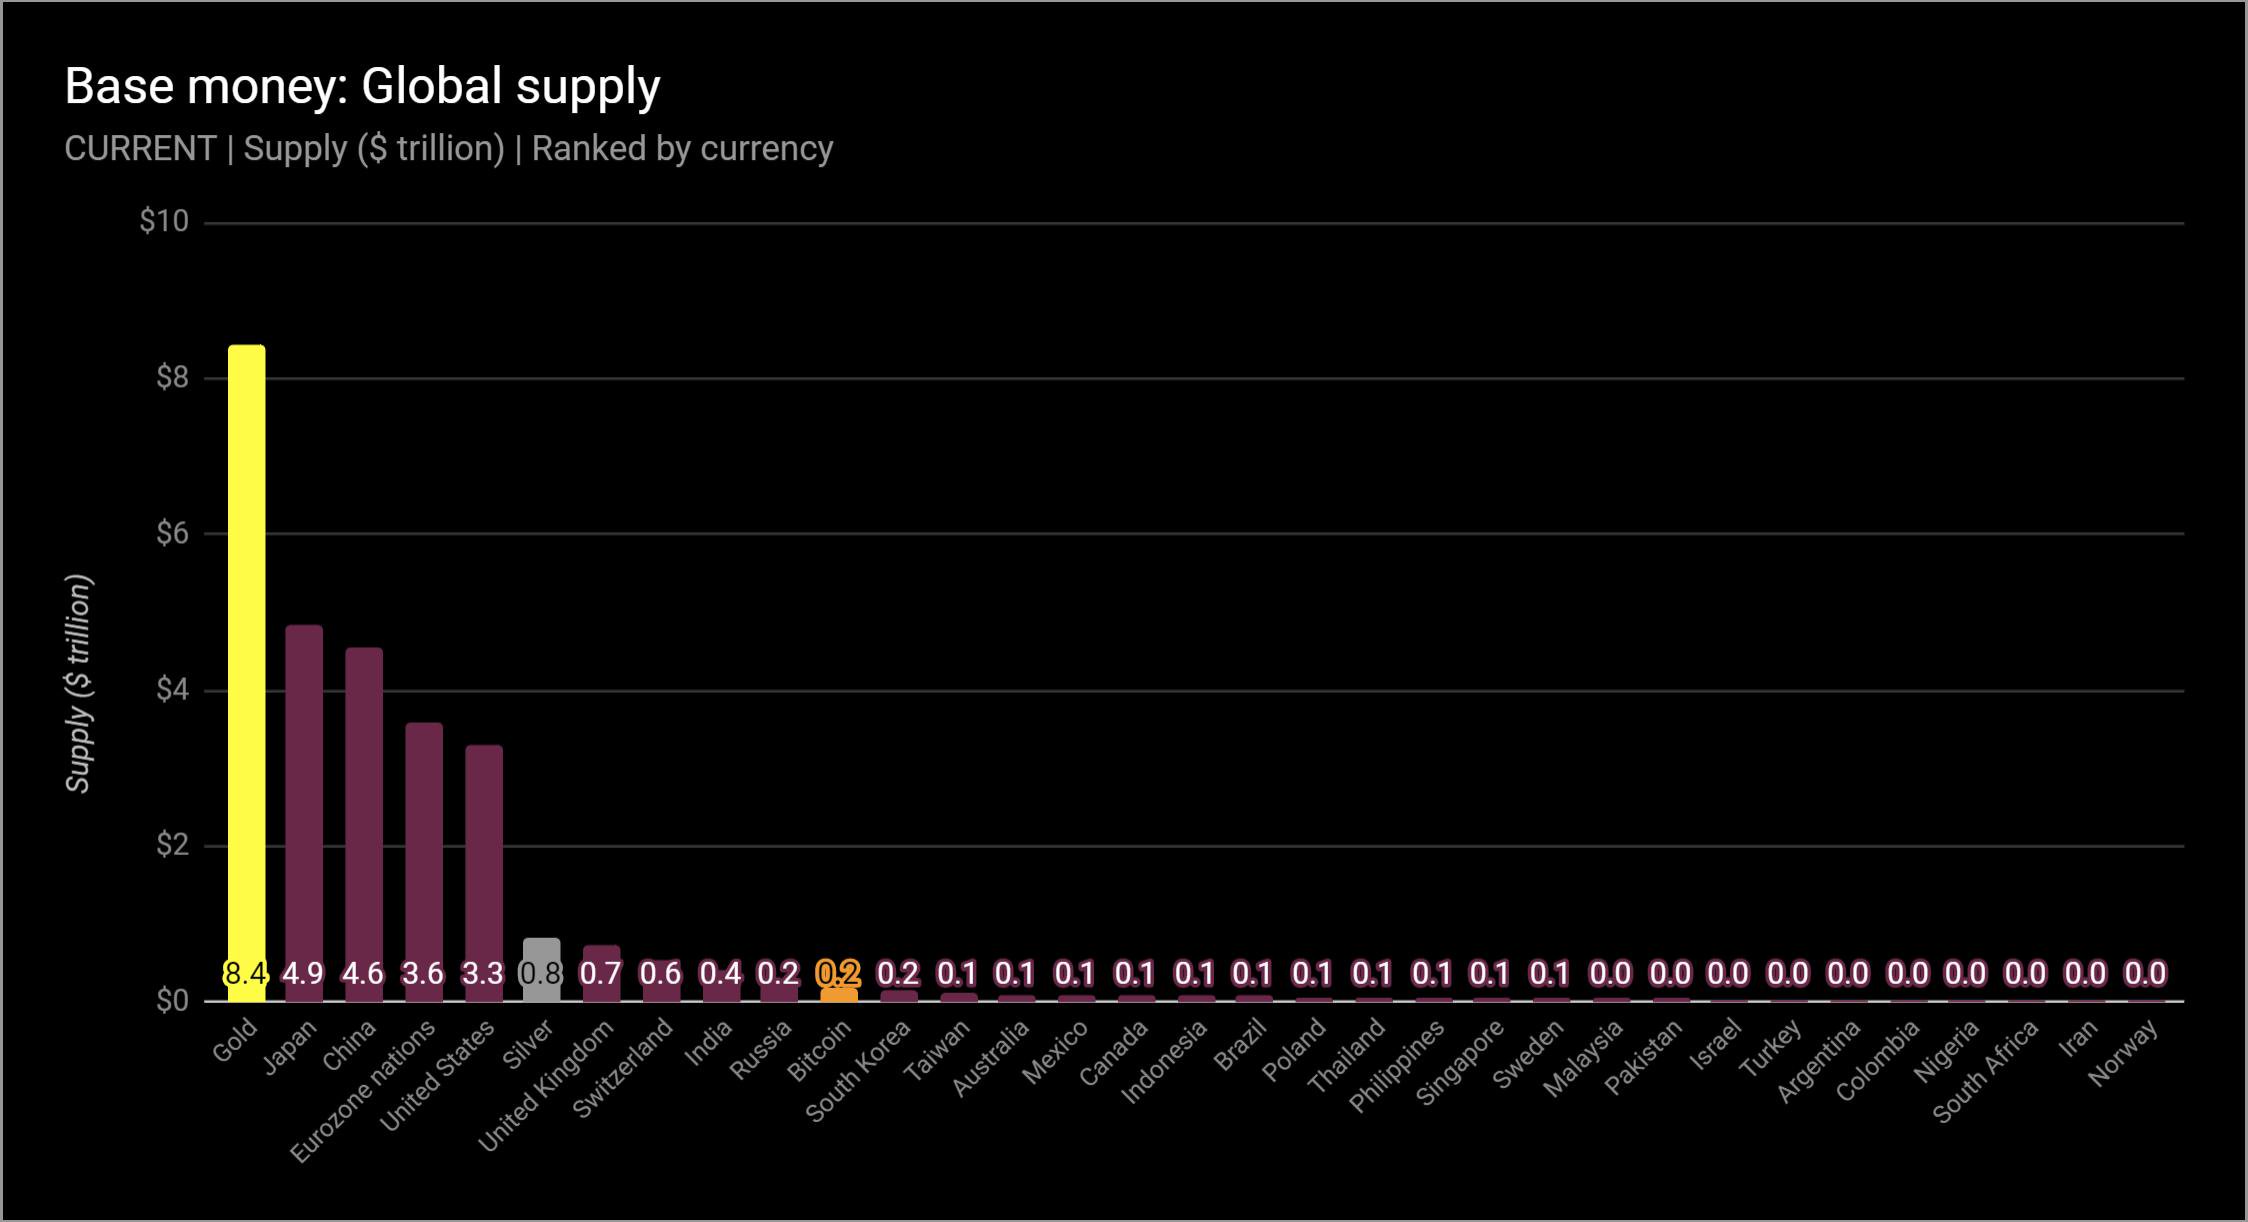
Monetary bases: world supply volume (in trillion $).
And for a broader perspective, we present a table with historical data on the position of Bitcoin in the ranking of global monetary systems since 2009.
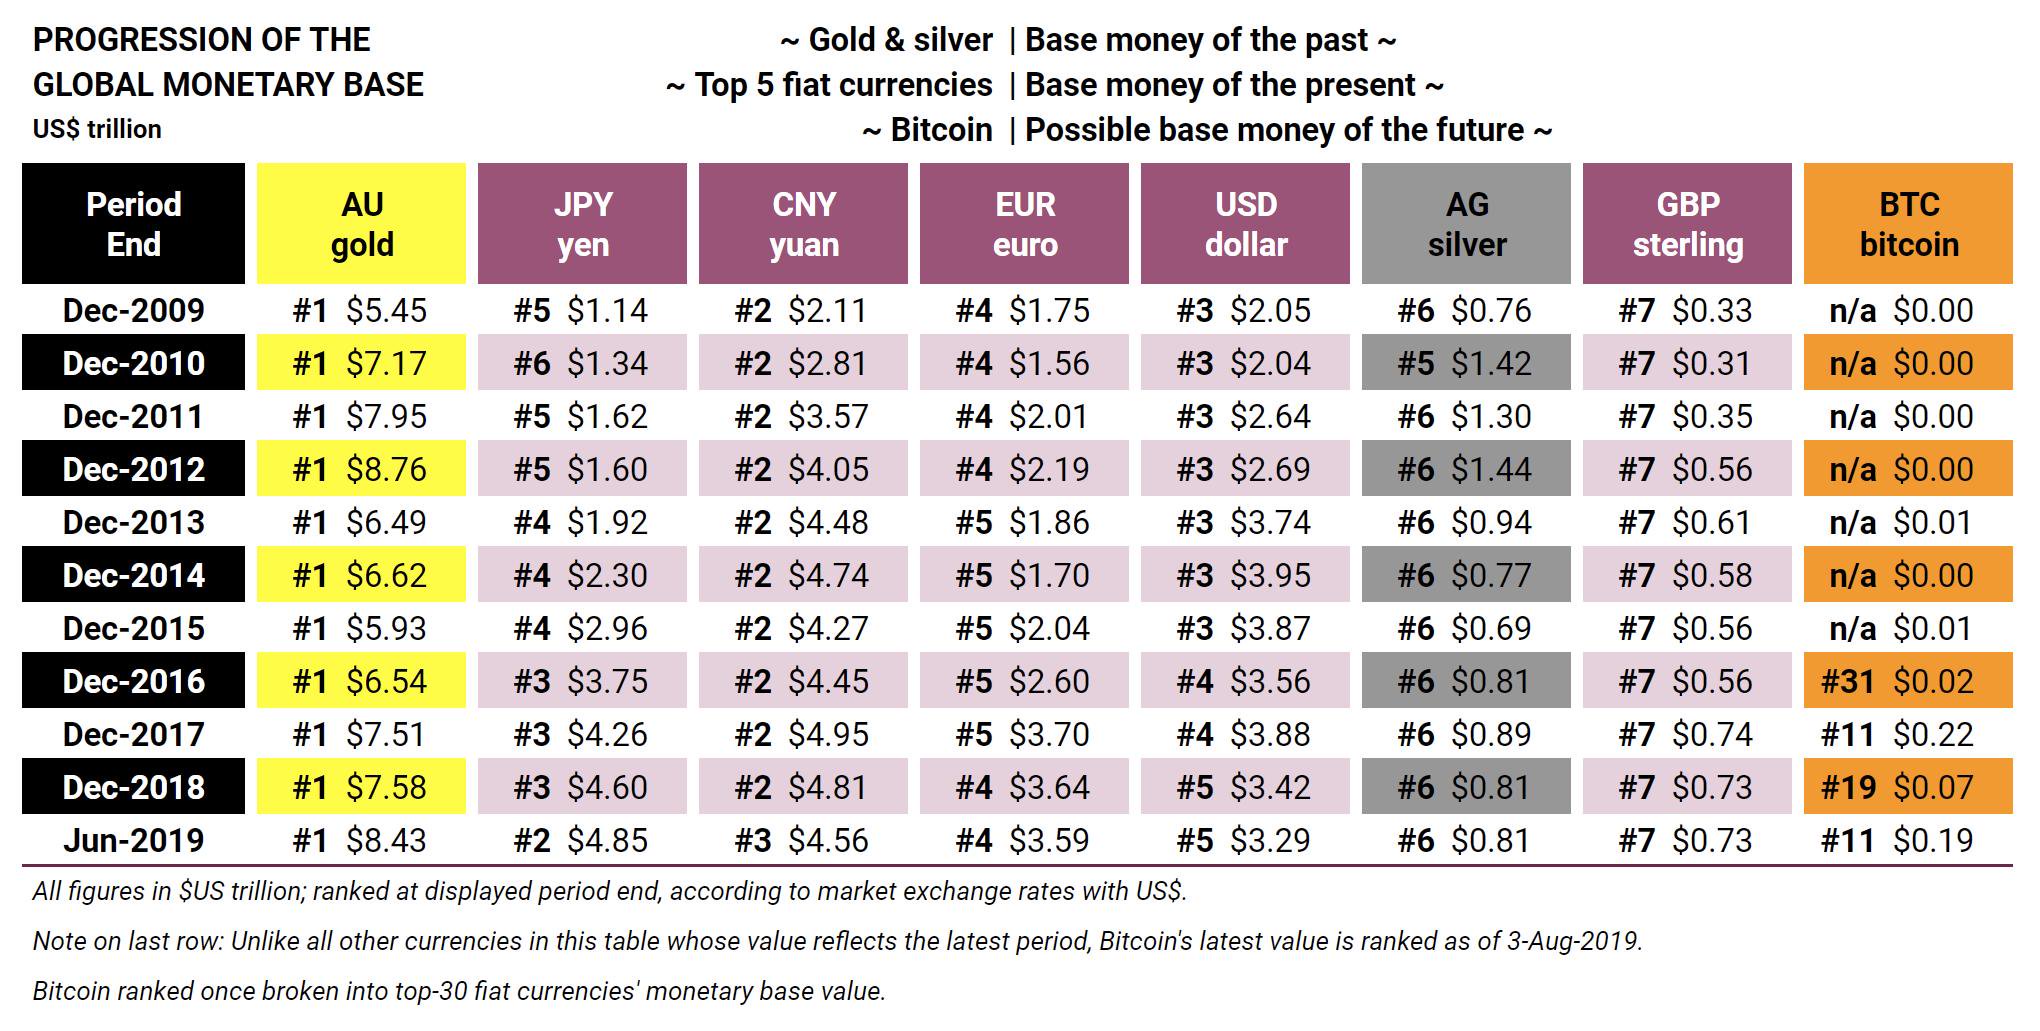
All estimates are in trillion dollars, position inThe rating is presented at the end of the indicated periods based on the exchange rate to the US dollar. Note to the last row: unlike other currencies in this table, the latest Bitcoin rating is as of August 3, 2019. Bitcoin's rating is indicated only for the periods in which it was in the top 30 of the largest world currencies.
This brings us to the heart of this analysis: inflation.Inflation today is understood simply as "rising prices" and is usually measured by central banks, and usually incorrectly.It is impossible to represent the changes in all prices in one simple index.
Analyzing inflation, we use itThe classic definition of monetary inflation. That is, in other words, the growth of the money supply and the release of money. Understanding this growth rate can be very, very helpful in order to better understand money.
Inflation is actually one of the key topics for understanding money.Inflation of money supply growth reflects scarcity, but for the sake of clarity, let's make a reservation right away:The following graphs have nothing to do with price increases or prices per se..
At this point, let's jump straight to the conclusions.The chart below shows the growthof all monetary bases for the last 12 months.about the percentage change in the supply of monetary units – dollar or yen, ounce of gold or BTC.For example, the U.S. is actually 5 years olddid not turn on the "printing press".
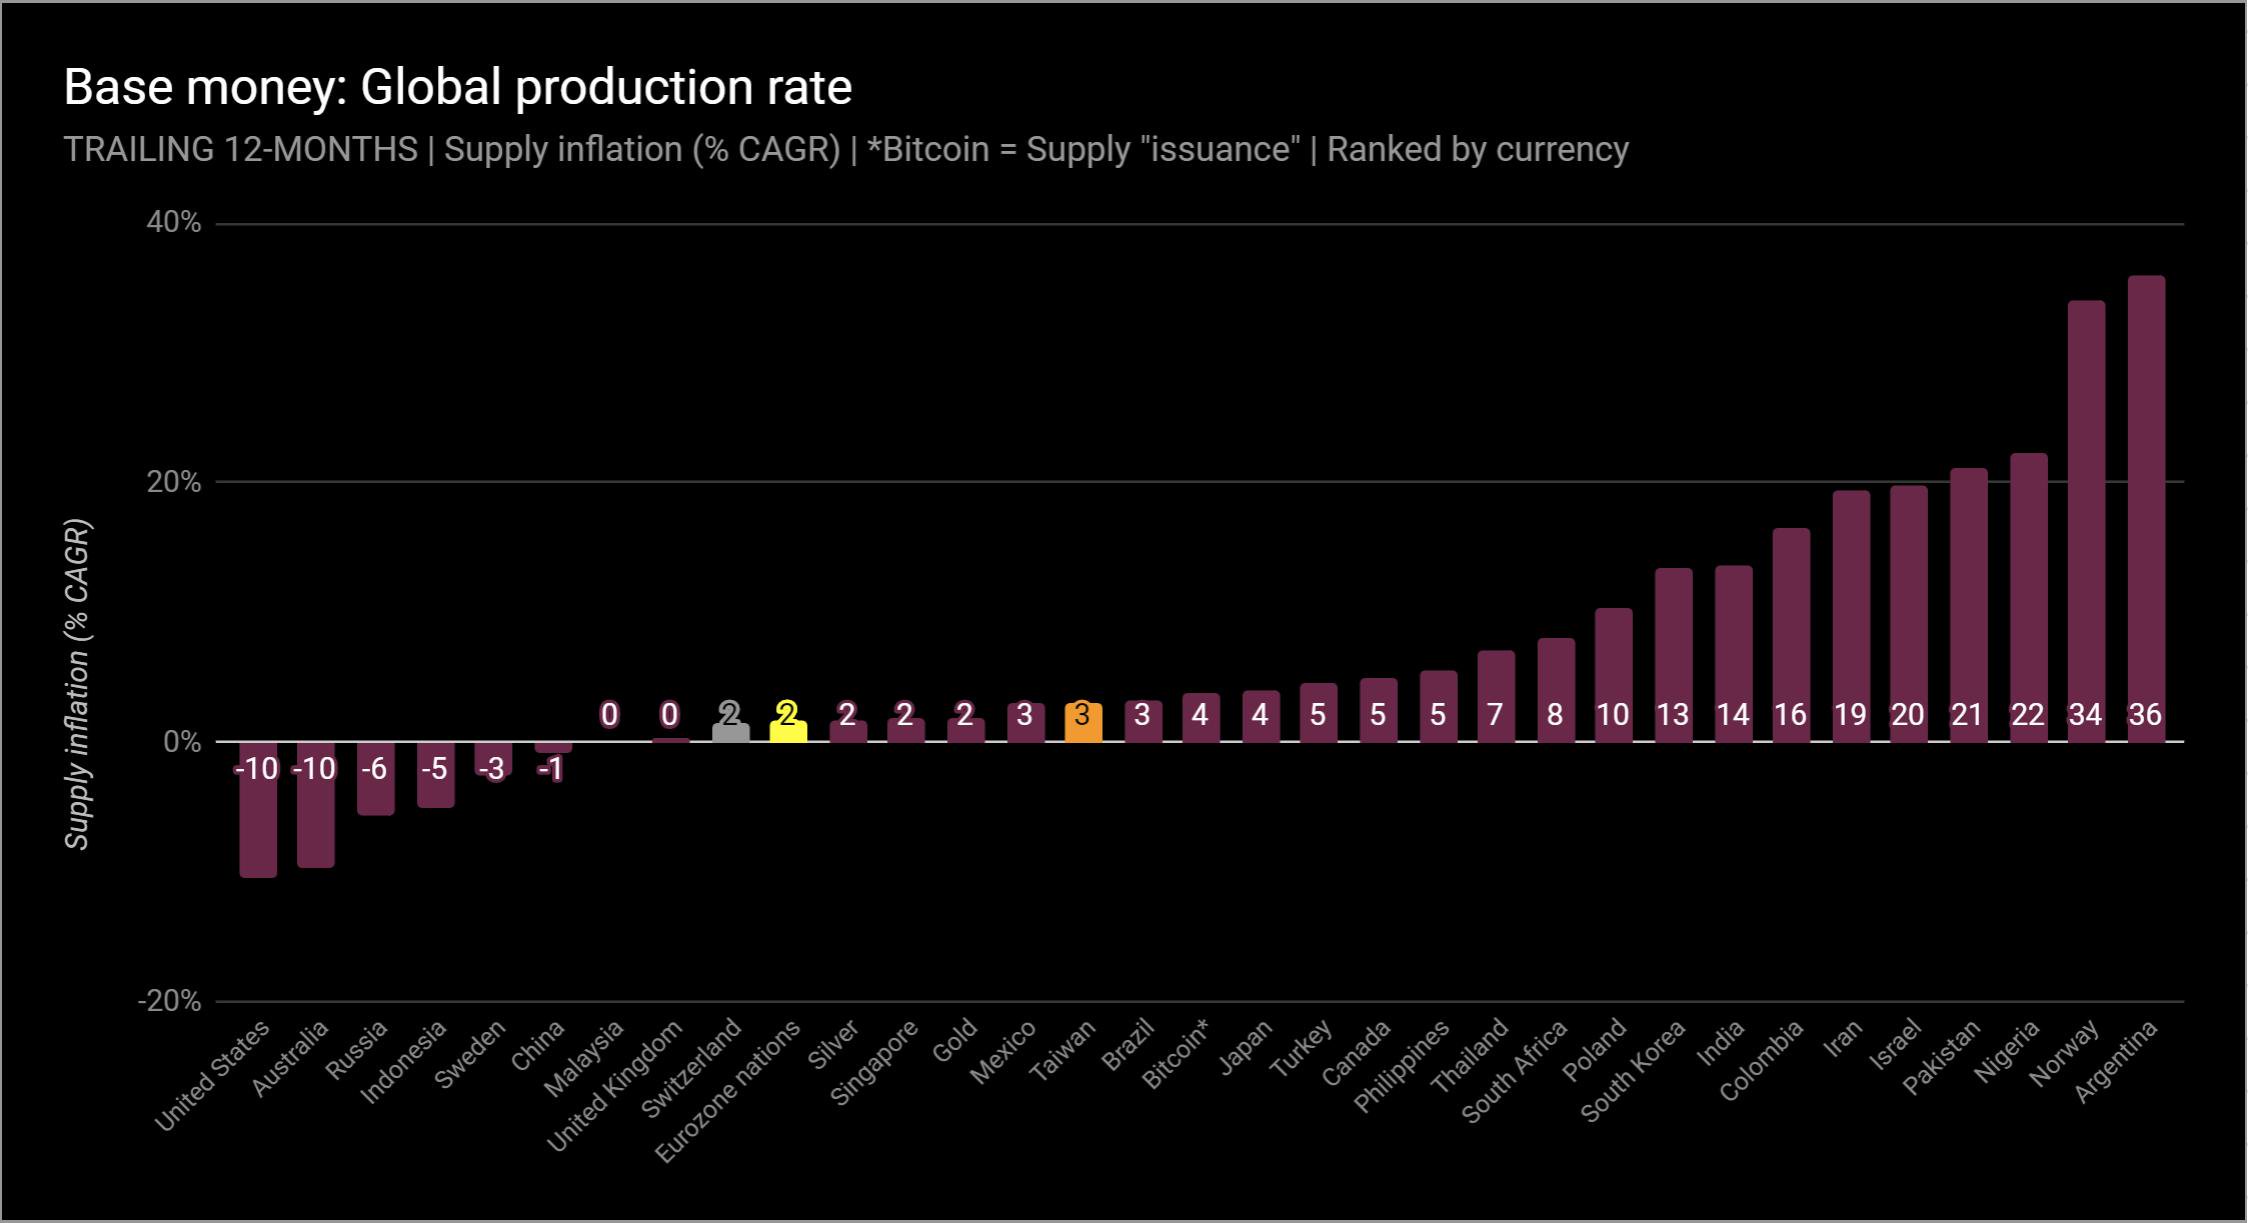
Supply inflation (% of the average annual growth rate) over the past 12 months. For Bitcoin, the combined average annual growth rate is equal to the volume of new coins issued.
But we need to look even deeper for betterevaluate the longer term. Remember the global fiat money curve? In 1970, the total global monetary base in dollar terms amounted to $ 100 billion. Today - 19.2 trillion dollars. What does it mean? To understand this, you must first deal with average annual growth.
Average annual growth in compound interest -extremely important metric. It has more weight than a simple annual growth rate. This indicator can be used to measure return on investment or long-term trends, such as population growth. The doubling time can also be derived from this figure.
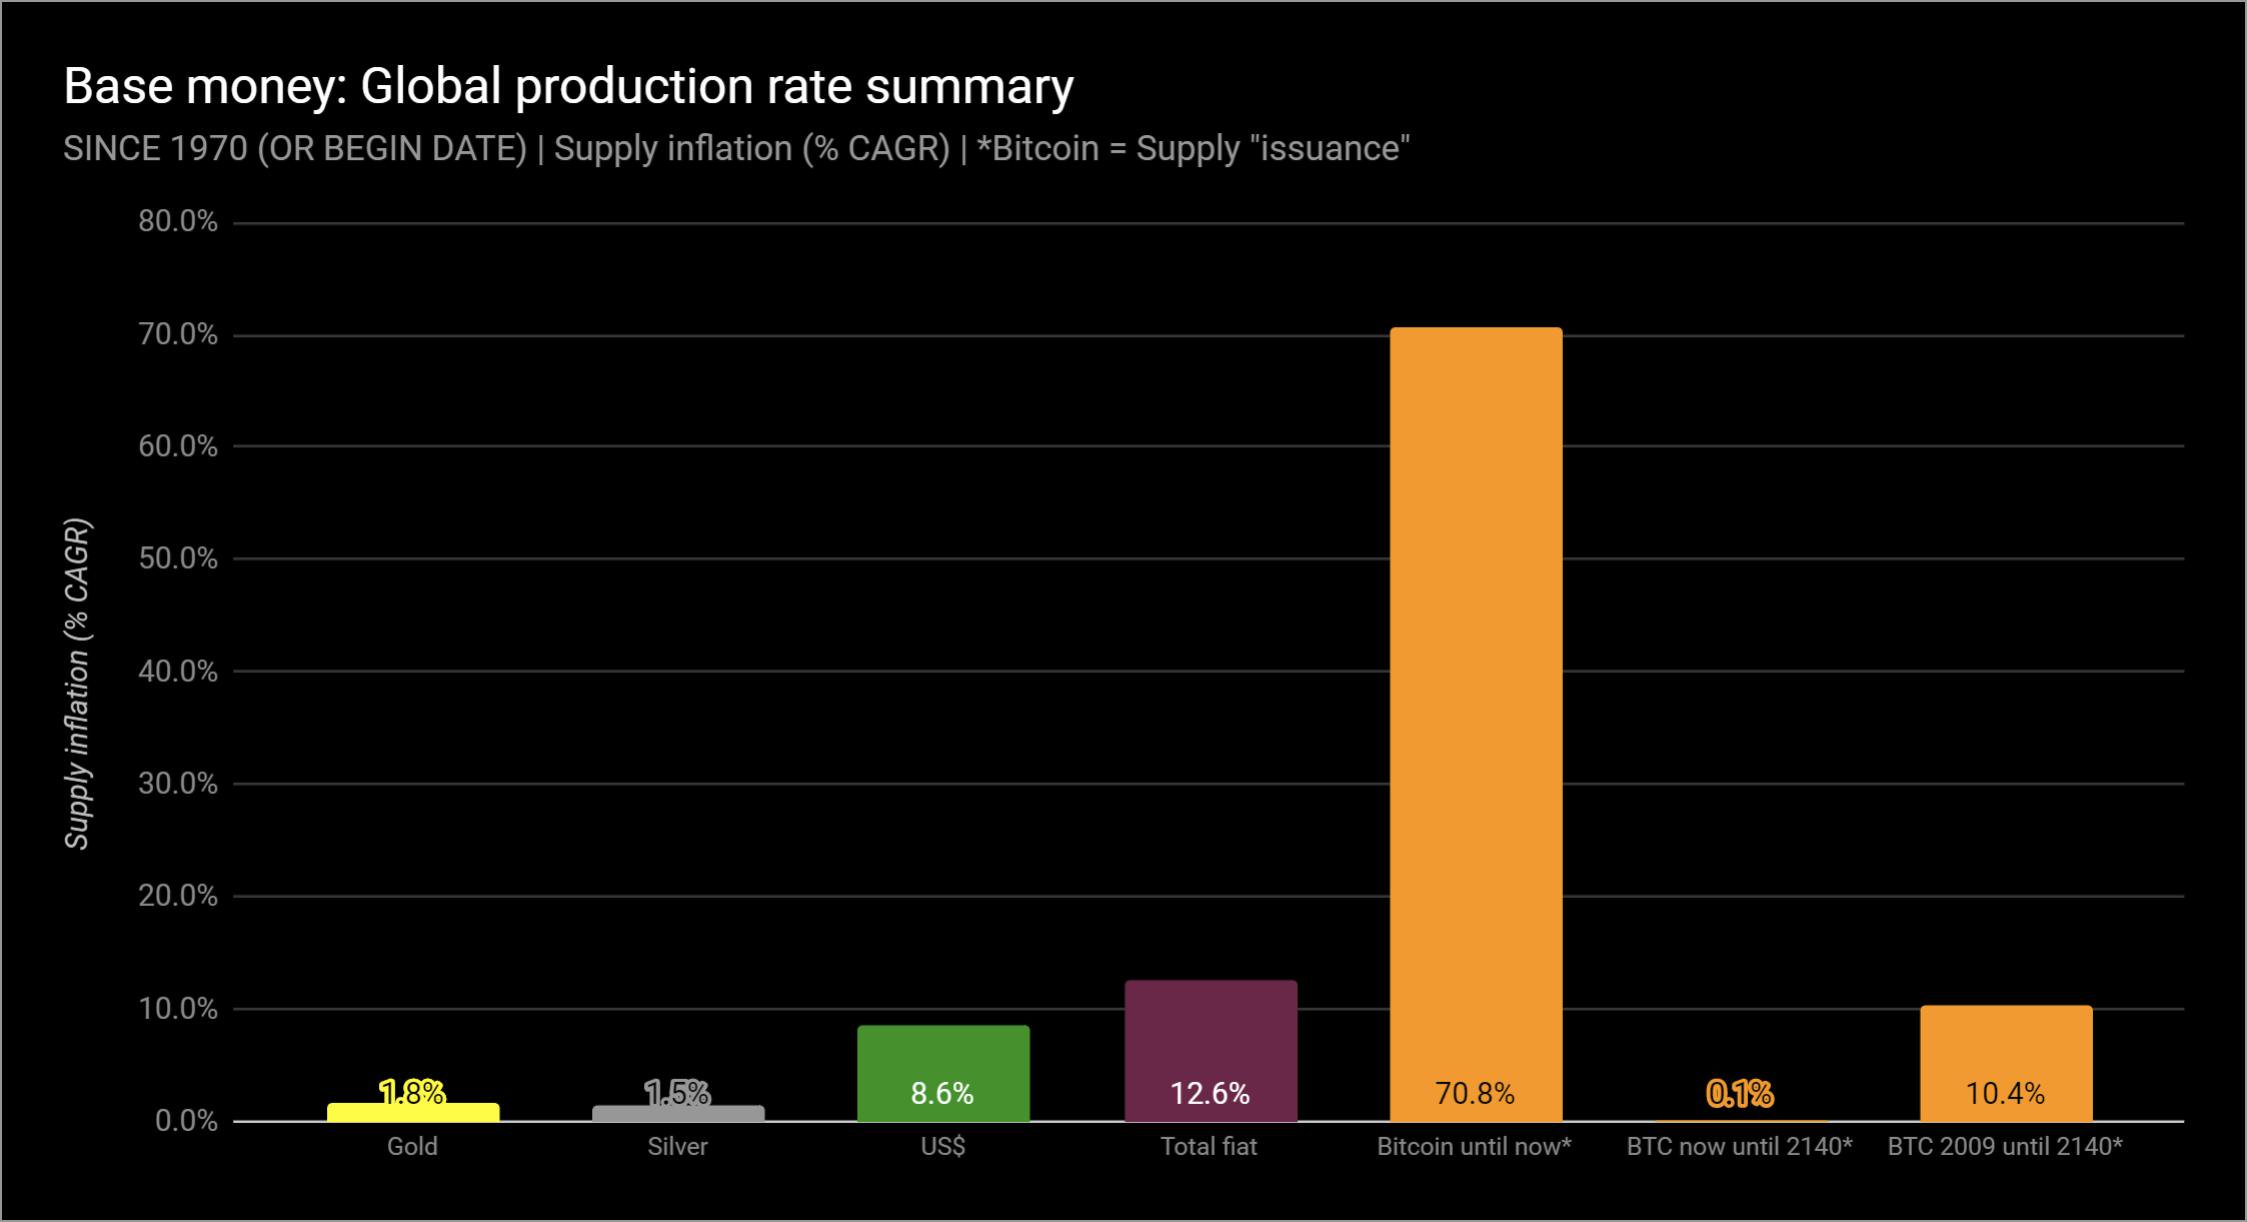
So let's start with the average annual paceglobal money supply growth since 1970. Data for 50 years. More than half of the countries have data for this entire period. For other monetary bases,% is indicated starting from the time they appeared. For Bitcoin, this is January 2009.
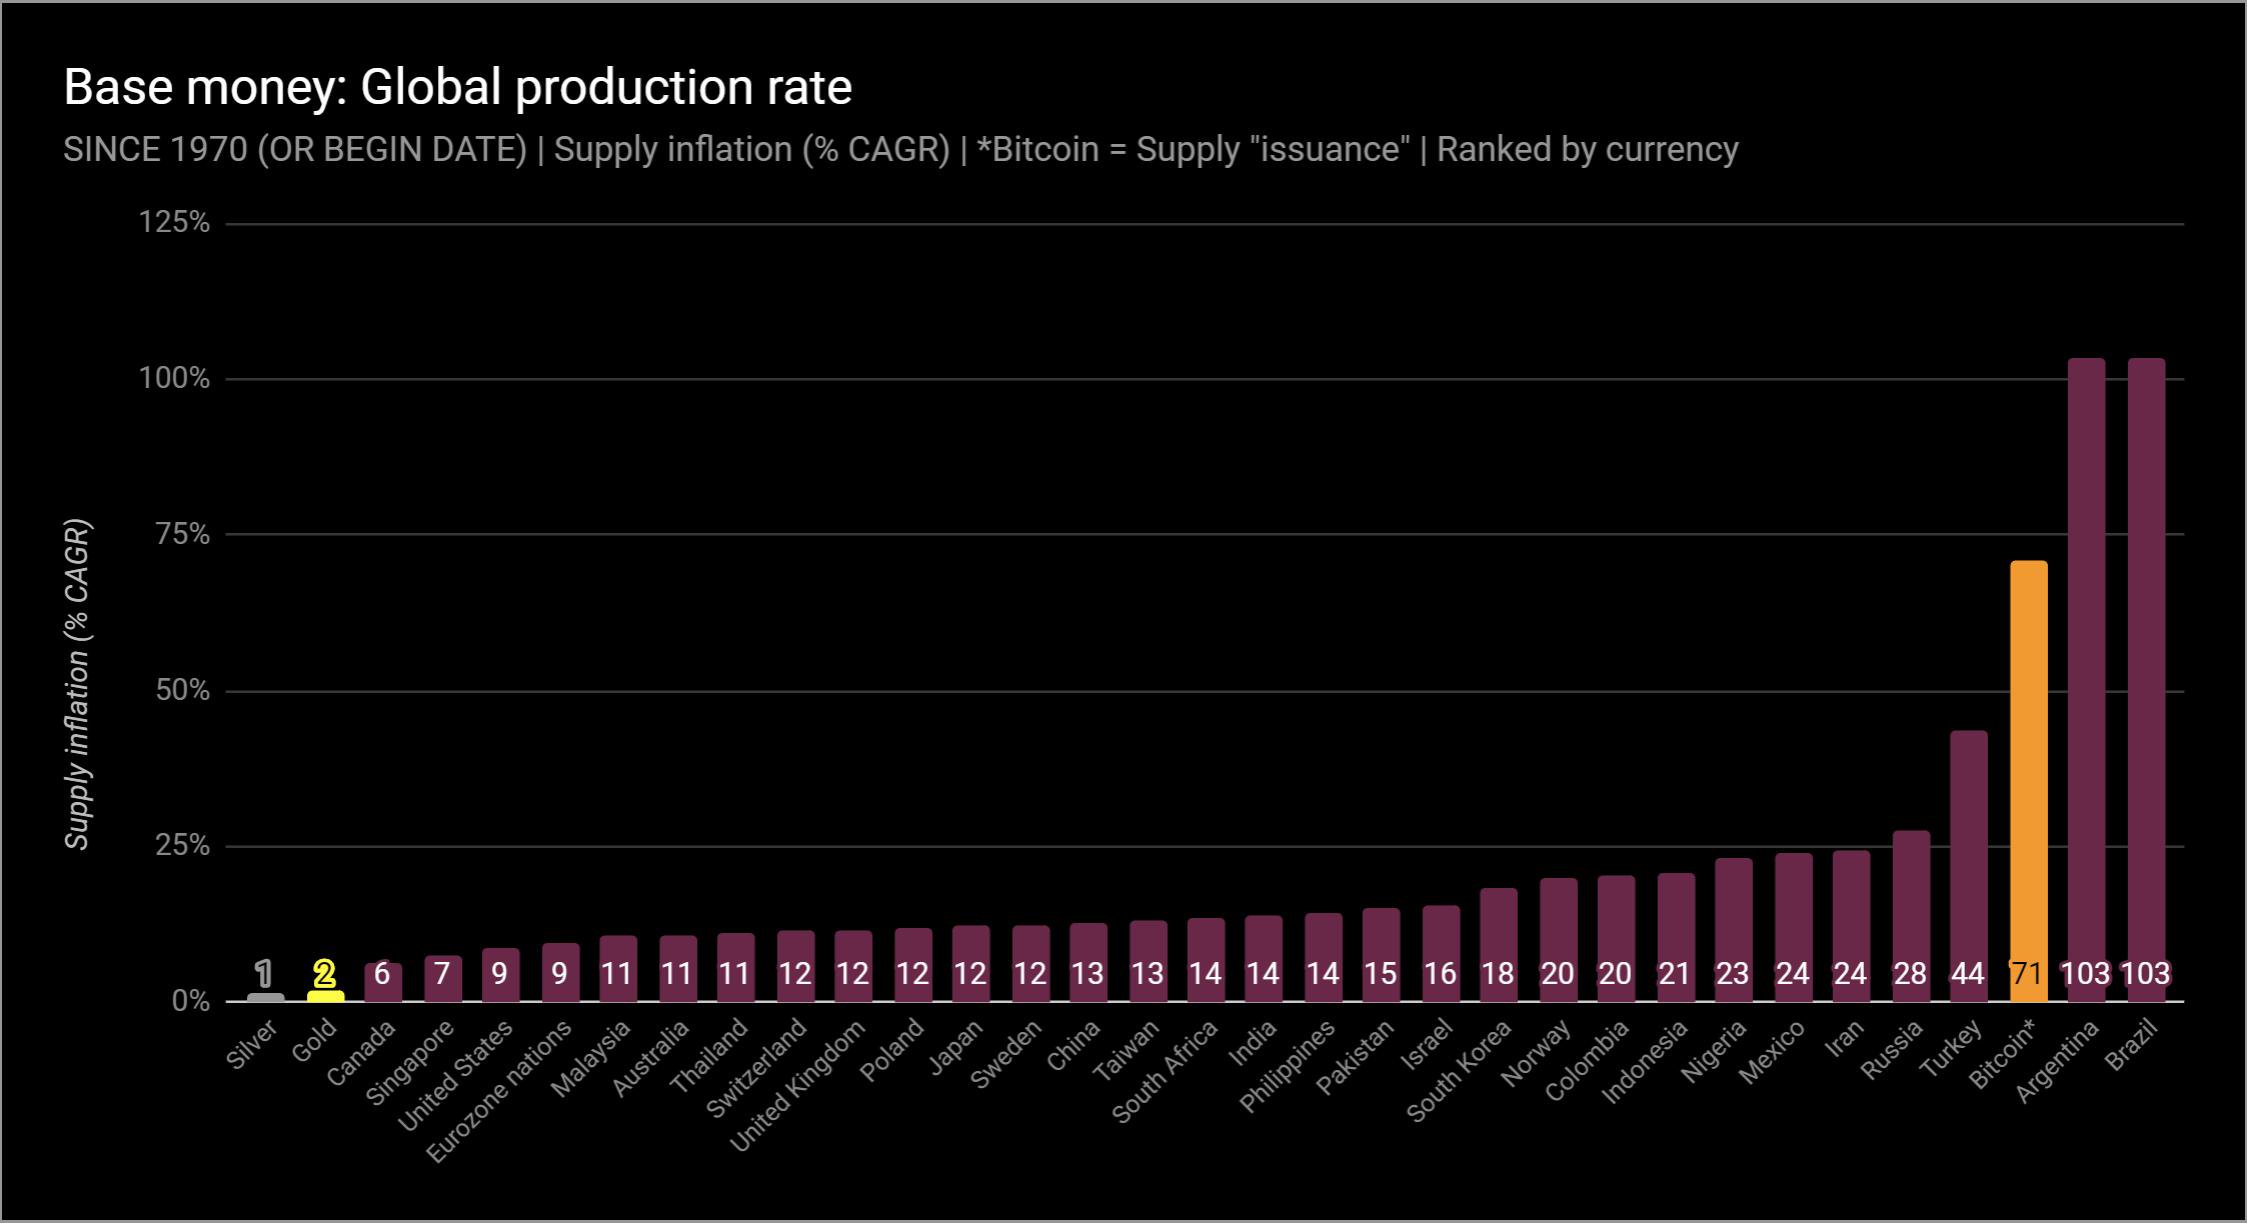
Supply inflation (% of the average annual growth rate) since 1970 (or since the advent of the currency). For Bitcoin, the combined average annual growth rate is equal to the volume of new coins issued.
Doubling time is also a useful metric. Based on% growth, we can determine how much time is required in order for the asset supply to double. Here is exactly the same diagram for the period since 1970 (and since 2009 in the case of Bitcoin), but for the doubling time, and not for complex growth.
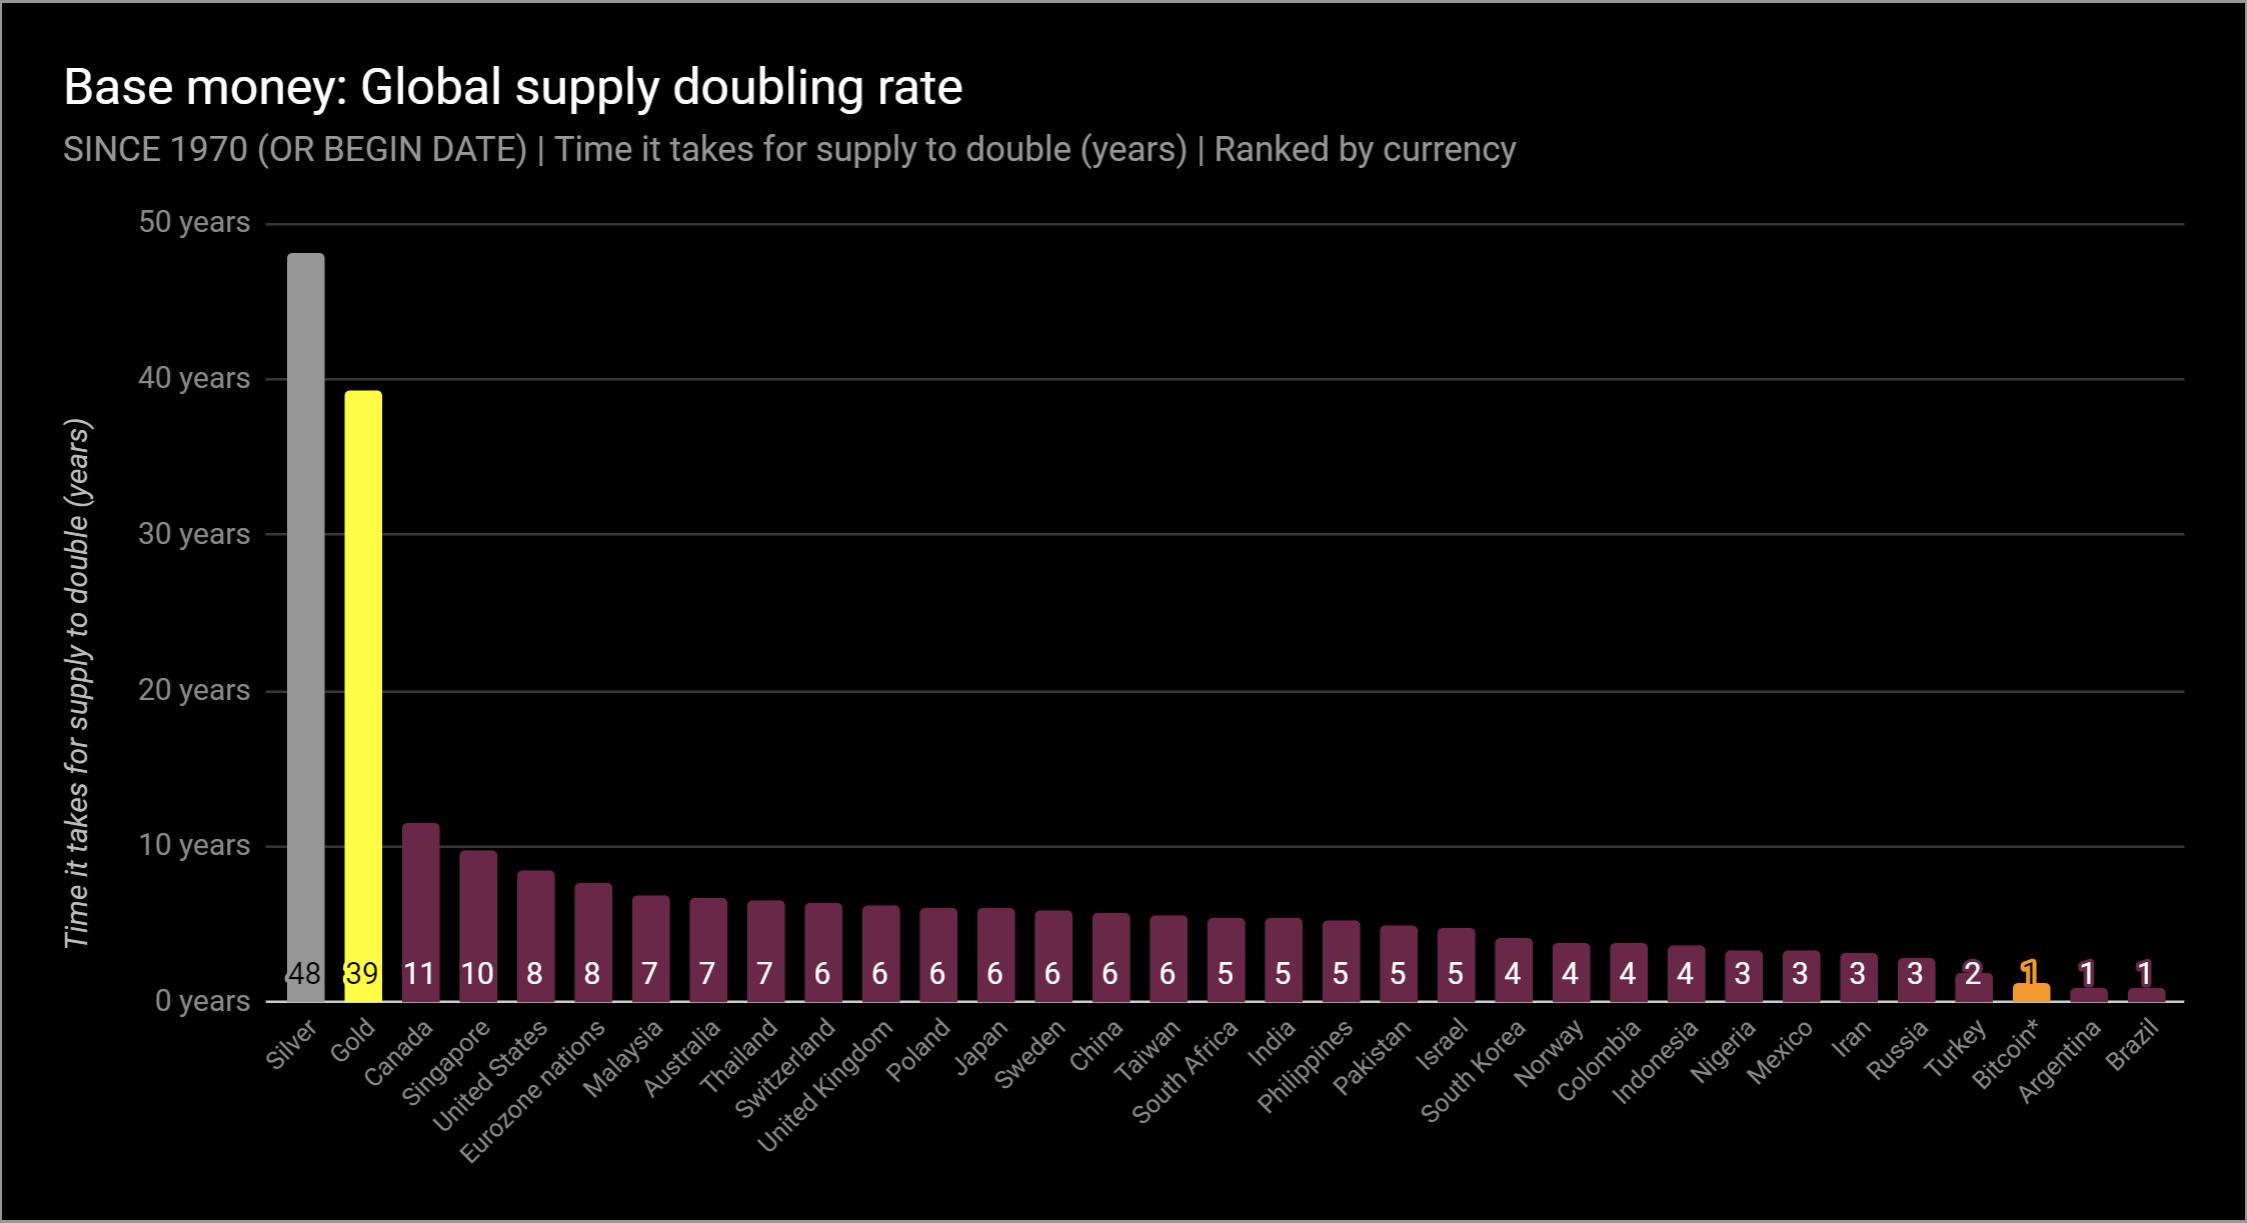
Doubling time (years). Data since 1970 (or since the advent of the currency).
Gold and silver became monetary bases inpast, because the volume of their proposal was difficult to inflate. Thus, at low inflation rates, they had a long period of doubling supply. Fiat money bases usually double much faster. As for Bitcoin, then you need to dwell on it in more detail.
The following two graphs should facilitate understanding.of how Bitcoin's supply volume is changing. Between 2009 and the end of May 2019, it grew from 50 to 17.7 million BTC. This means an average annual growth rate of 73%, or a doubling every 1.3 years. But if you take the period from the current moment to 2140, then everything becomes much more interesting.
Supply inflation (% of the average annual growth rate) since 1970 (or since the advent of the currency), generalized data. For Bitcoin, the combined average annual growth rate is equal to the volume of new coins issued.
Please note that the volume of Bitcoin's offerwill increase by only 0.1% per year, i.e. its doubling period will be about 500 years. Even more unique to Bitcoin is the fact that its protocol will not allow this doubling, since the total volume of its issue is limited to 21 million coins and this limit will be reached by 2140. Not a single money in history has worked this way.
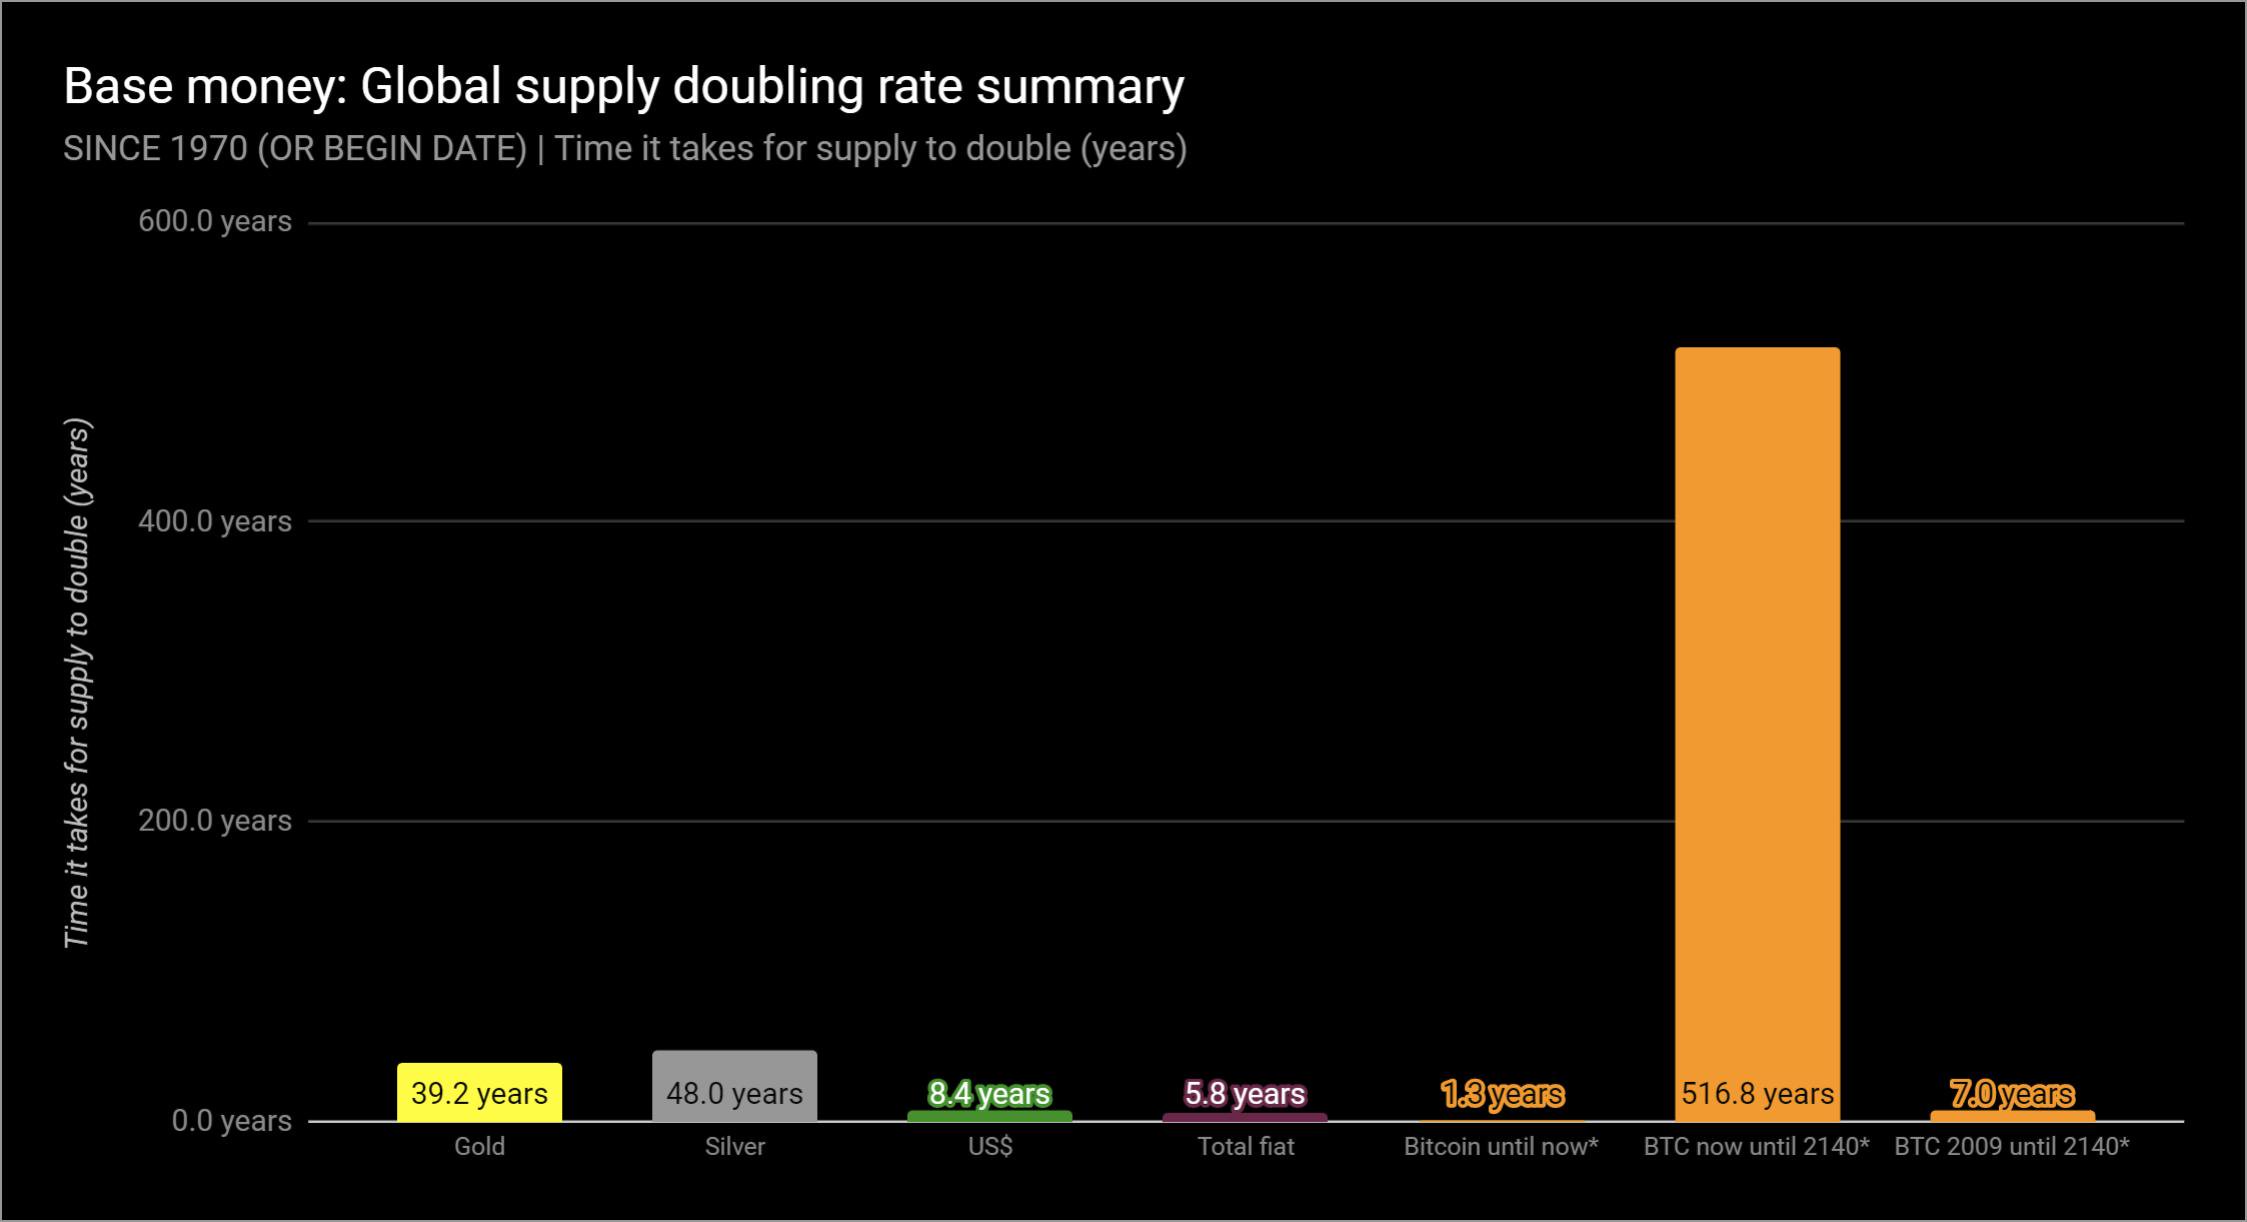
The doubling time of the offer (years), generalized data since 1970 (or since the advent of the currency).
For clarity, let's compare the long-term trends since 1970 for the base money of the past, present, and probably future:
- Gold: 1.8% (2x for 39 years)
- Silver: 1.5% (2x for 48 years)
- US dollar: 8.6% (2x for 8 years)
- World fiat money base: 12.6% (2x for 6 years)
- from 50 BTC in 2009 to 21 million BTC in 2140: 10.4%
Take another look at the 50-year time series,this time with inflation. The chart below shows the inflation rate for the total global fiat monetary base, weighted average for the dollar equivalent of each currency. Please note that in general this picture corresponds to the average annual growth rate (12.6%) and doubling time (5.8 years), the diagrams of which are given above.
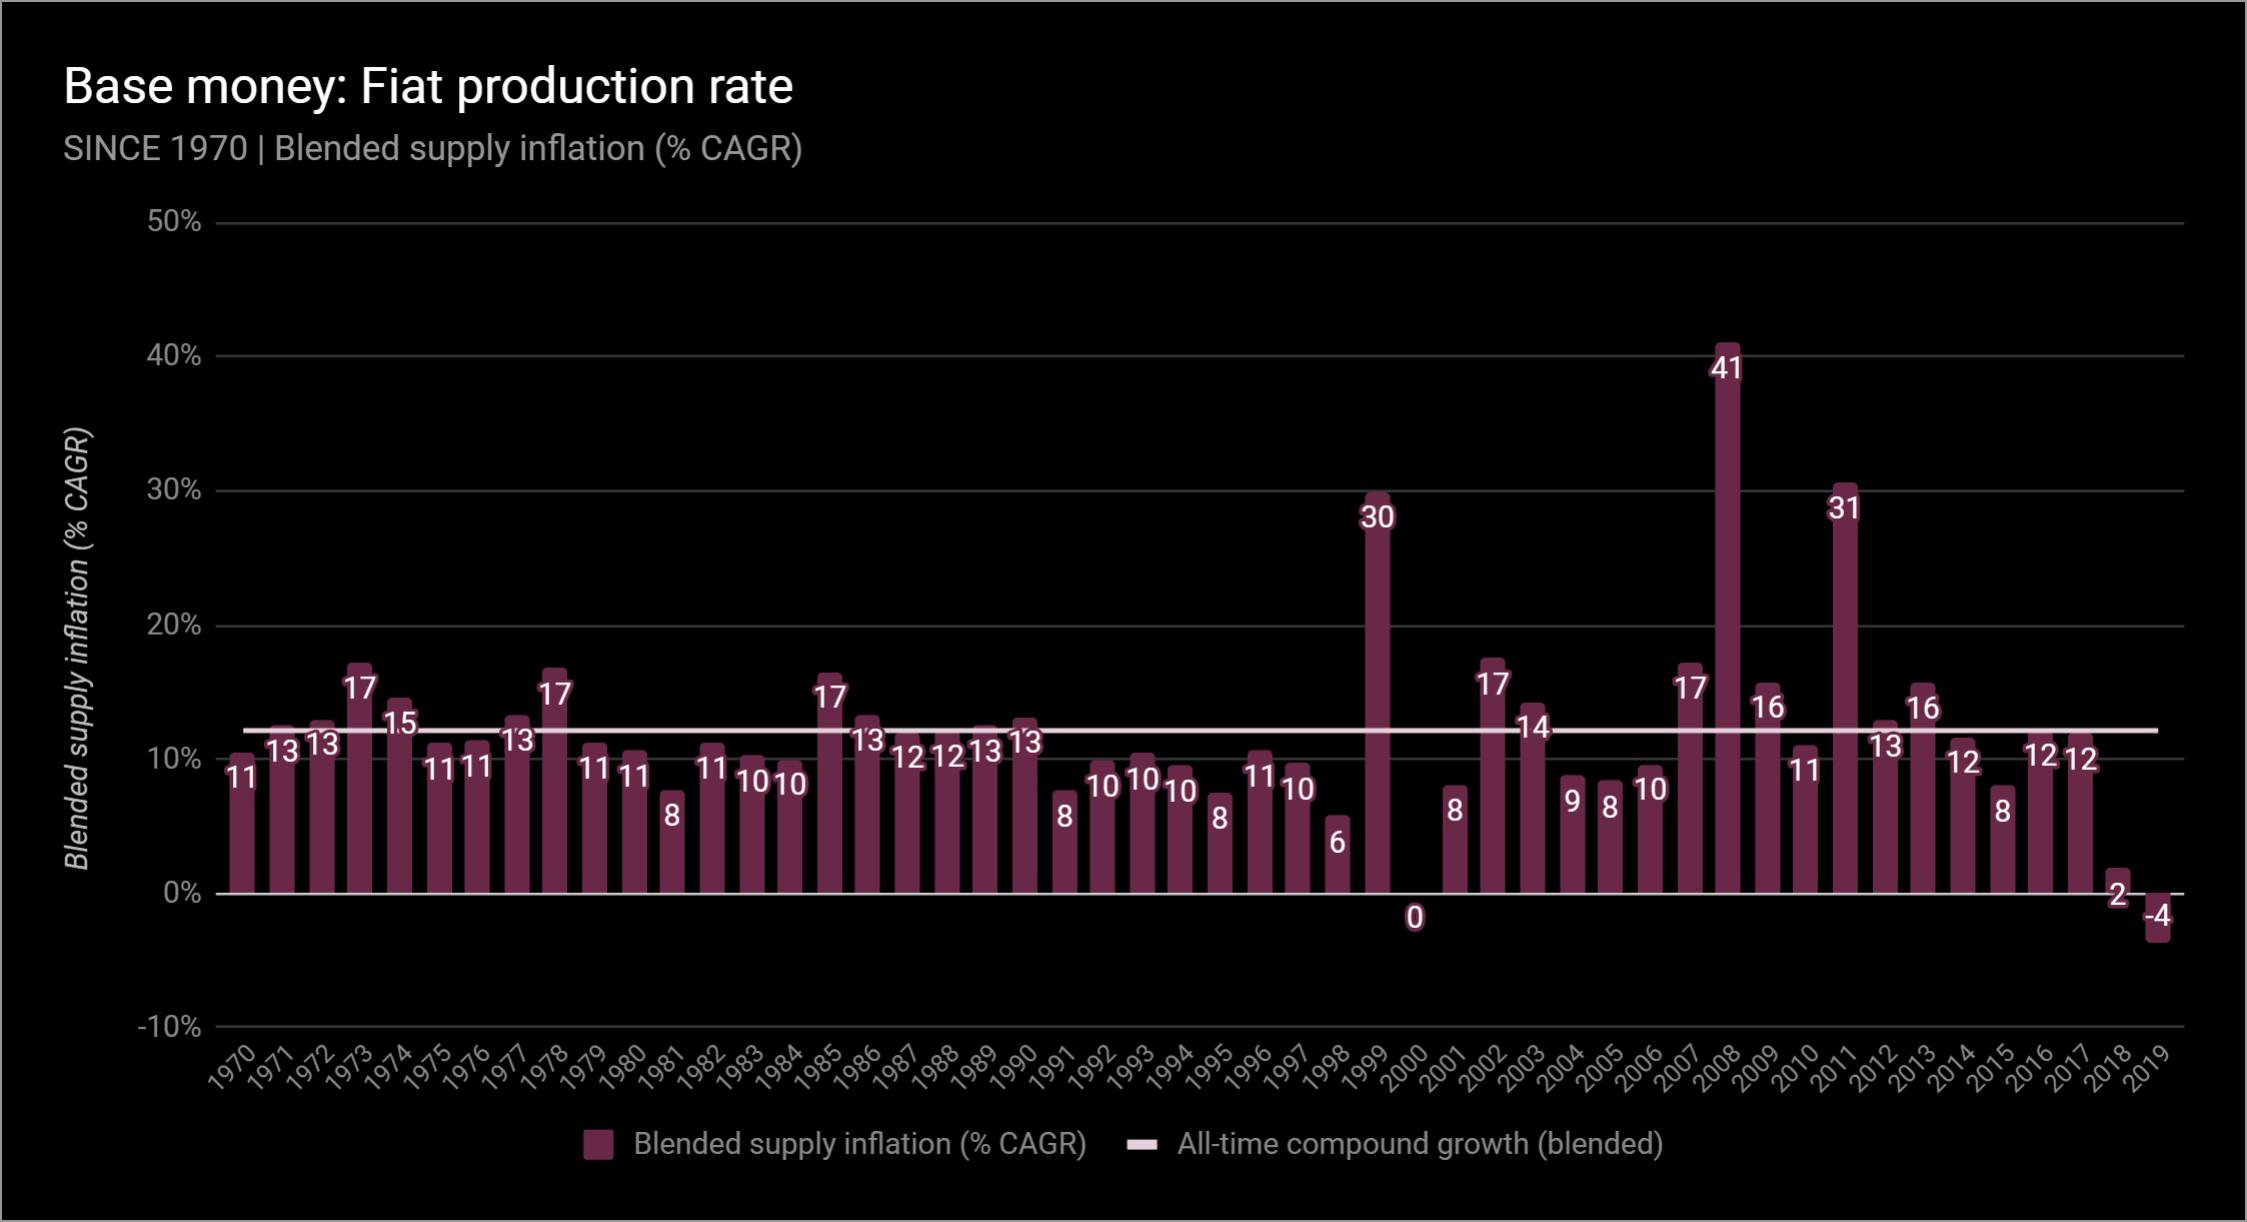
Mixed supply inflation (% of average annualgrowth rate) since 1970 (or since the advent of the currency). Columns - mixed supply inflation (% of average annual growth rate); line - total growth (mixed) for all time.
Brief note on the chart above. What happened in 1999? Until 1999, people cashed money like crazy. It is interesting to note that in 2018 and 2019. recorded the lowest (and even negative) growth rates of monetary bases in history. This is due to the efforts of central banks to reduce the impact of the momentum received from 2008 to 2013.
And here is the gold. The same principle. Please note that the general compounding will coincide with the summary reports that were presented above.
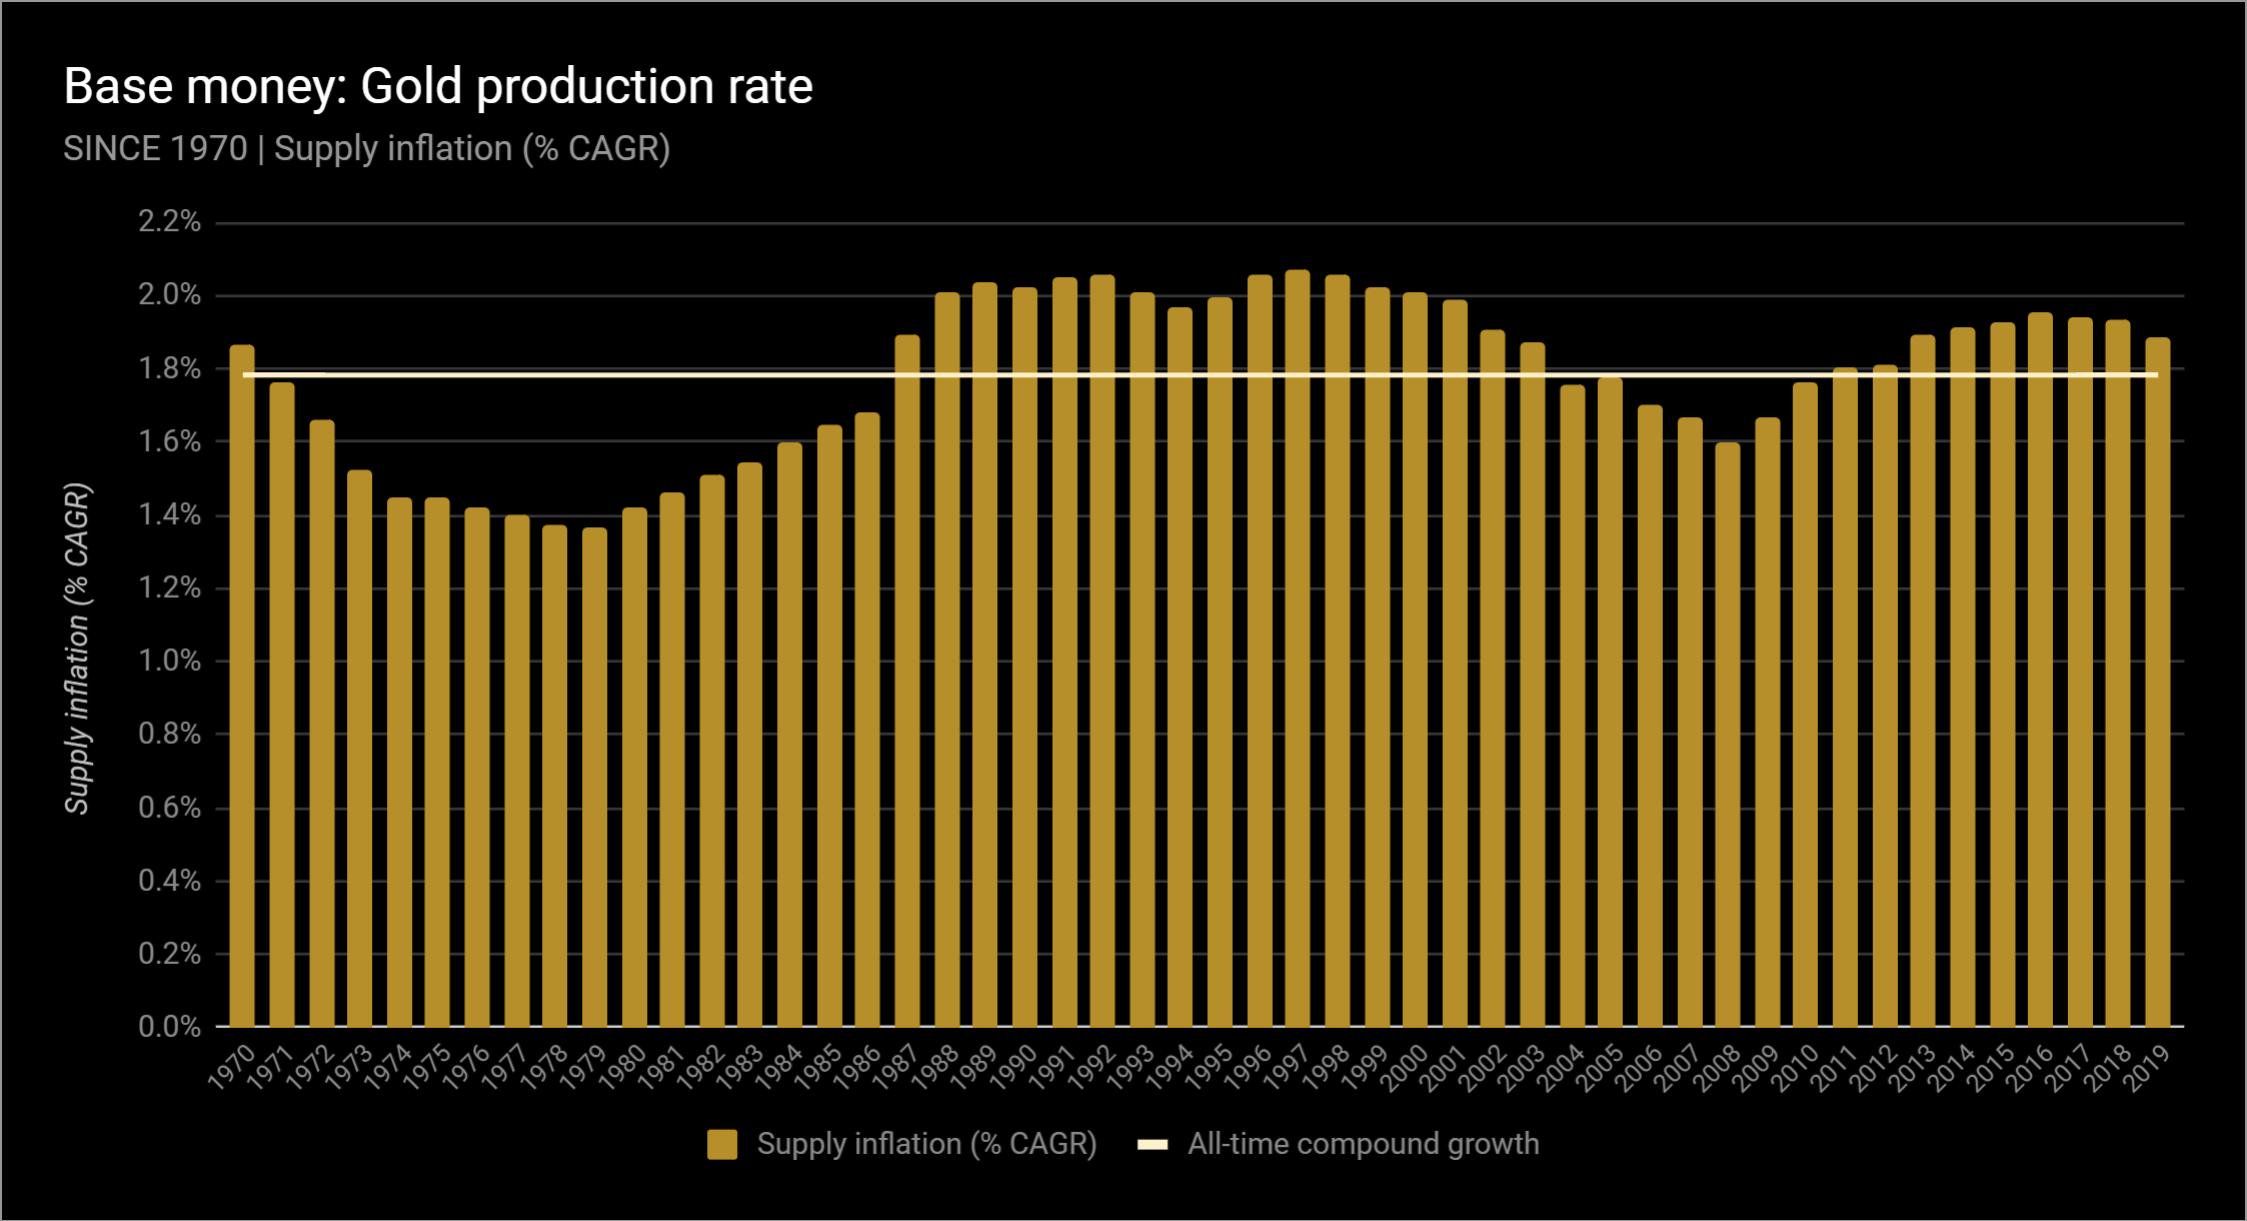
Supply inflation (% of the average annual growth rate) of gold since 1970. Columns - supply inflation (% of the average annual growth rate); line - total growth for all time.
And silver. All the same.
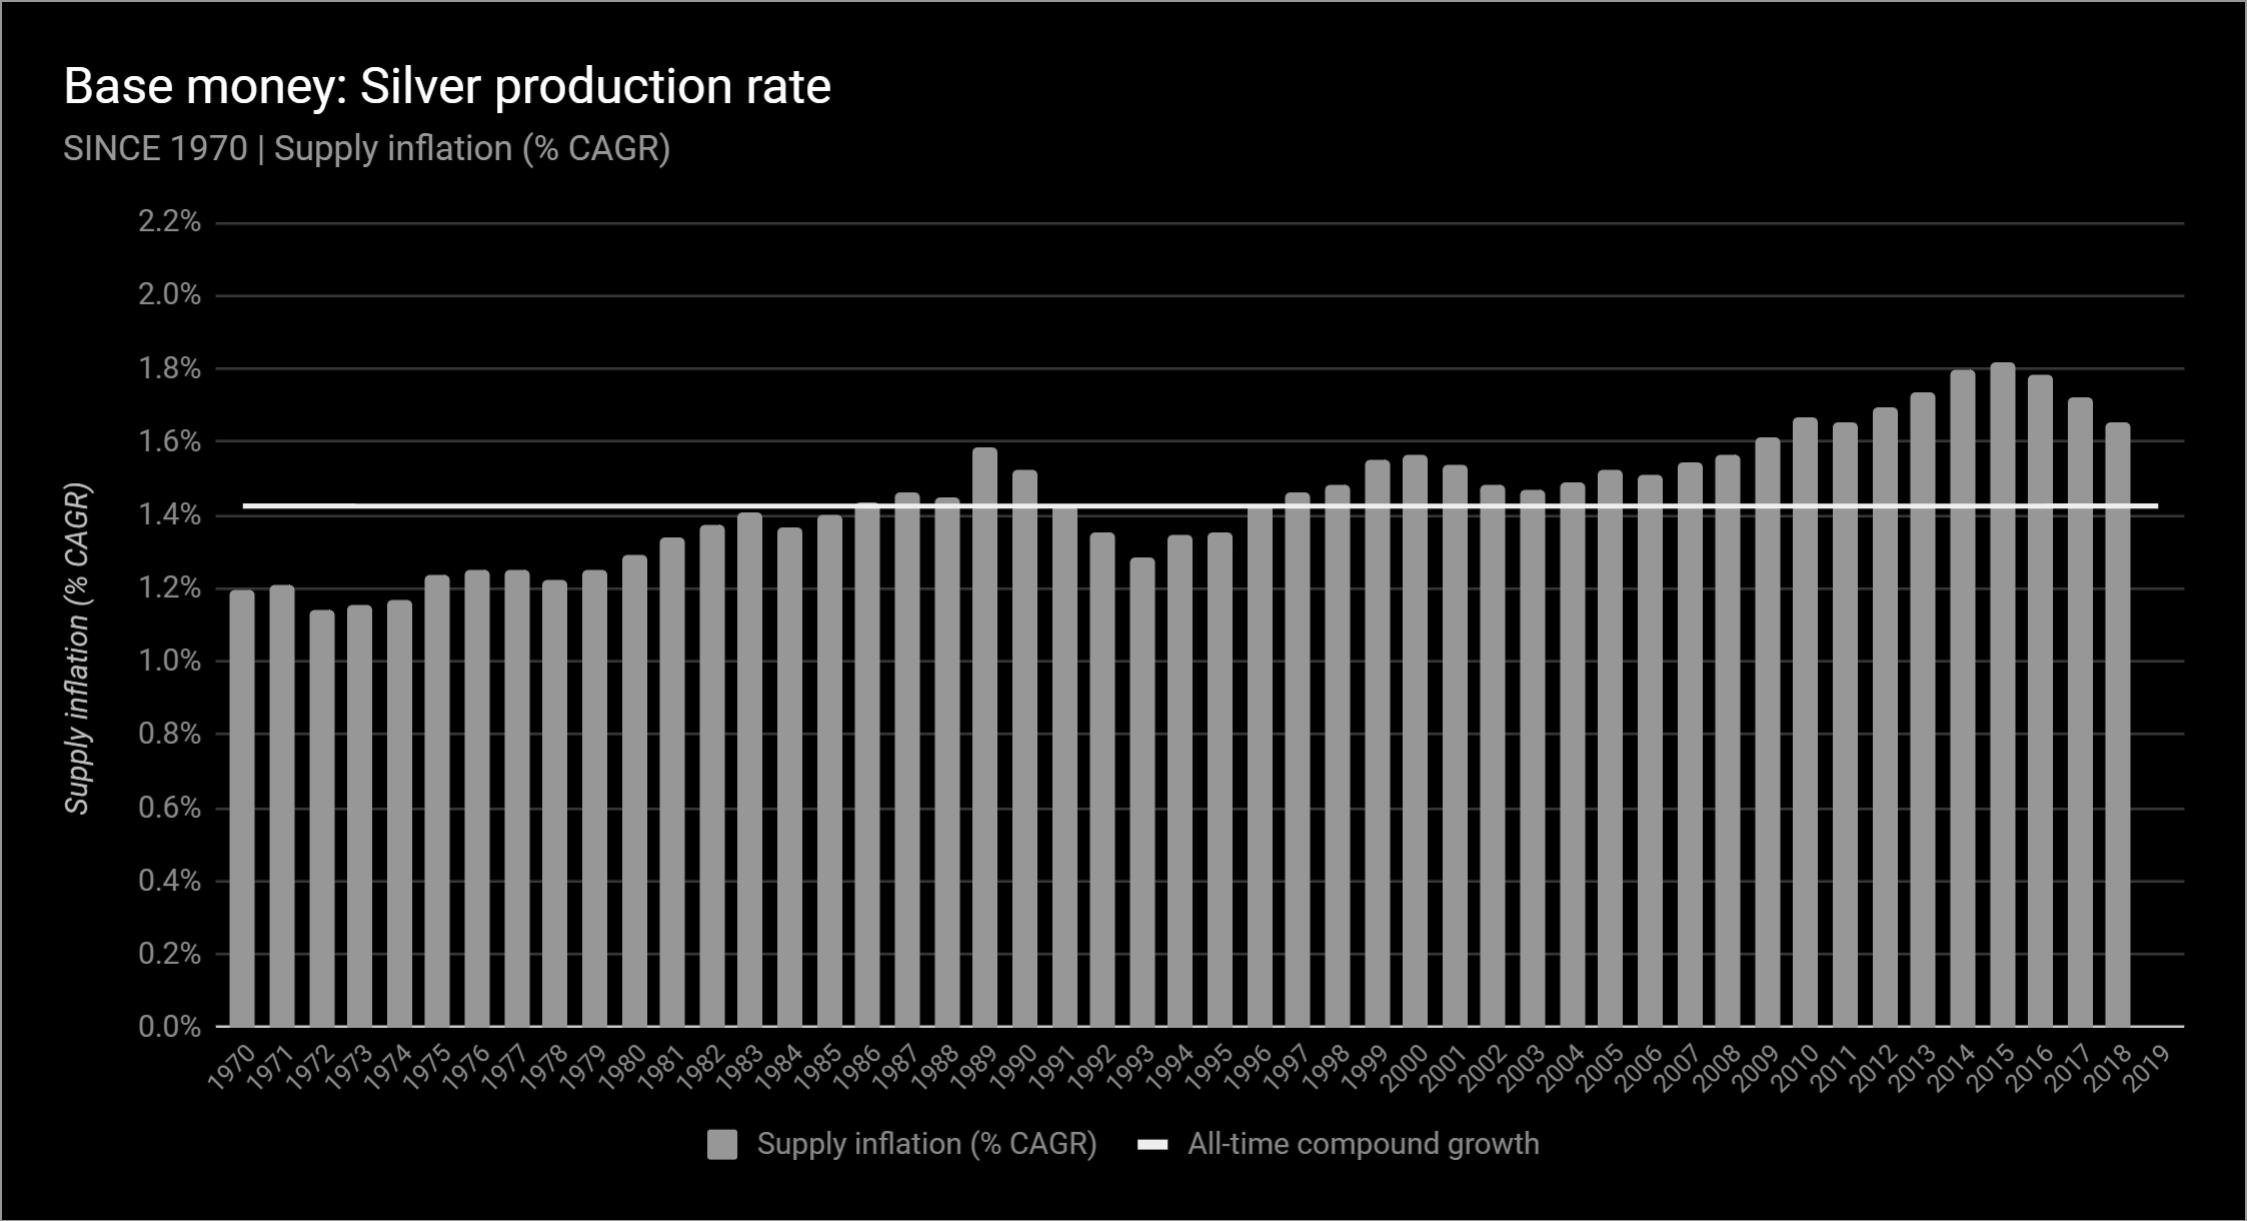
Supply inflation (% of the average annual growth rate) of silver since 1970. Columns - supply inflation (% of the average annual growth rate); line - total growth for all time.
And now bitcoin. Remember why aggregate growth in compound interest is still so high and why it will never be so high again. And now it is time to dwell on the average annual growth rate in compound interest for the Bitcoin system.
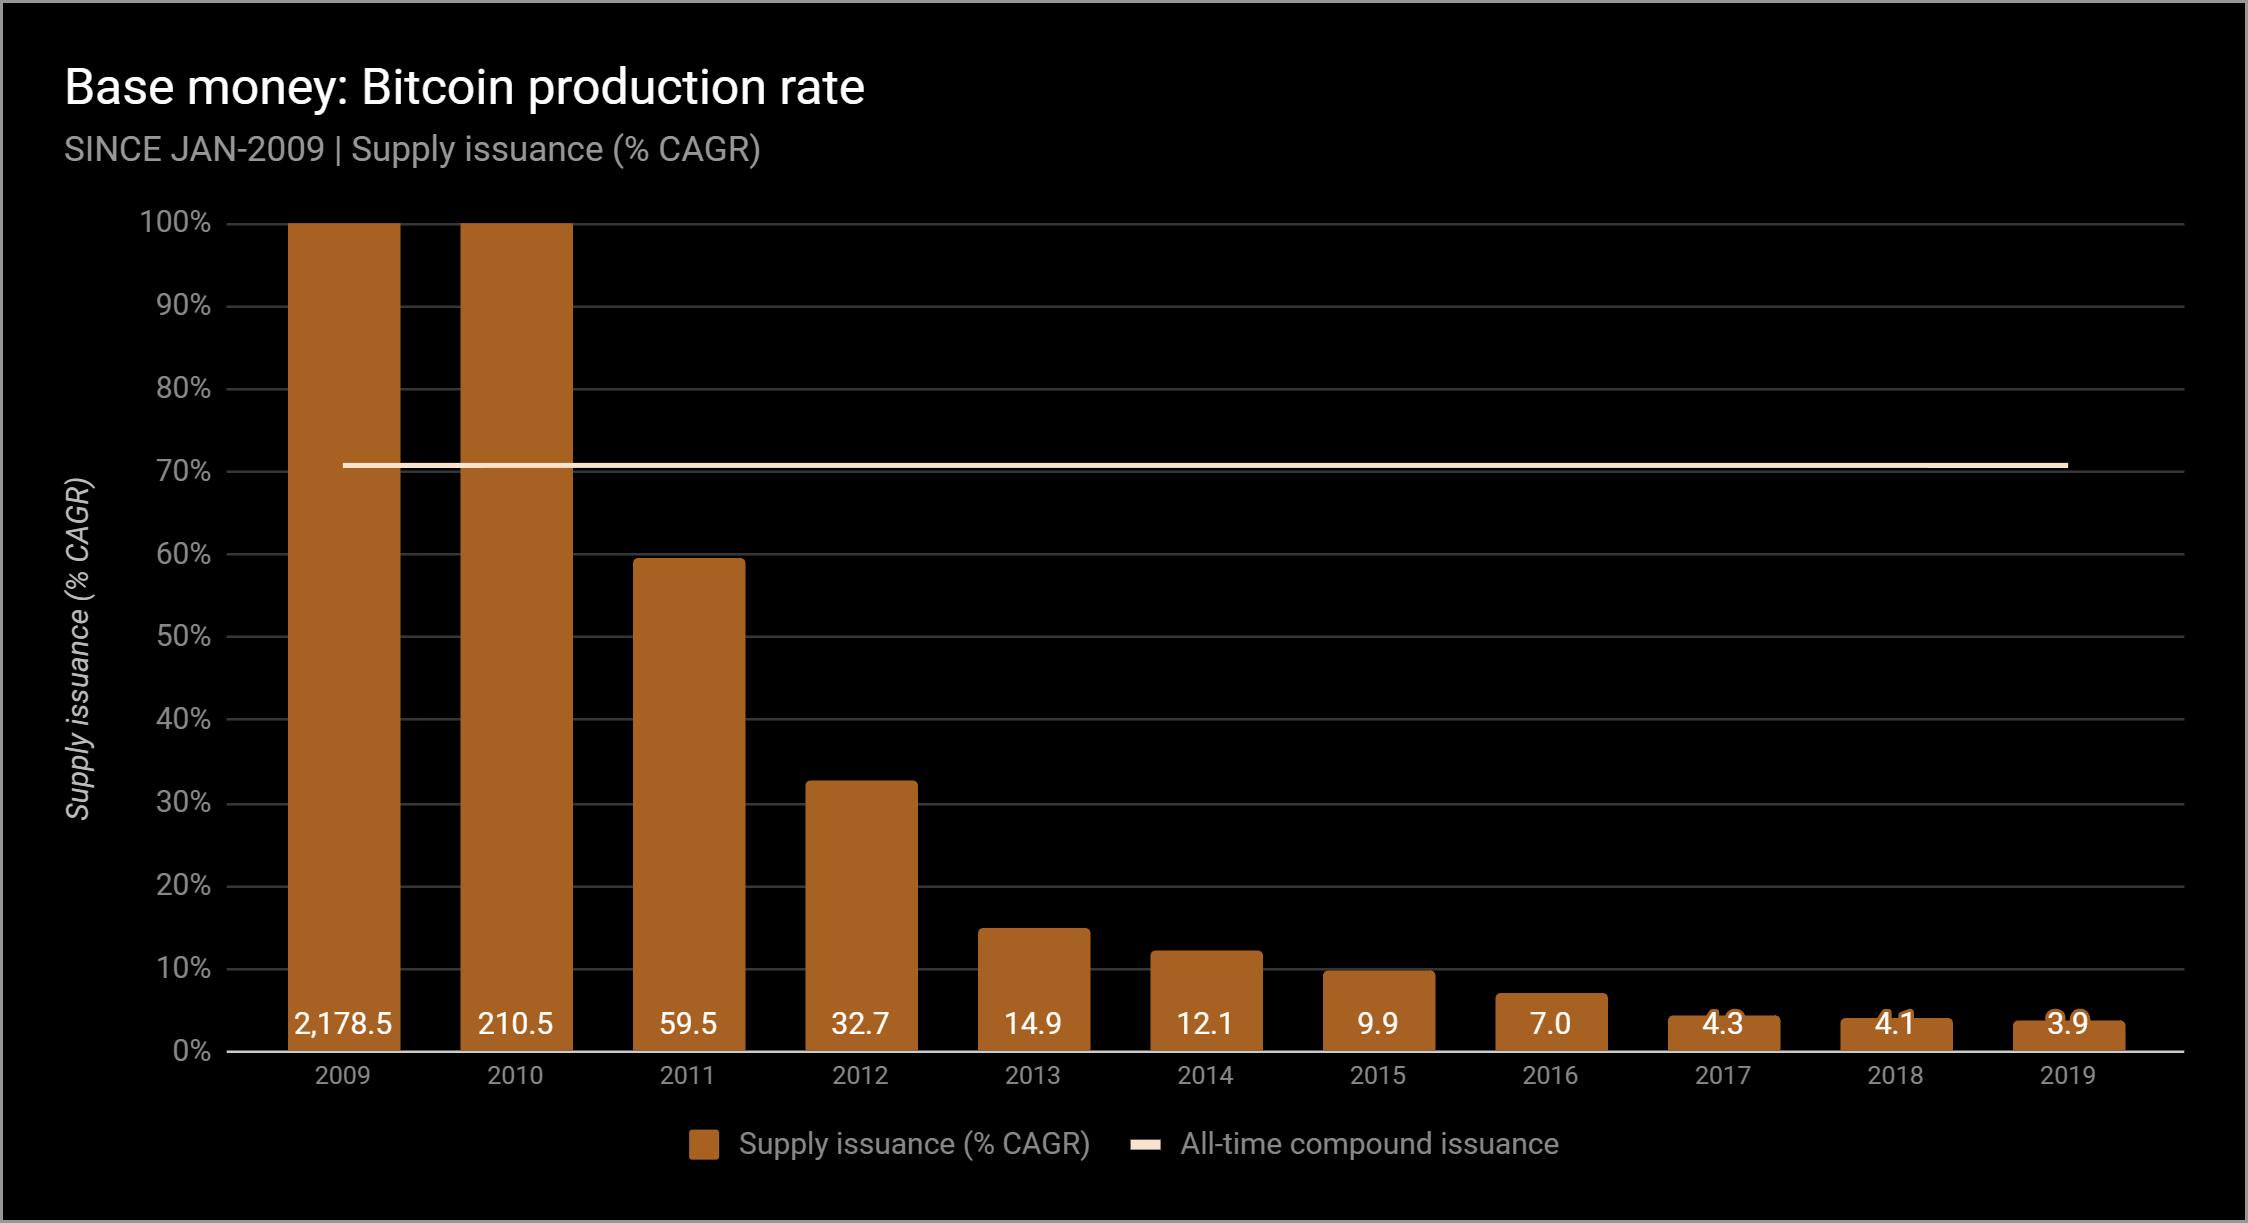
The volume of emissions (% of the average annual growth rate) of bitcoin since January 2009. Columns - the volume of emissions (% of the average annual growth rate); line - the total volume of emissions for all time.
Notice that in the chart above, instead of the "Supply inflation" scale, there is a "Supply issuance" scale.Bitcoin's "supply inflation" is already built into its price, and everyone knows its maximum supply: 21 million coins.As has already been shown, we know its growth rate and the time it will double to 2140.
The predictability of these parameters is crucial, and it is a unique feature of the monetary system.Therefore, "inflation" is not the best word for increasing the supply of Bitcoin."New Coin Supply" is a much more accurate description of this parameter, given that Bitcoin's total supply is known from the outset, unlikefiat money and even gold.
Well, now that we have all the data,let's finally talk a bit about prices, because, although I said that none of the above diagrams has a price chart, I know that you are interested in what effect all this monetary inflation has had - or will only have - on prices.
As Milton Friedman said, "Inflation is always and everywhere a monetary phenomenon."What he meant was that price inflation (which is not in the charts above) always followsmonetary inflation (detailed in the charts above).
The catch is that it’s impossible to predict howand when price inflation will occur. I hate spoiling the holiday for others, but it's true. Hyperinflation (pricing) is impossible to predict. The best we can do is measure the money supply and its growth, as we did here.
But we can say the following: if the supply of basic money increases, and the demand for this money is less or not at all, then prices will rise. Other things being equal, a growing monetary base will always undermine the purchasing power of money.
And a few more comments before welet's move on to the conclusions. Remember that we are talking about the 30 largest currencies in the world over the past 50 years. This list does not include, for example, Zimbabwe and Belarus, but the markets of these countries are so tiny that their hyperinflation can hardly somehow affect the overall picture.
As for the euro, in cashless payments, theywere used since 1999, and were issued in cash in 2002. However, the ECB has a history of physical currency reserves since 1980. So for the period from 1980 to 1999 we will calculate the inflation of the euro monetary base for these physical money, and since 1999 we add to them bank reserves.
For clarity: the global mixed inflation indicator for fiat currencies is calculated using a raising coefficient for the monetary base of each country based on the size of their share in dollar terms for the current month. This weight changes as new currencies are added to the analysis.
As already mentioned, only about 15 currencies havehistorical data until 1970. Those currencies for which data are insufficient are not taken into account in the relevant periods. For example, the weight of the American dollar in 1970 was 63% of the total money supply, and today it is only 17%, because, among other things, data for China only begins in December 1999.
Regarding the average annual growth rate in complexpercent, then it is always calculated on the basis of the monthly increase in fiat units, and then recalculated at the annual interest rate at a compound interest rate (up to the 12th exhibitor). This is necessary to account for the monetary bases of countries such as Brazil or Argentina, in which only since 1970 there were 6 and 4 different currencies, respectively.
For Brazil, it makes no sense to countthe average annual growth rate is from 1970 to 2019. Therefore, it is worthwhile to fix the monthly rate over time and then perform compounding, ignoring those 6 months in which the central bank cut off excess zeros from the old currency.
The same method (compounding monthly growth rates to annual growth rates), of course, was also applied to supply curves of gold, silver and Bitcoin - for data consistency.
In our podcast @crypto_voices, @fernandoulrich and I explored the various economic nuances of Bitcoin as a contender for the role of a global monetary base, global money.
We expressed the result in the form of a detailed table (English). The base money of 114 countries is reflected in 30 leading currencies, including gold, silver and bitcoin supply volume. This is a consolidated offer of almost all of the world's base money. Justifications and methodology are given here. Data on fiat money bases are taken from the balance sheets of central banks, for gold and silver from the famous analyst Nick Laird, and about Bitcoin from @coinmetrics and @coinmarketcap.
This penultimate diagram shows how Bitcoin's supply volume (in dollar terms) relates to all other monetary bases of the past and present.
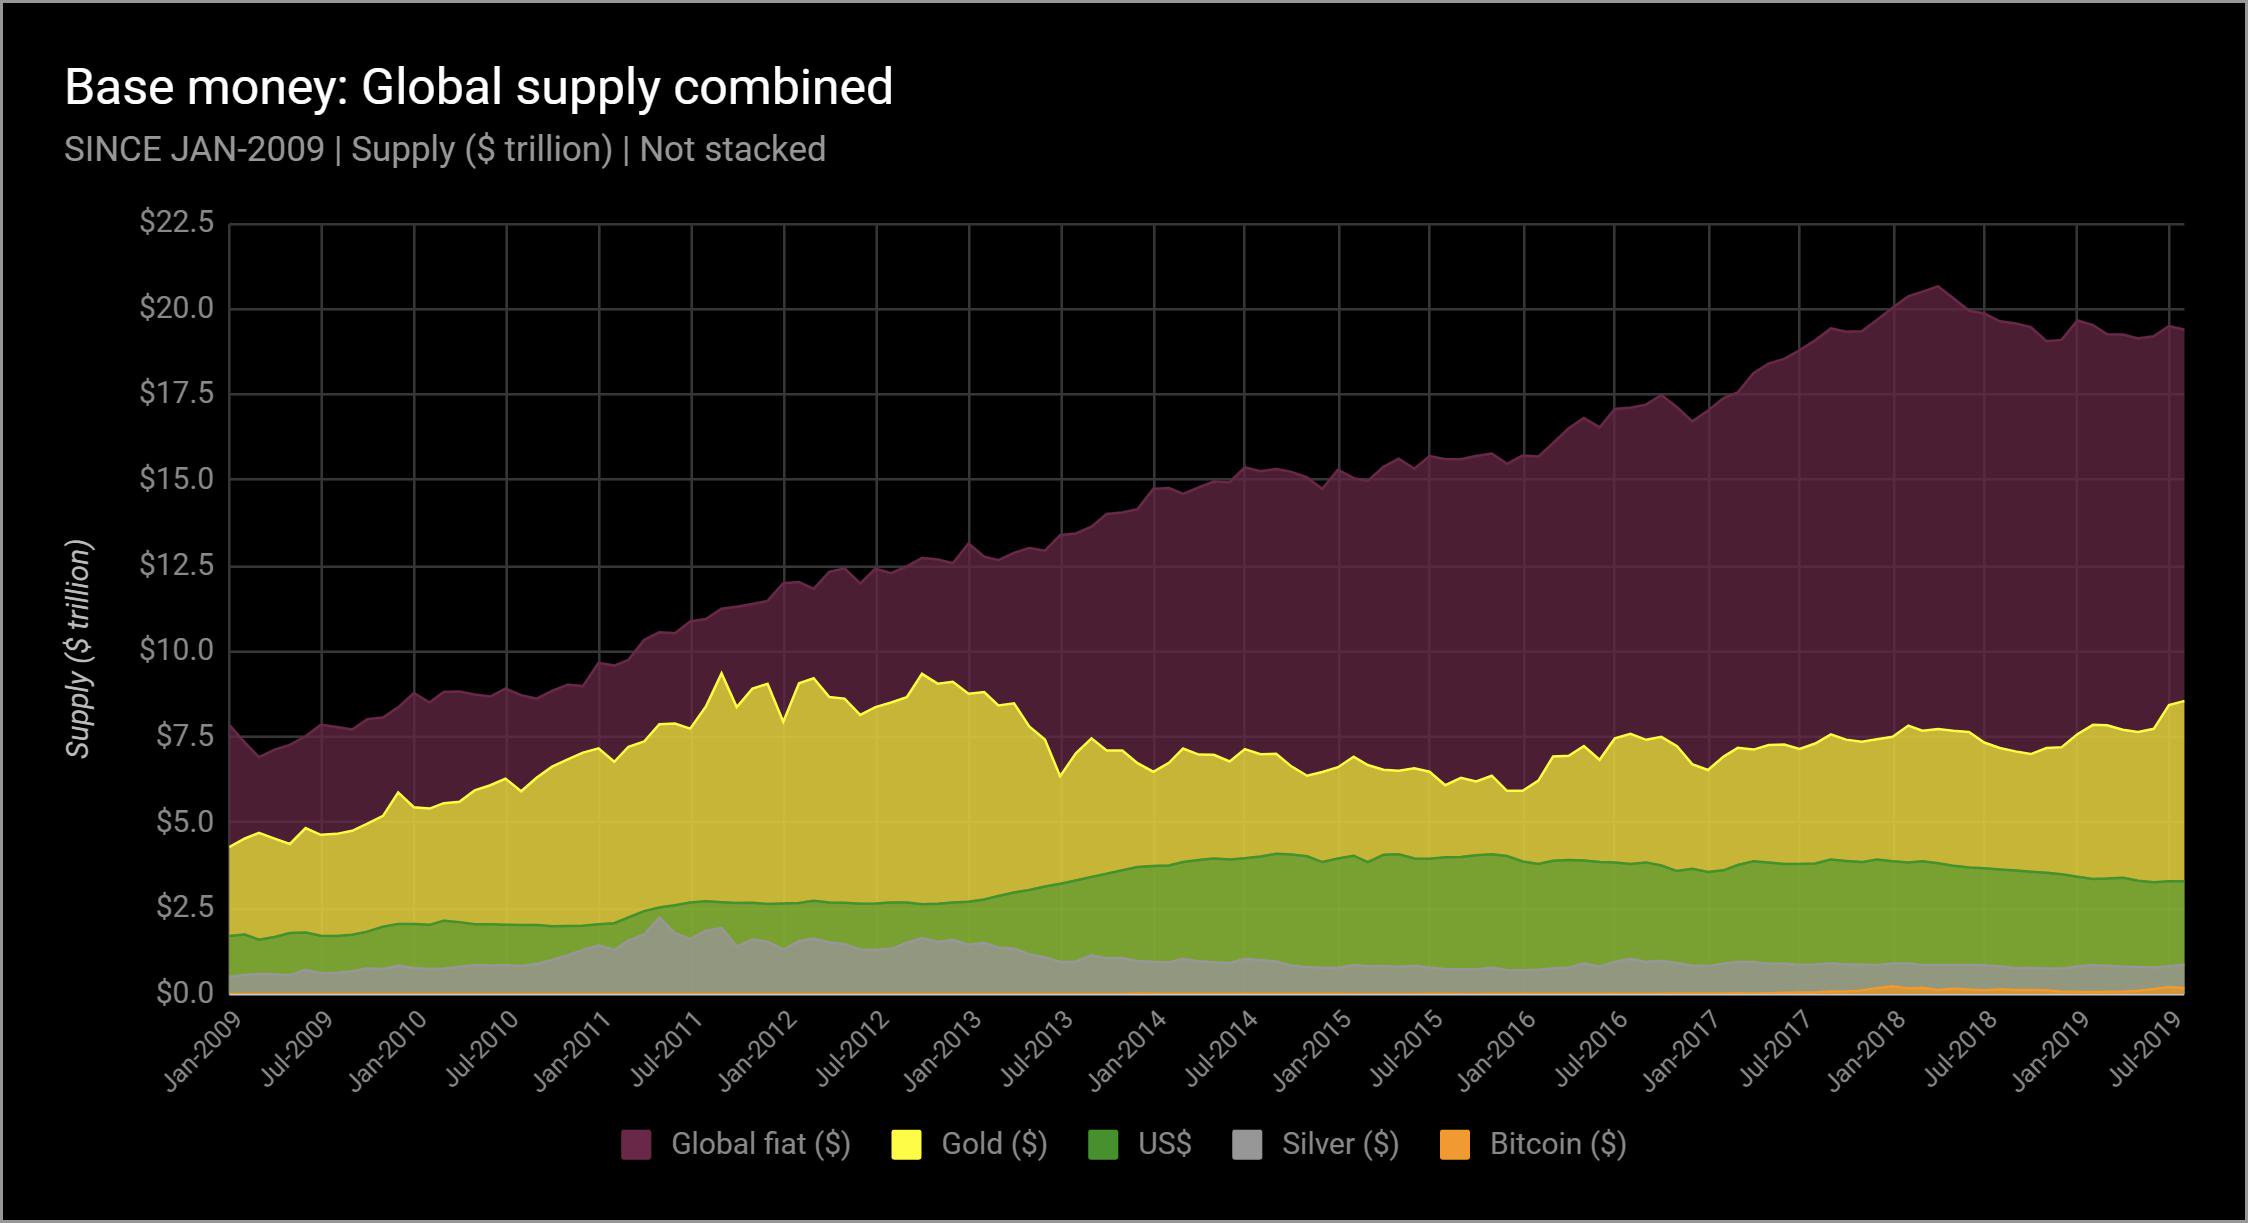
World supply of monetary bases (trillion $) since January 2009
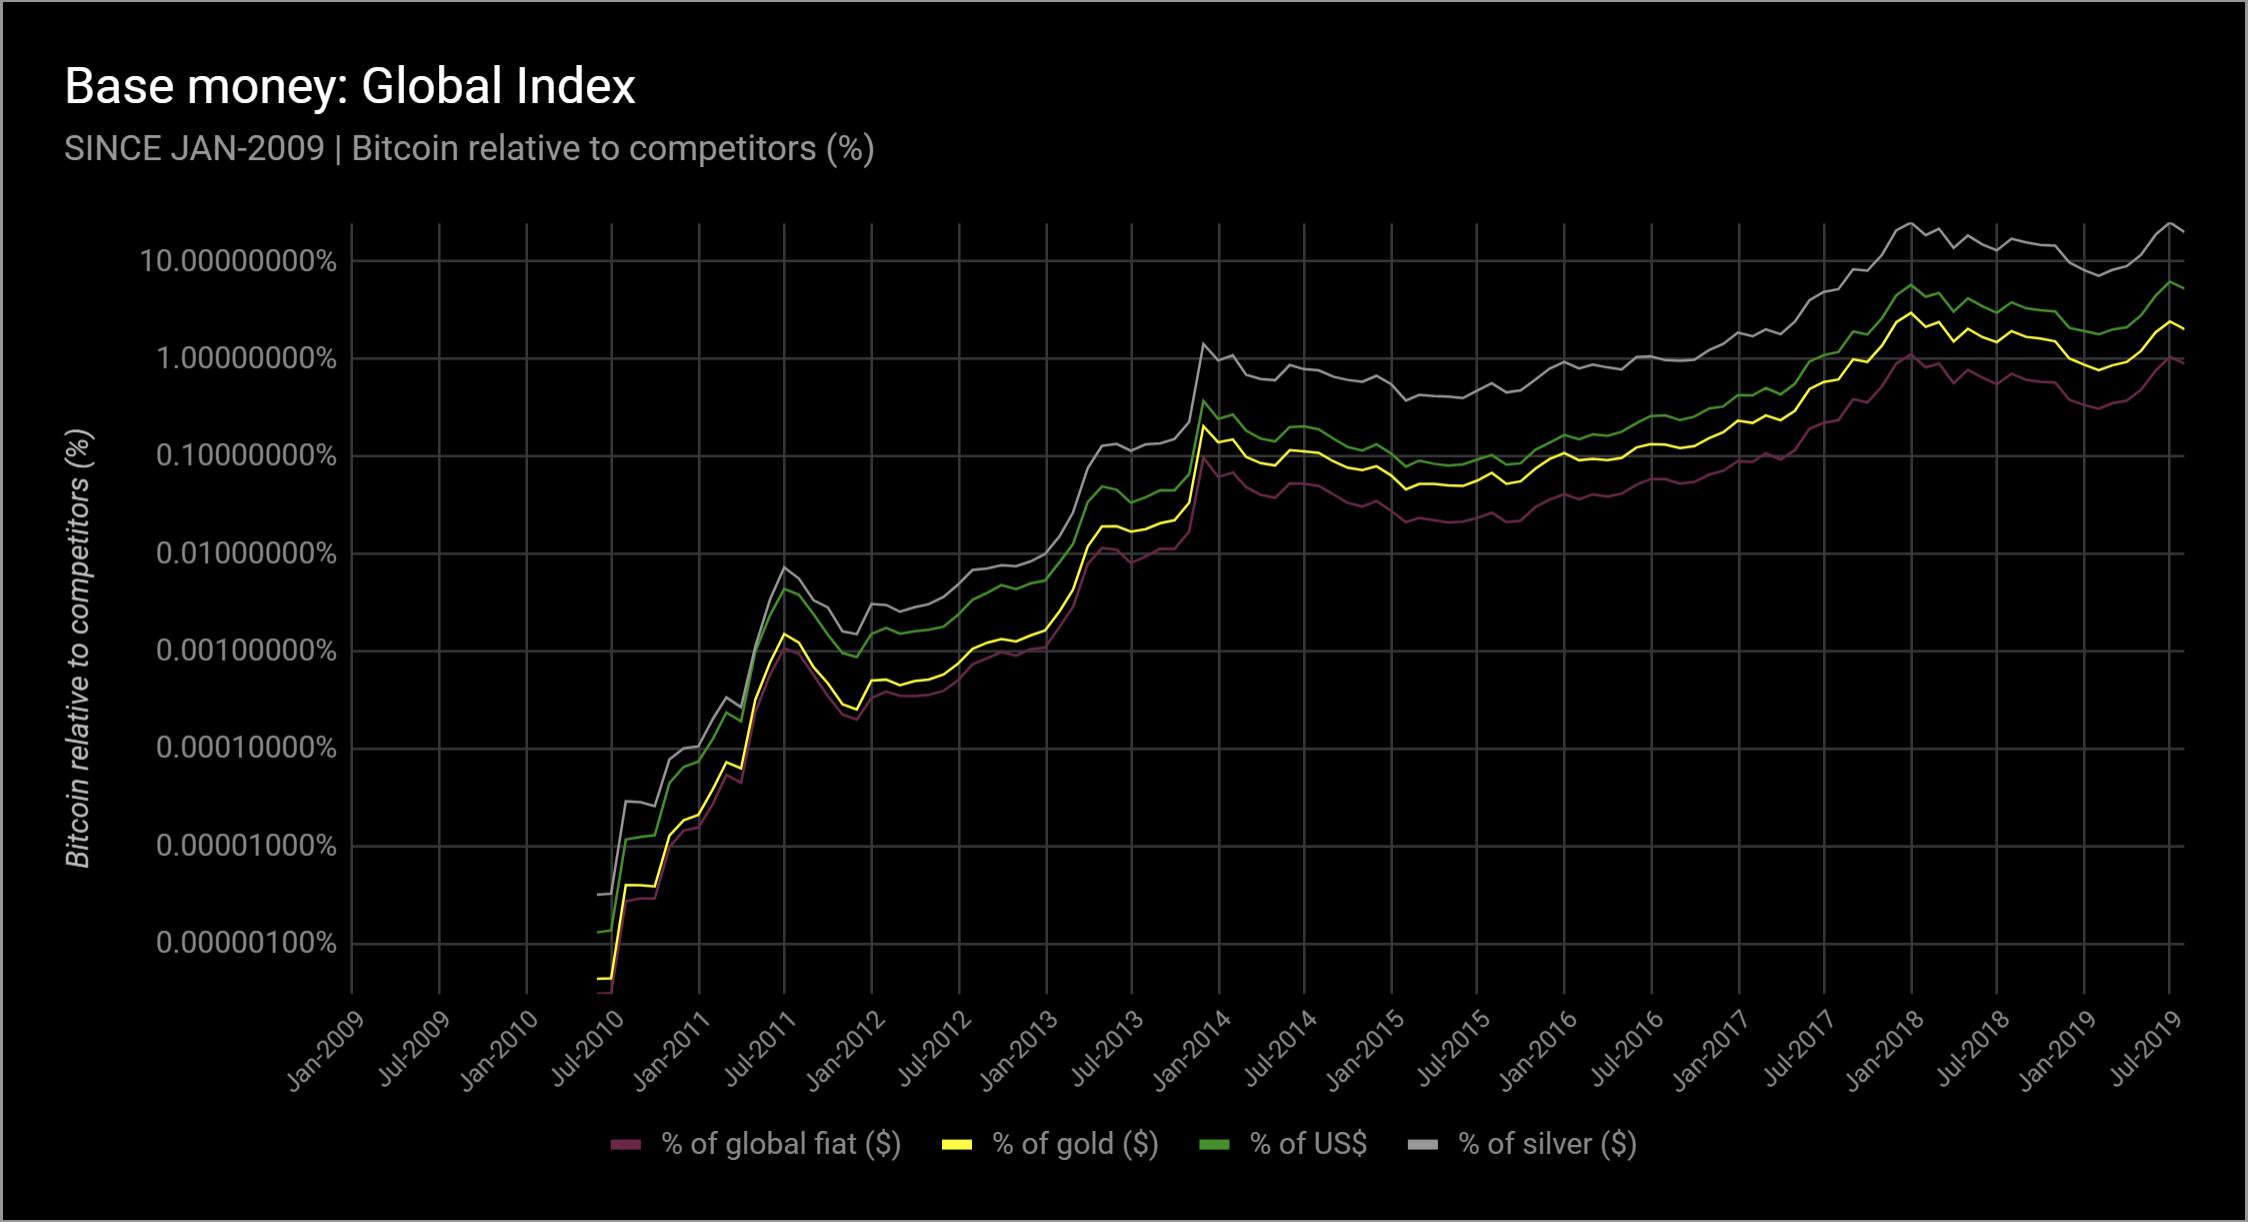
Global monetary base index since January 2009. The scale on the left is% Bitcoin in comparison with competitors.
Finally, it may cause curiosity at whichAt the BTC price, Bitcoin's capitalization will surpass the money supply base of each country (including also the capitalization of gold and silver). Here is the chart. It remains only to add that this is simply the result of calculation and in no case a price forecast.
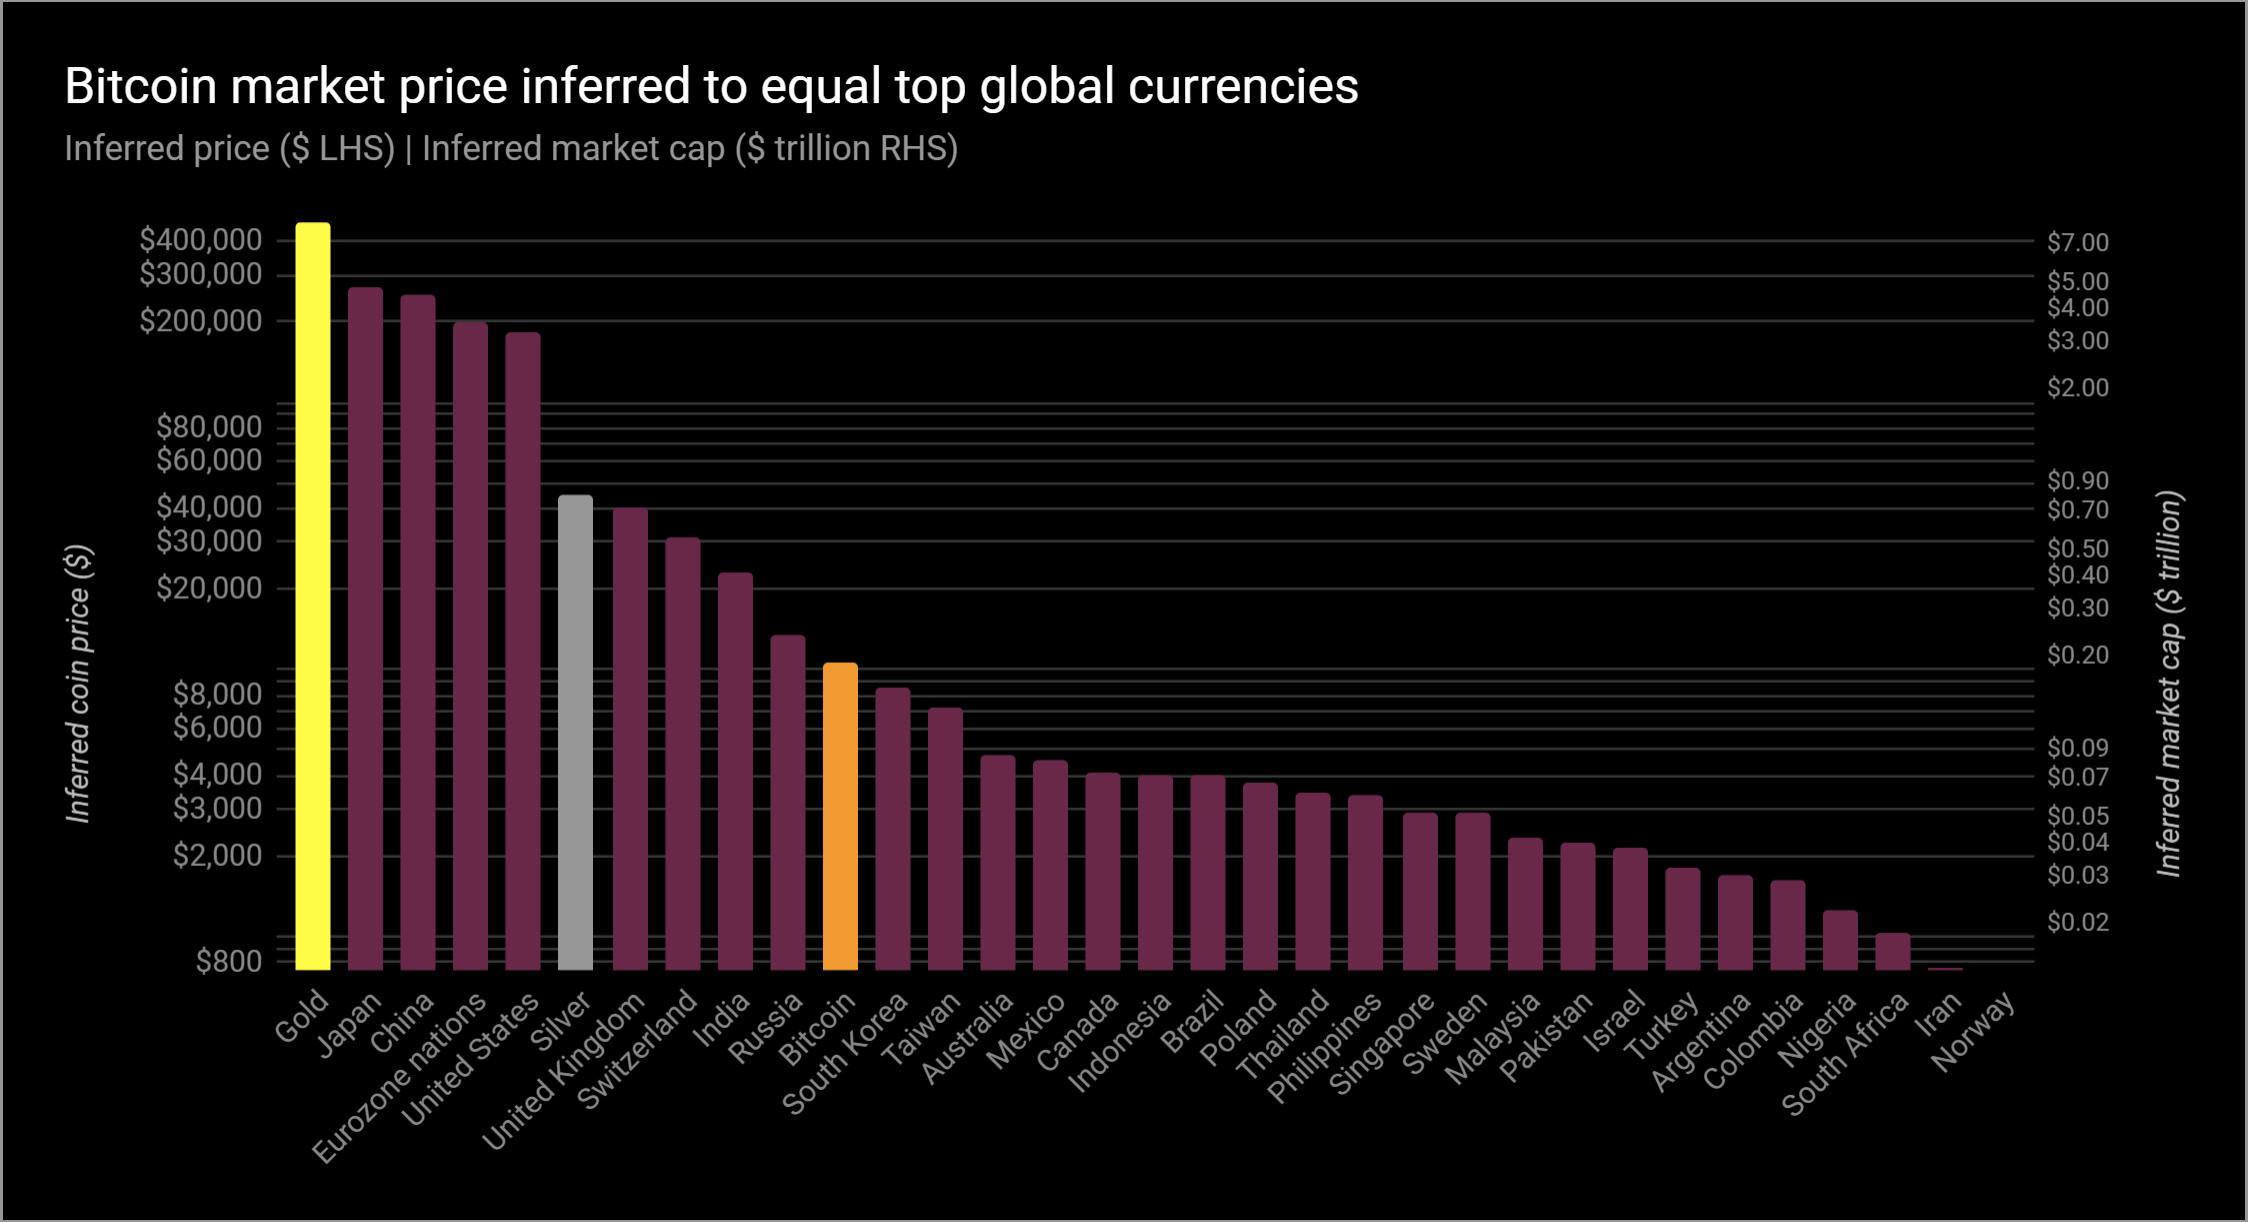
BTC price at which Bitcoin's capitalization equals the largest currencies in the world.
</p>
Read this:
 Steve Forbes: “Bitcoin is a way to fight authoritarian governments”
 The largest Thai cryptocurrency exchange Bitcoin Co. closes after 5 years of operation
 TOP 7 cryptocurrency news for the week of September 9-15
 Bitcoin: when is it best not to buy
 Cryptocurrency world news for the week of October 7 to 13, 2019
GRAMM is the currency of Durov.
Cryptocurrency world news for the week of October 7 to 13, 2019
GRAMM is the currency of Durov.