The history of economics and finance is replete with examples of oddities and data inadequacies. Numerouseconomic time series are marked by sharpjumps and sudden trend reversals. Some well-known examples include fiat currency crashes, financial crises, sudden crashes and other external shocks resulting from higher commodity prices (such as oil) or events such as wars and (more urgently now) pandemics.
Although the cryptosphere is still relativelyIn its infancy, some well-known network / on-chain data and market data anomalies already exist; some of them are so exceptional that they may seem like errors to the untrained cryptohistorian. But like most deviations in economic history, there are explanations - be they benign or extraordinary. Nonetheless, the novelty of the cryptosphere presents new developments to explore, such as network attacks and software glitches, whether intentional or not.
Ethereum DoS attacks in 2016
Daily active addresses are one of the mostpopular on-chain metrics of network activity and a trusted indicator of the number of blockchain users. Tracking daily active addresses over time is often a cryptanalyst's starting point for assessing trends in network usage and adoption. But for Ethereum, a few cryptic days towards the end of 2016 have certainly cast a shadow over the analysis of netizens since its inception in 2015.
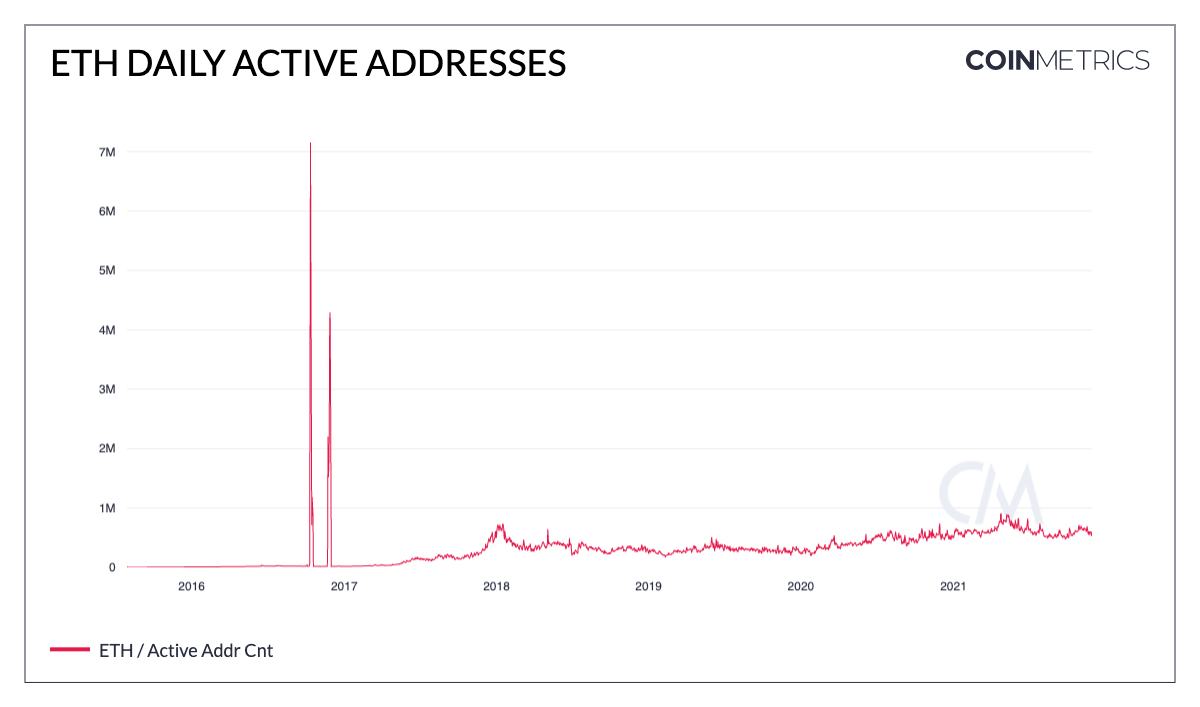
Daily active ETH addresses.: Coin Metrics Network Data Charts
As of 10 October 2016, there were about52k active Ethereum addresses. And just two days later, on October 12, there were just over 7 million of them. But netizens couldn't grow more than 100 times in a matter of days? This is true because millions of new active accounts were empty and generated due to a Denial of Service (DoS) attack on the network. In a DoS attack, the network is overloaded with redundant operations in order to slow down or interrupt service to real users.
DoS attacks on the Ethereum network began at the endSeptember 2016, when the attacker (s) identified an operation that was relatively cheap to perform continuously (in terms of gas charges), but computationally expensive for nodes on the network to process. A massive influx of contract calls flooded the network and led to large delays in transaction processing times. Short-term fixes were implemented, but soon after, another attack began, lasting over a month.
The impact of the attack also manifests itself in the dailythe number of calls to smart contracts on Ethereum, which has skyrocketed as attackers repeatedly sent spam to the network in September and October 2016.
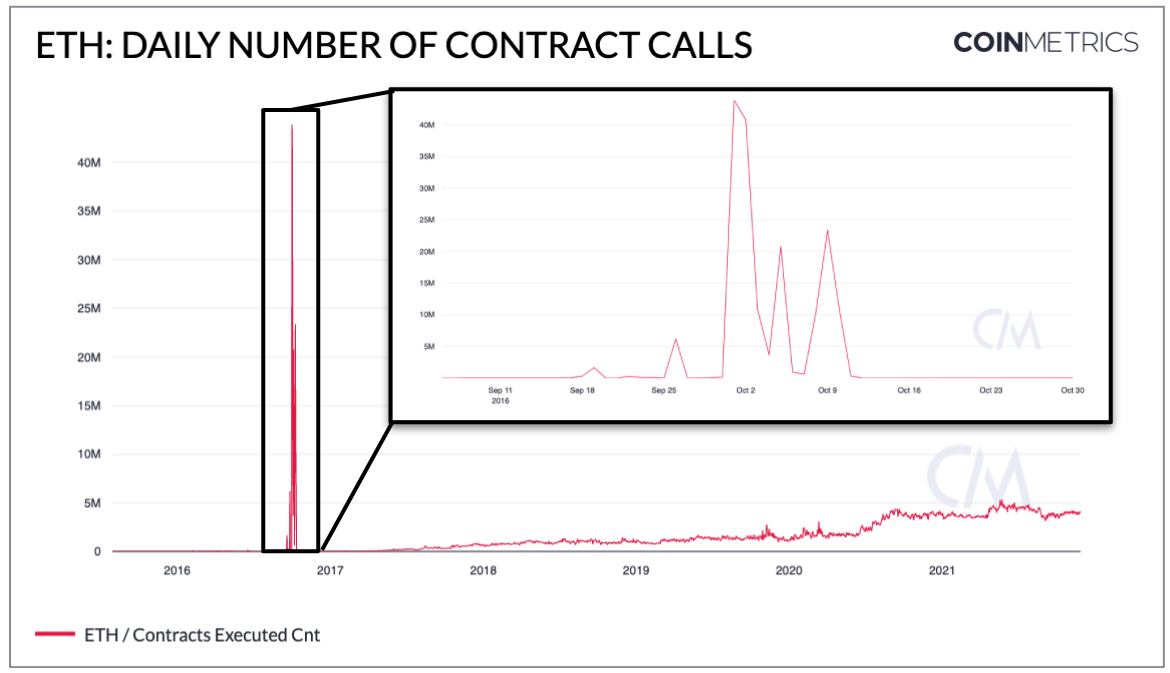
Daily number of smart contract calls.: Coin Metrics Network Data Charts
After all, low-cost transactionsThe attacker created about 19 million empty accounts on the Ethereum blockchain. Ethereum subsequently underwent two hard forks that helped stop the attacks and secure the network. The first fork dealt with underpriced transactions, and the second one removed empty accounts that inflated state, or data that nodes must store in things like Ethereum account balances (note that this removal of empty accounts is an explanation for the second abnormal surge number of active addresses in November 2016).
2016 DoS attacks were ultimately the testfault tolerance for the Ethereum blockchain. Given the extreme nature of the event and the low likelihood of its recurrence, it is recommended that the analysis of Ethereum adoption and use is correct or excluded for this time period.
On-chain transfer anomalies
Another cryptometrics that is subject tosharp outliers is the metric of daily transfers recorded by the on-chain. On an unadjusted dollar basis, the cost of a BTC transfer soared to more than $ 350 billion on September 14.
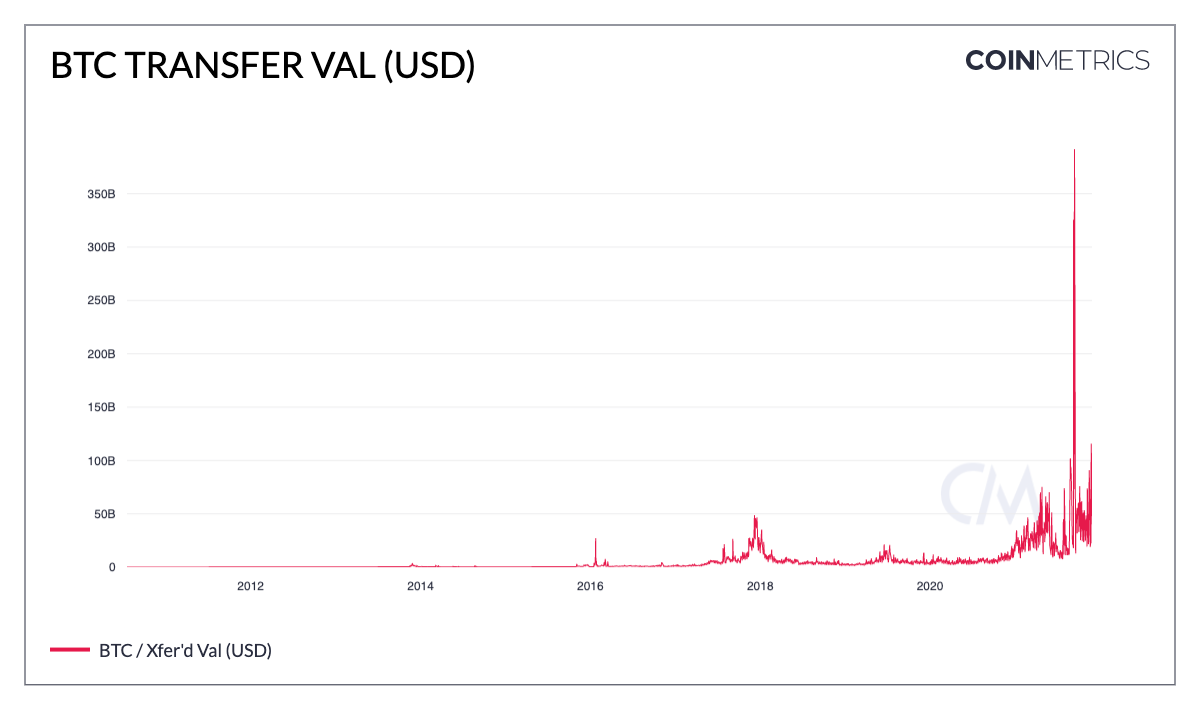
Cost of BTC transfers in dollars.: Coin Metrics Network Data Charts
Of course, with such a sudden increasethere is a certain level of intrigue, but often the reason itself is more innocuous. For example, this particular increase was likely due to the transfer of BTC between accounts owned by FTX. Exchanges are often the network entities behind these surges of transferred value, as they sometimes move large numbers of coins internally to meet withdrawal needs or to move between cold wallets. For this reason it is often better to look atadjustedtransfer metrics that eliminate economically insignificant activity and transfers between own wallets.
NFT to Ethereum transfers offer one moreexample. Although NFT had a breakout year, NFT growth in 2021 was overshadowed by short-term, extreme growth in daily NFT transfers at the end of 2019.
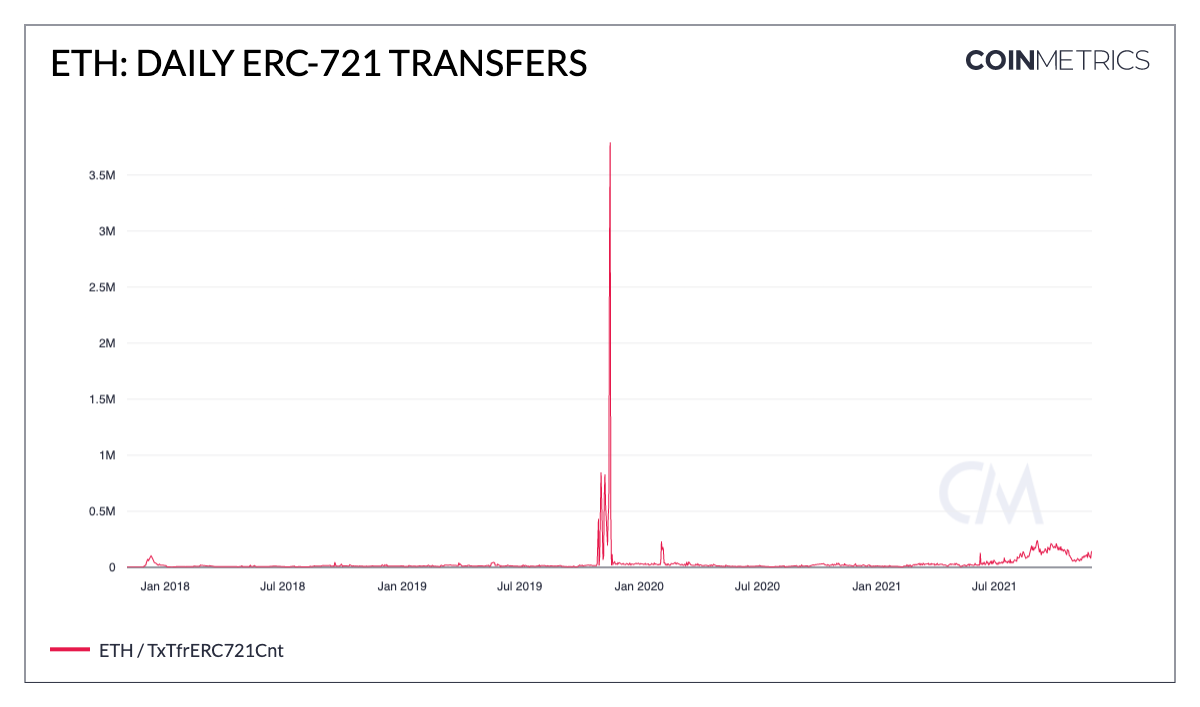
Daily ERC-721 transfers.: Coin Metrics Formula Builder
During the peak of this year's NFT mania on September 5~ 240 thousand transfers of ERC-721 tokens were registered, which is more than 20 times higher than the average daily rate in January this year. But, returning the dataset to the start of the ERC-721 standard in 2017, there were ~ 3.8 million NFT transfers in Ethereum on November 19, 2019.
Om this anomaly was an NFT card gameGods Unchained. The game cards were previously stored off-chain and then “activated” (ie released) all at once, which triggered a sudden wave of on-chain transfers. Given the scale of the project and the staggering number of NFTs, Gods Unchained has since migrated to Immutable X, a tier 2 scaling solution that the Gods Unchained team developed for NFTs on Ethereum.
Ethereum Time Bomb
Transition from a consensus mechanism«Proof of Work» (PoW) to the consensus mechanism «Proof of Ownership» (PoS) has long been a stated goal of Ethereum, dating back to the network's inception. In an attempt to motivate developers, miners, and users to quickly adopt PoS, an update to the protocol introduced a (now infamous) feature known as the “difficulty bomb” in early 2015.
In PoW, the difficulty parameter specifies how muchit is computationally difficult for miners to add new blocks to the chain. The difficulty is regularly adjusted to the desired time between blocks (10 minutes for Bitcoin, ~ 13.5 seconds for Ethereum). With the difficulty bomb, the idea is that the difficulty of mining in Ethereum will increase exponentially to the point where miners can no longer find new blocks, thus being forced to switch to PoS.
But as Ethereum's PoS chartchanged, the difficulty bomb was constantly defusing - but not before it left its mark on the interval between the blocks. The graph below shows the average interval time over the entire history of Ethereum, with ups and downs as the difficulty bomb approaches and lags behind network hard forks.
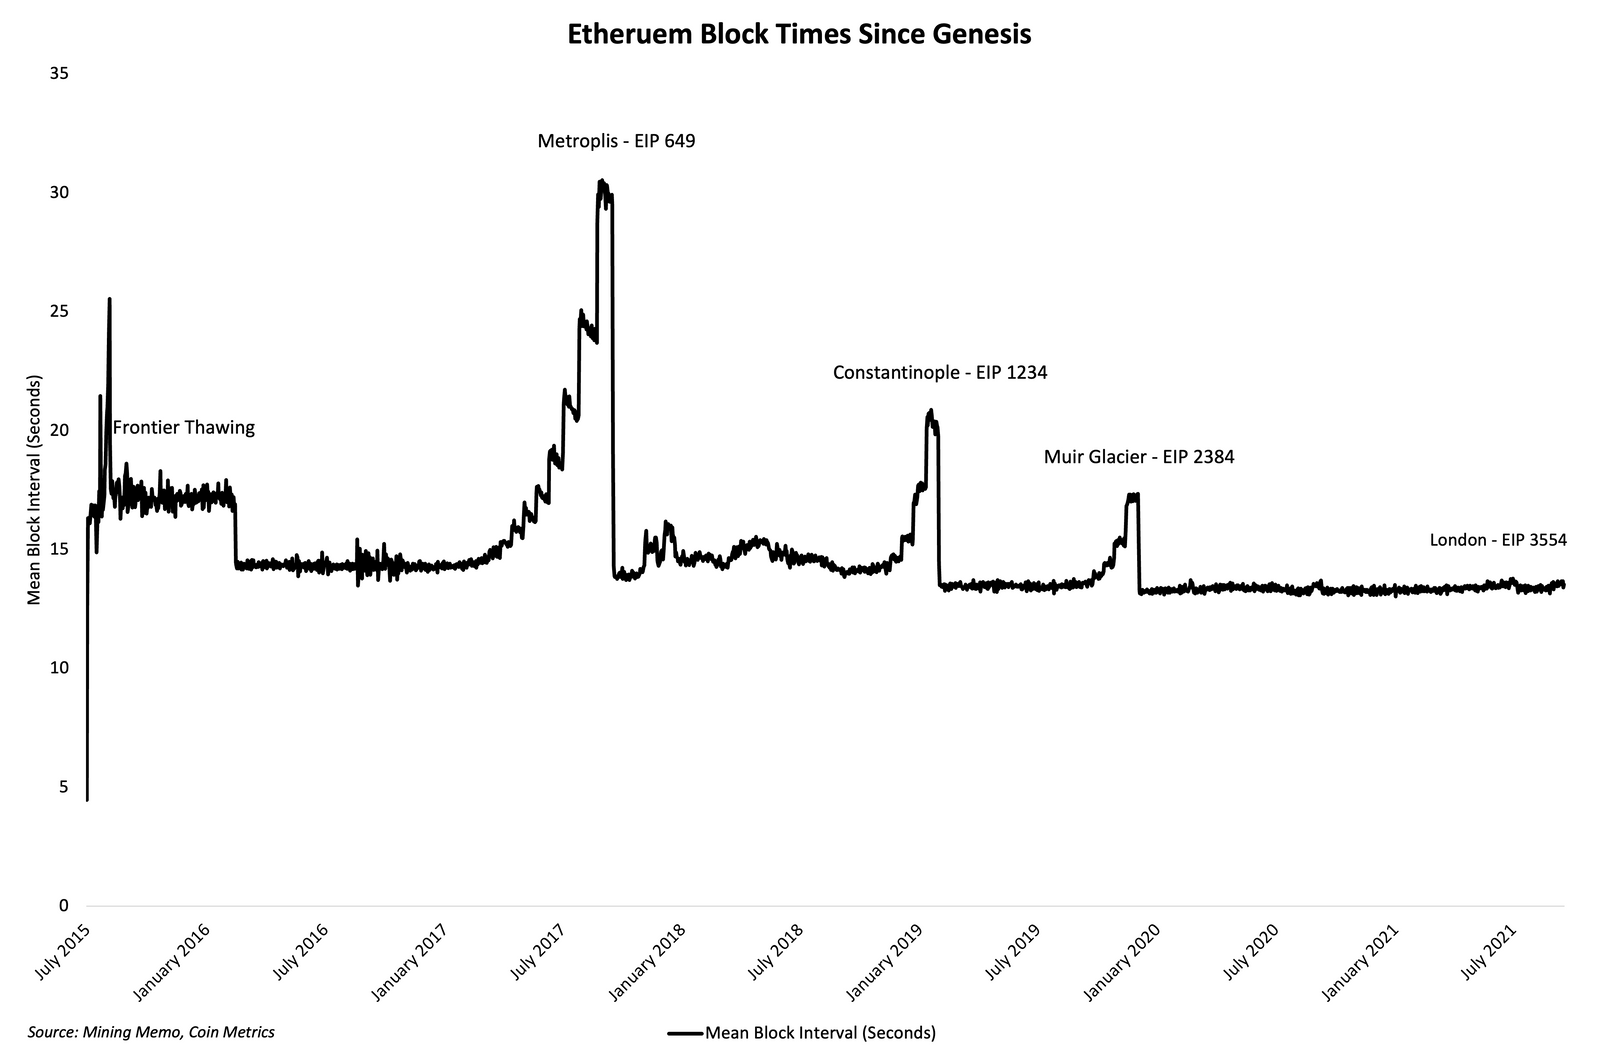
The interval between Ethereum blocks since the founding of the network.: Compass Mining Memo
Threatening, complexity bomb nowrather, it performs a procedural role that requires ETH core developers to periodically launch the notorious bank in the future (for example, the bomb will again be postponed from December 8 to June 2022). Interestingly, it also served an additional function, forcing those who want to keep working with Ethereum to upgrade their nodes. But given the recent progress in moving to PoS, the difficulty bomb on the Ropsten testnet in particular will not be delayed as the developers intend to try and run PoS on the testnet before the bomb goes off.
Stellar inflation error
Software bugs are another sourcecryptanomalies. In 2017, Stellar faced an inflationary error that generated 2.2 billion XLM from an exploit, causing a clear deviation from the XLM delivery schedule.
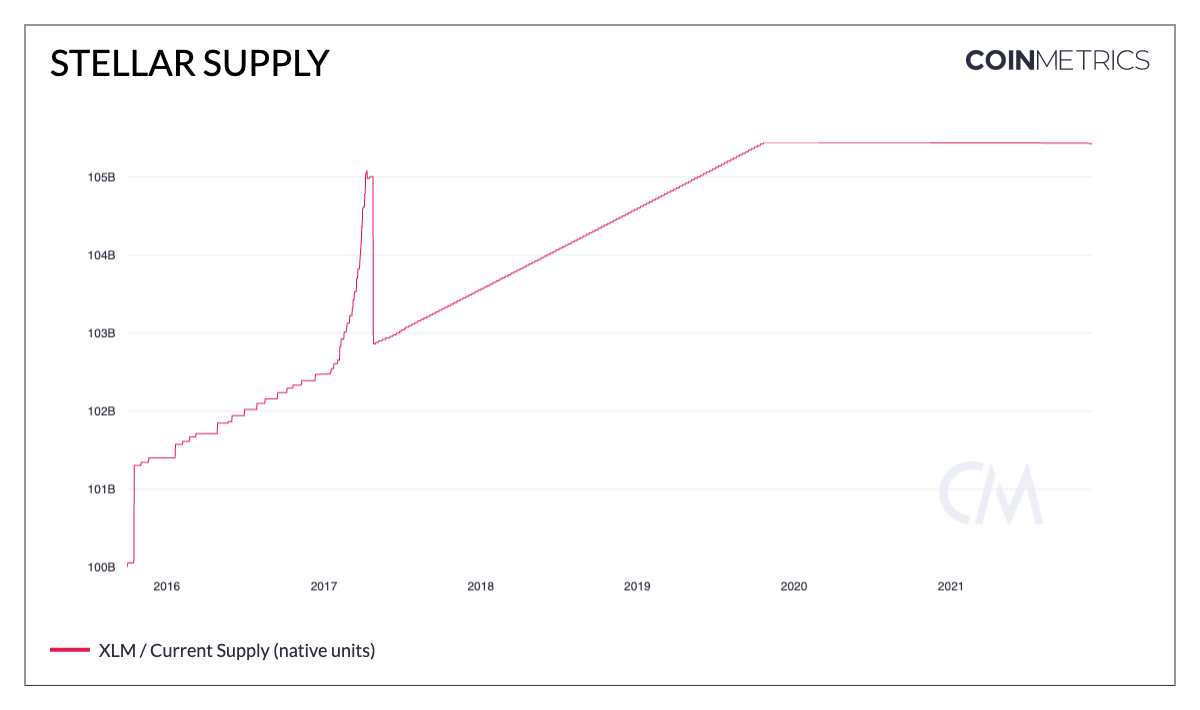
Stellar offer.: Coin Metrics Network Data Charts
The Stellar Development Foundation publicly disclosed and corrected the error and took the additional step of burning the XLM it held in reserve in order to bring supplies back on schedule.
Conclusion
The above examples are some of thelargest data anomalies often faced by cryptanalysts, but this list is not exhaustive. Other data anomalies can arise from crypto-native mechanisms such as flash credits in DeFi; a recent example is a crypto bank that “sold” for $ 532 million. Similar to traditional financial markets (for example, the sudden crash in May 2010), crypto markets have also shown their fair share of misjudgment and disruption. Ultimately, crypto markets and blockchains are continuously producing data and will inevitably give off statistical outliers. Sometimes these numbers will carry signals, but in many cases they will simply be noise.
BitNews disclaim responsibility for anyinvestment recommendations that may be contained in this article. All the opinions expressed express exclusively the personal opinions of the author and the respondents. Any actions related to investments and trading on crypto markets involve the risk of losing the invested funds. Based on the data provided, you make investment decisions in a balanced, responsible manner and at your own risk.
</p>
Read this:
 Ethereum Network Upgrades Muir Glacier
 On January 2, a hard fork will be held on the Ethereum network to delay the activation of the complexity bomb
 One of the largest retailers started paying salaries in digital yuan
 Blockchain explanation in 7 steps - simple and affordable
 Ethereum will increase emissions for miners by 2000 ETH per day
 Hard fork held on Ethereum network