2022 was a tough year for Bitcoin and Ethereum as their values fell hard and fast. Given the extensivethe duration and extent of the destruction of capital, it can reasonably be argued that 2022 is the most significant bear market in the history of digital assets.
To date, 2022 has been historicallydifficult year for financial asset prices as stocks, bonds and digital assets struggle in an ever-tighter monetary environment. Inflation and tightening liquidity have put extreme pressure on the over-leveraged crypto ecosystem. Most of the recent problems stem from high leverage coupled with re-mortgages of repayable collateral, both on-chain and off-chain.
In the midst of this, Bitcoin and Ethereum traded lowerhistorical maximum of its previous cycle, which happened for the first time in history. Subsequently, this resulted in a significant part of the market taking unrealized losses, and all investors in 2021-2022 were at a loss. As financial pain mounts, a growing proportion of investors are liquidating their holdings, recording record realized losses.
In this article, we explore the magnitude andthe statistical scale of capital destruction that is observed for both bitcoin and ethereum. The goal is to find out how significant the recent sell-off is and to make comparisons with previous cycles as an assessment of the damage done.
Bitcoin: drawdown and duration
First, let's evaluate the scale and durationbitcoin's current drawdown compared to the bear cycles of 2015, 2018 and 2019. Also consider two definitions of the 2021-2022 bear market, one starting on April 14, 2021 and the other on November 8, 2021. Many signals indicate that the former is the most appropriate as the May 2021 selloff seems to be the true source of bearish sentiment in the market as a significant portion of marginal buyers and sellers have been pulled out of the market.
Historically, bear market lows have been set with BTC drawdowns ranging from -75% to -84% from all-time highs and lasting from 260 days in 2019-2020 to 410 days in 2015.
With the current drawdown reaching -73.3% below the November 2021 high and lasting from 227 to 435 days, this bear market is within historical norms and scope.
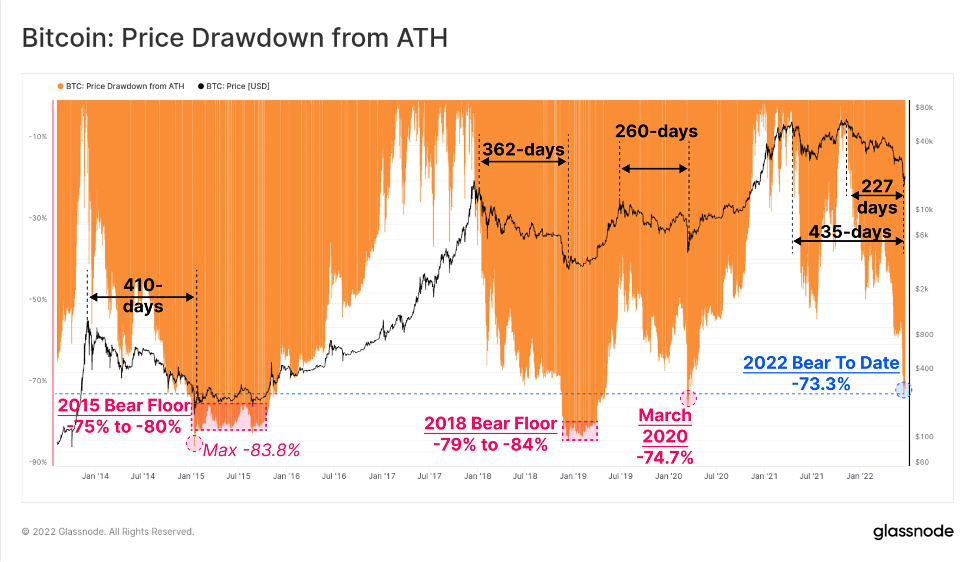
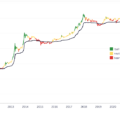
Price drawdown from all-time high (updated source)
Mayer Multiple is a metric derived fromone of the most widely used indicators in technical analysis, the 200-day simple moving average. The 200-day moving average is commonly used to mark the inflection point between a technically bullish/bearish market.
- When prices trade below the 200-day MA, this is often considered a bear market.
- When prices are trading above the 200-day MA, bullish.
Over the years, macroscale pricebitcoin's movement has generally been in line with this framework. Taking the 200-day moving average as a long-term average, the Mayer Multiple (MM) captures price deviations above and below to indicate overbought or oversold conditions, respectively.
For the first time in history, in the 2021-2022 cycle, there werea lower value of MM (0.487) was recorded than the minimum of the previous cycle (0.511). Only 84 out of 4160 trading days (2%) recorded the MM closing value below 0.5. The chart below shows in green the price range corresponding to an MM value of 0.5 and how many days have been spent below it throughout history.
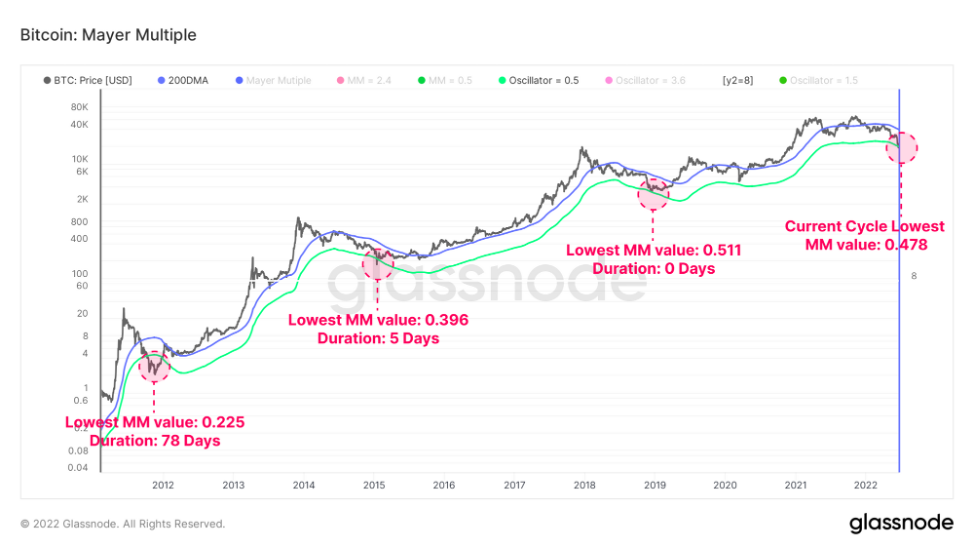
Mayer Multiple (updated source)
Bitcoin Fundamental Value Changes
Using on-chain analysis, we can evaluatechanges in the fundamental patterns of bitcoin valuation based on the actual holding and spending patterns of coins. In particular, changes in the aggregate average cost of a coin, as measured by the realized price, can be used to estimate extreme capital outflows and investor realized losses.
- The realized price will rise as investors spend coins accumulated at lower prices, revaluing them higher. This is typical of bull markets and profit taking.
- The realized price will decrease ashow investors will spend coins accumulated at higher prices as they realize losses and reflect a net capital outflow. This is typical of bear markets and market capitulations.
Times when spot prices trade lowerrealized prices are rare because the current market is only the third in six years. The last two events were the COVID crisis in March 2020 and the capitulation in November 2018, both of which ended the bearish market cycle.
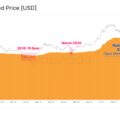
Spot prices are currently trading at an 11.3% discount to the realized price, which means that the average market participant is currently at a loss.
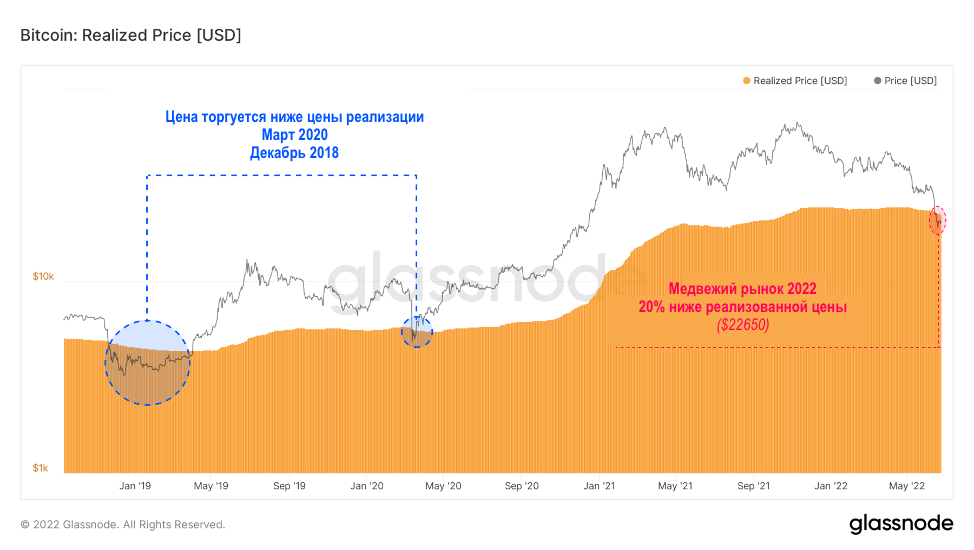
Realized price (updated source)
We can derive the MVRV coefficient which isis an oscillator that compares the ratio of market value to realized value. This allows large deviations from the mean to be visualized.
The chart below shows the blue zones where spot prices are trading lower than realized prices. These events account for 604 of the 4,160 daily closes, equivalent to just 13.9% of trading days.
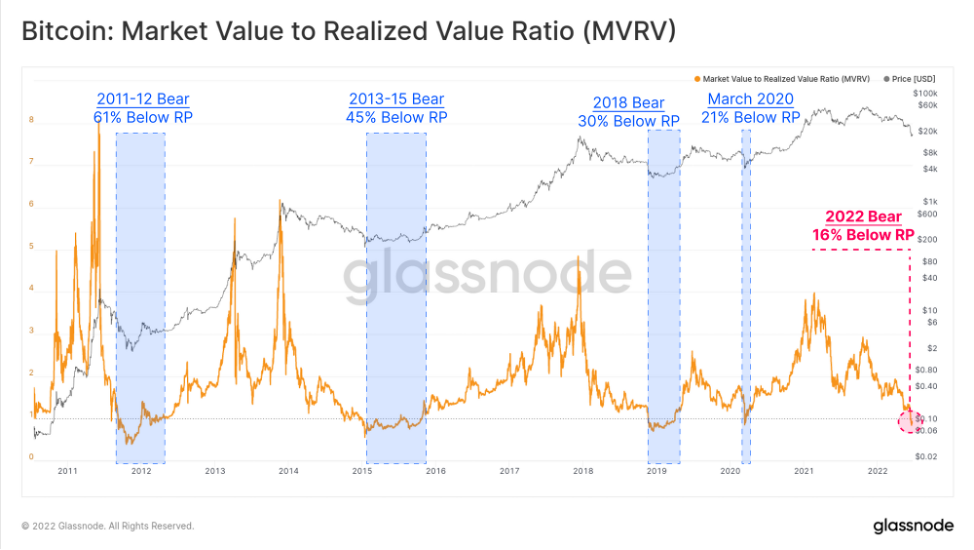
MVRV (updated source)
The parent element of the realized priceis the realized limit, calculated as the sum of all coin volumes (BTC) multiplied by the price point when they were last moved. This metric gives us an idea of the intrinsic value stored on the network.
30-day change in realized capitalization(Z-score) allows you to view the relative monthly capital inflow/outflow in BTC on a statistical basis. By this measure, bitcoin is currently experiencing the largest capital outflow in history, hitting -2.73 standard deviations (SD) from the mean. This is a whole SD more than the next big events that occurred at the end of the 2018 bear market and again during the March 2020 selloff.
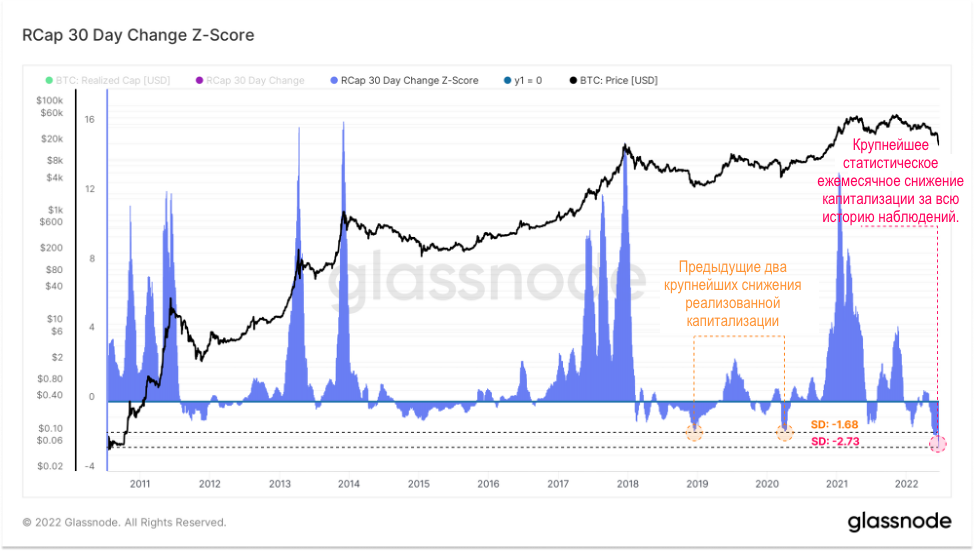
30-day change in realized capitalization (z-score) (updated source)
Capturing Losses
Let's evaluate the scale of these losses as an indicator of how network members reacted to many years of uncertainty and financial difficulties.
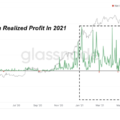
Net realized profit/lossreflects the net capital flow regime caused by investors spending their coins on any given day. The recent collapse in prices to $20,000 was accompanied by the largest daily realized loss in US dollars in history. Investors collectively posted a loss of -$4.234 billion in a single day, up 22.5% from the previous record of $3.457 billion set in mid-2021.
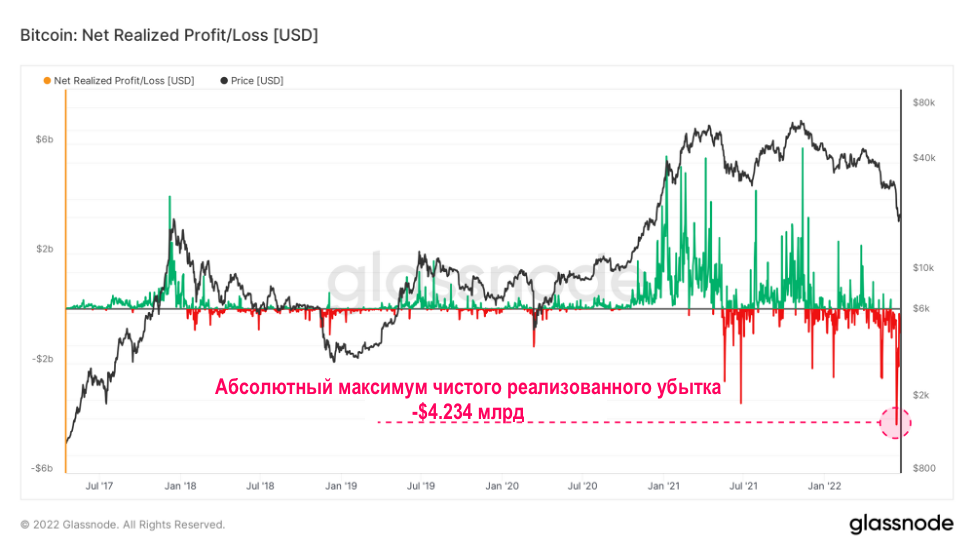
Net realized profit/loss (updated source)
As the BTC market matures overtime, the value of potential losses (or profits), expressed in US dollars, will naturally increase along with the growth of the network. However, even on a relative basis, this does not diminish the severity of the over $4 billion net loss.
Estimating the net realized profit/loss inBTC, which actually normalizes for market size, the current drawdown locks in realized losses equivalent to -98,566 BTC per day (0.52% of circulating supply). There were only two trading days with larger realized losses recorded during the 2011 bear market and in March 2020.
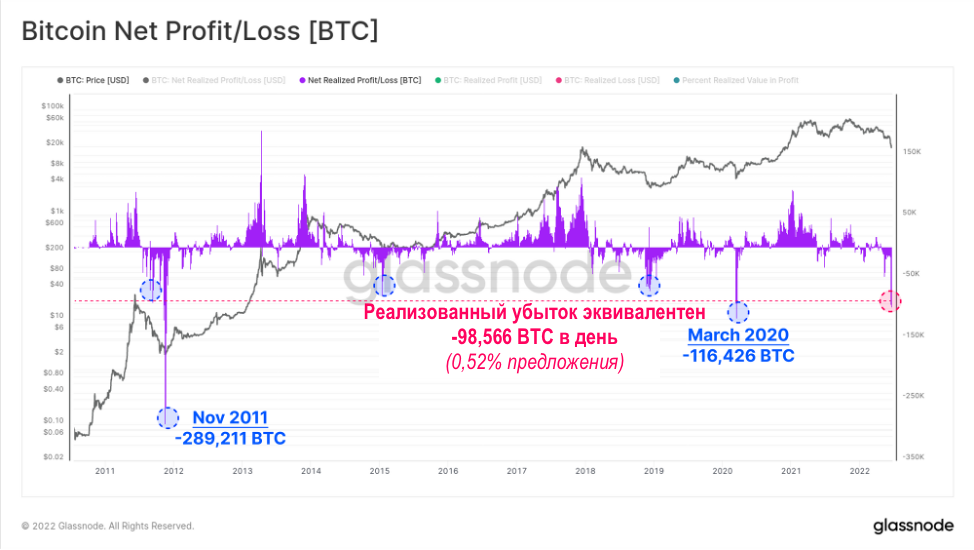
BTC net realized gain/loss (updated source)
We have established two concepts:
- Bitcoin spot prices are trading well below the realized price, indicating that the average market investor is at a loss;
- updated spending behavior resulted in extraordinary and historically significant net losses.
Following this, we can take the relation betweenactual spending of coins and realized capitalization. This effectively reflects a normalized view of the inflow and outflow of capital depending on the size of the market.
Current value indicates negativedeviation from the mean value -0.93 SD. Only 150 days closed at a lower value, reflecting just 3.86% of bitcoin's trading history. This adds further evidence to quantify how severe the 2022 bear market was.
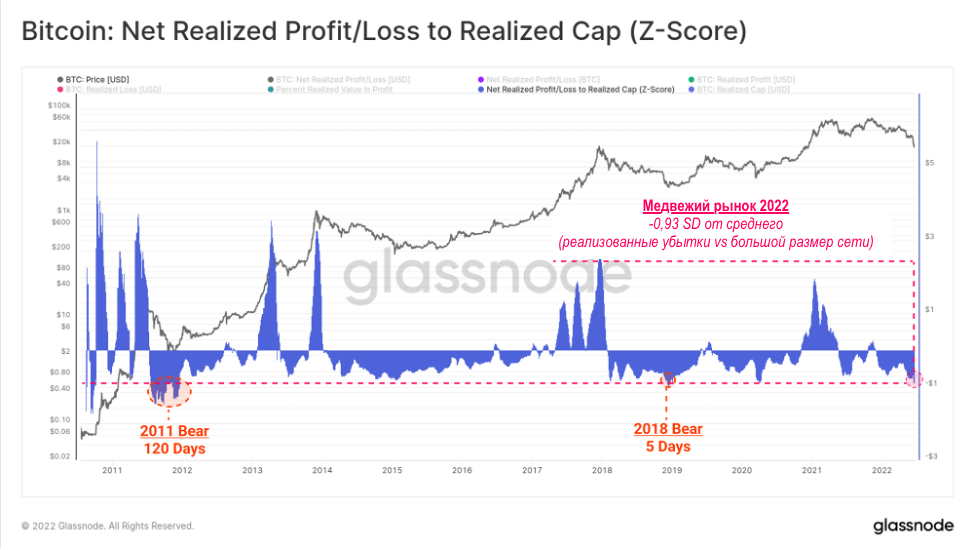
Net realized gain/loss to realized capitalization (z-score) (updated source)
Finally, we estimate the relation between the volumetransfers in loss and the volume of transfers in profit on an average monthly basis. Transfer volume is simply the amount of coins moved on-chain on any given day.
Due to the collapse of LUNA in May 2022, the ratioloss to profit reached 2.3 times. This means that the volume of losses was 2.3 times greater than the volume of profits. Historically, such one-way transaction markets have been rare, and with such a sharp decline in volume, it suggests that significant investor capitulation is taking place.
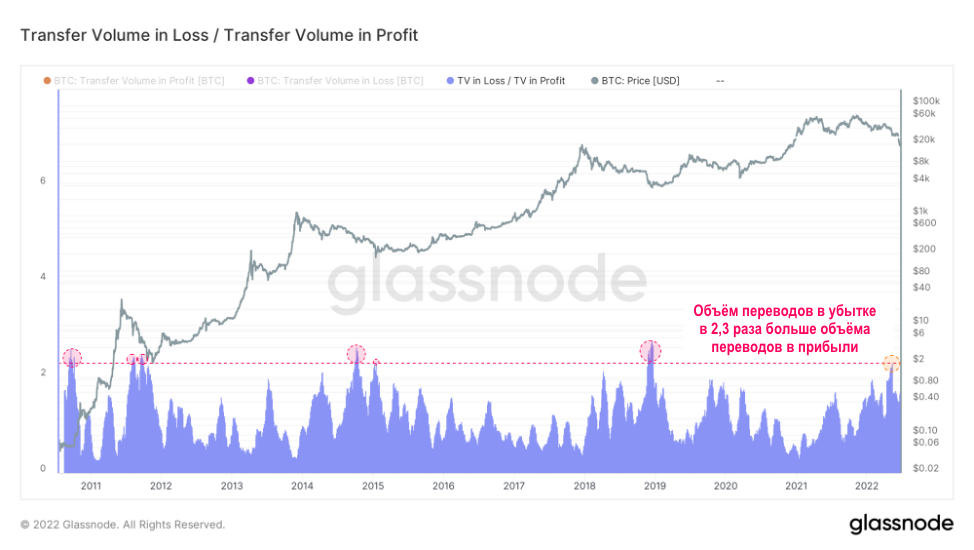
Volume of transfers in profit and loss (updated source)
To summarize the 2021-2022 BTC bear market (so far), here are some statistics and observations:
- prices fell -73.3% below the high, which coincides with the upper limit of the previous bear market lows;
- the duration from top to bottom is from 227 to 435 days, depending on where you define the start of a bear market;
- the deviation below the 200-day moving average is so large that only 2% of trading days were worse;
- the market experienced the largest monthly decline in realized capitalization in history on a statistical basis;
- this is confirmed by coin spending patterns,which resulted in both absolute and relative losses that are so large that only 3.5% of trading days saw a larger outflow of capital;
- the ratio between the volume of transfers in losses and profits has reached historically high levels, which is synonymous with a deeply troubled investor base.
It is safe to say that the bearishthe 2021-2022 bitcoin market is one of, if not the most significant in history, both in its severity, depth, and the scale of capital outflows and losses suffered by investors.
BitNews disclaim responsibility for anyinvestment recommendations that may be contained in this article. All the opinions expressed express exclusively the personal opinions of the author and the respondents. Any actions related to investments and trading on crypto markets involve the risk of losing the invested funds. Based on the data provided, you make investment decisions in a balanced, responsible manner and at your own risk.
Based on source
Read this:
 Glassnode: Bitcoin is experiencing the worst bear trend in its history
 Has Bitcoin entered a bear market or will BTC continue to grow?
 Market momentum turns bullish
 The market enters the darkest phase of a bearish trend
 $ 220 billion in realized profit for Bitcoin in 2021
 Why some on-chain analysts are predicting a bearish scenario for BTC in the short term