Or why the price of bitcoin seems to be predictable with great accuracy.
Anyone who seriously studiesBitcoin, wonders why it's sois successful and what will happen next will hardly pass by the theory of the Stock-to-Flow ratio (the ratio of stocks to growth) presented by PlanB@100trillionUSD.
If you have not yet encountered it, then I highly recommend that you familiarize yourself with these translations of the original articles of the author of the theory:
- Modeling the price of bitcoin based on its scarcity,
- Efficient Market Hypothesis and Bitcoin Stock-to-Flow Model,
- New S2FX Model for Bitcoin Valuation.
This theory explains in simple mathematicalformulas for the intrinsic value of bitcoin. Bitcoin is viewed here as a scarce commodity that is in high demand, like gold, following the laws of the market, but practically not used for other purposes besides investment.
This theory answers the question I askedmyself for quite some time. In one of the articles on the rise in the price of bitcoin over the years, I came across this graph. Its peculiarity is that it starts not from 2014, as in most cases, but from the very first block, mined in 2009, and covers the entire period to the present. The price scale is logarithmic.
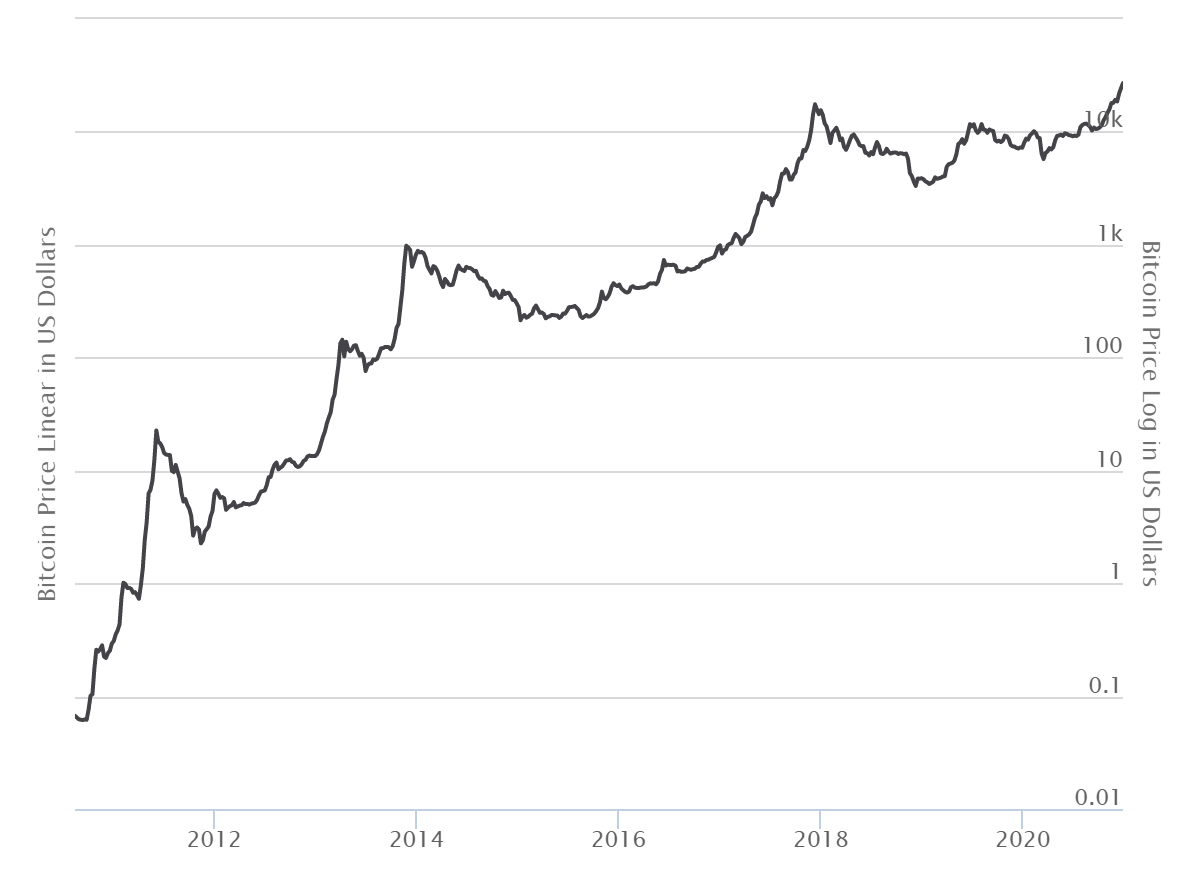
Chart: www.buybitcoinworldwide.com
So, here is a graph in front of you.It immediately shows that the price grows over time along a curve that looks like a logarithmic one (in fact, it is not logarithmic, in this format it will end up being almost linear).
When the shape is so correct, it is almost alwaysit is a mathematical formula with which you can extrapolate the shape and get future values. You just need to find this formula and substantiate it. It was this opportunity that opened the emergence of the theory of the Stock-to-Flow ratio (S2F).
If you look at the calculations in the S2F theory, thenthe values obtained magically coincide with the actual price of BTC throughout the time it is traded on exchanges. These calculations have also been repeatedly corrected and supplemented in order to improve their accuracy.
However, it should be borne in mind that theselogarithmic graphs are much more accurate than they actually are. Even the smallest deviations can lead to significant price differences. For those who have not yet dealt with logarithmic graphs, it is better to be careful with them.
There are also cyclical phases in the history of the bitcoin rate, in which its real value did not coincide with the calculated values. Moreover, a 10-fold difference is not uncommon here.
On the whole, however, no other theory, perhaps, could have given more reliable predictions for values changing by so many orders of magnitude.
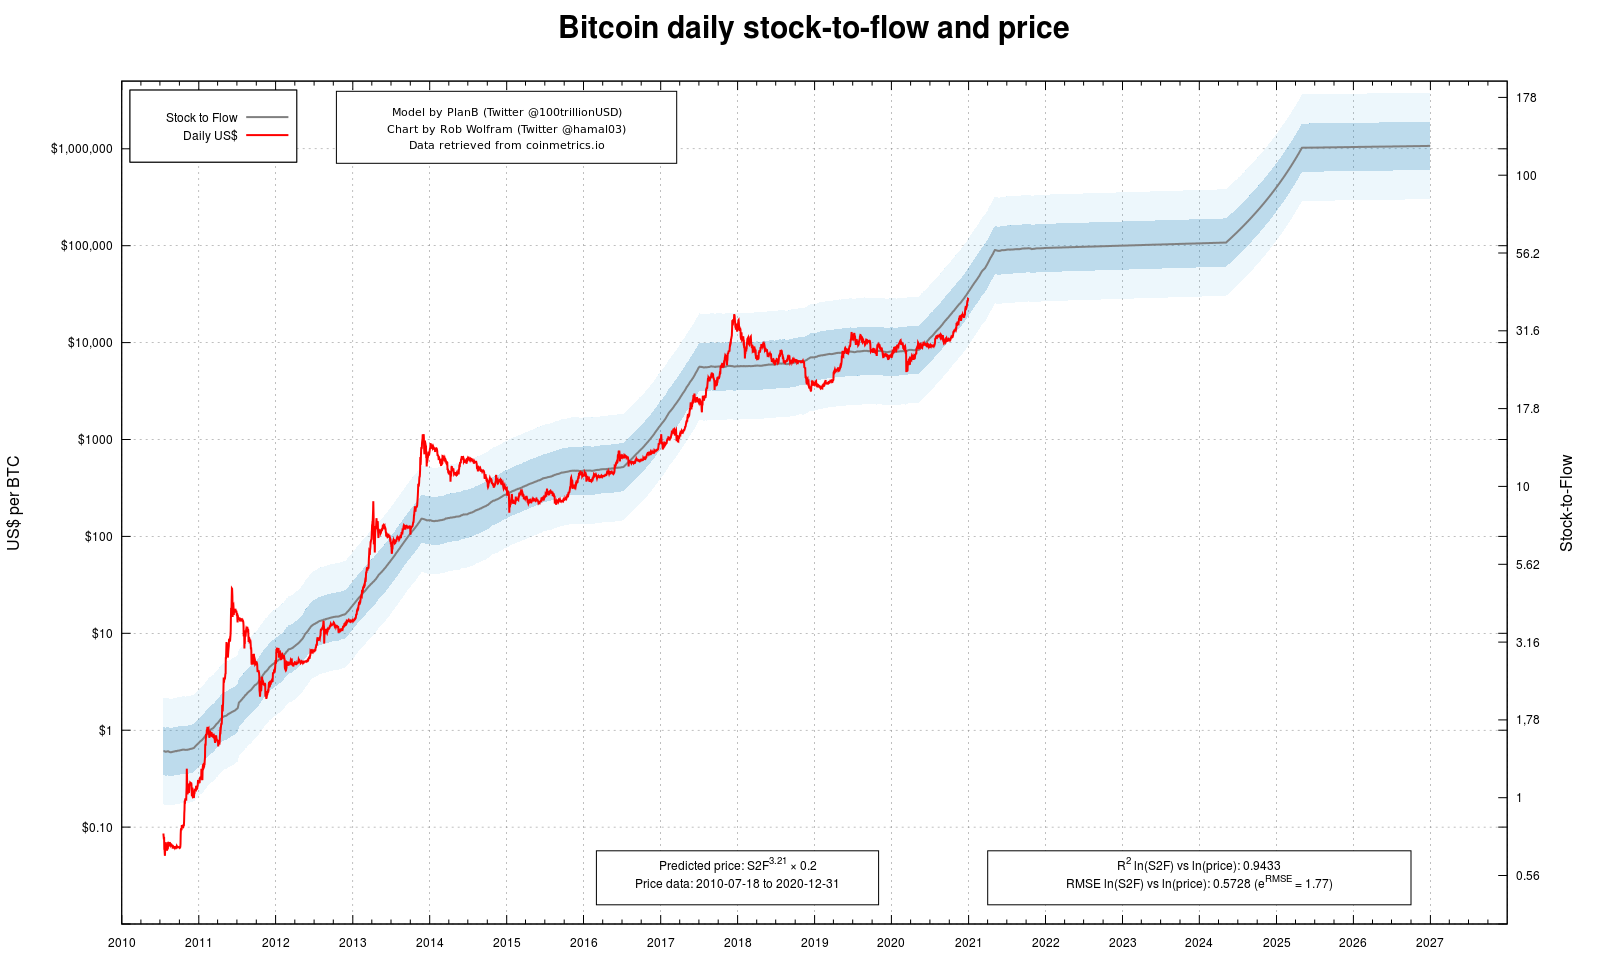
S2F Chart by Rob Wolfram (Twitter @ hamal03)
The latest version of PlanB's Bitcoin price equation is:
$ / BTC = e ^ (3.21 * ln (SF) - 1.6)
Unlike PlanB, I consider this formulasolely as a long-term forecast. He changed the calculation of the SF value to get a more accurate result. It now uses a longer time frame to calculate SF, rather than just daily values. On the graph, this gives some smoothing - like inclined "ramps" instead of sharp steps, as in the earlier version. As a result, the overall forecast accuracy is improved, but it loses the argument of how the BTC price immediately followed the new SF value in early 2013. Although, in my opinion, this argument remains valid even with this calculation.
For my part, I propose a different approach to short-term forecasting of the price of bitcoin in the growth phase after halving.
The goal is to develop an understanding of bitcoin rate changes and test new approaches to explaining and predicting price fluctuations.
The more people know about the Bitcoin system, the more confidently they interact with it.
Growth phase
Interestingly, the intrinsic value of bitcoin is notchanges continuously and gradually, but it seems to happen in leaps and bounds. However, these jumps can be very easily explained by halvings, which simultaneously reduce the number of newly generated bitcoins and greatly affect the resulting value in the calculation of S2F.
The question arises why the change in internalthe value of bitcoin and the rise in its price does not occur immediately after a halving. In the next few months after each halving, the BTC exchange rate seems to remain almost unchanged. You need to look more closely to see and understand the changes taking place during these periods.
The PlanB charts also show self-similarity - a fractal structure that, albeit at different scales, is recognizably reproduced every four years.
This circumstance became the starting point formy calculations. Indeed, it should be possible to compare price trends from 2013 to the end of 2017 and fluctuations in the current cycle, from early 2017 to the end of 2021.
If you look at the price trend and take inas a reference point for the lower value, then each cycle can be divided into a growth phase and a recession phase. Since now, according to this classification, we are in the growth phase, I have focused on it for now. I will definitely analyze the recession phase later.
So, taking all the historical values of the pricebitcoin since 2014, I investigated the phase in which the price was rising. Then I looked at the beginning of a new growth phase from 2018 and compared these values with those of 4 years ago. With a factor of 17.5 for old values and a shift of exactly 1399 days, both price trends overlap well. 1399 days exactly correspond to the time interval between the two halvings that took place in the corresponding period.
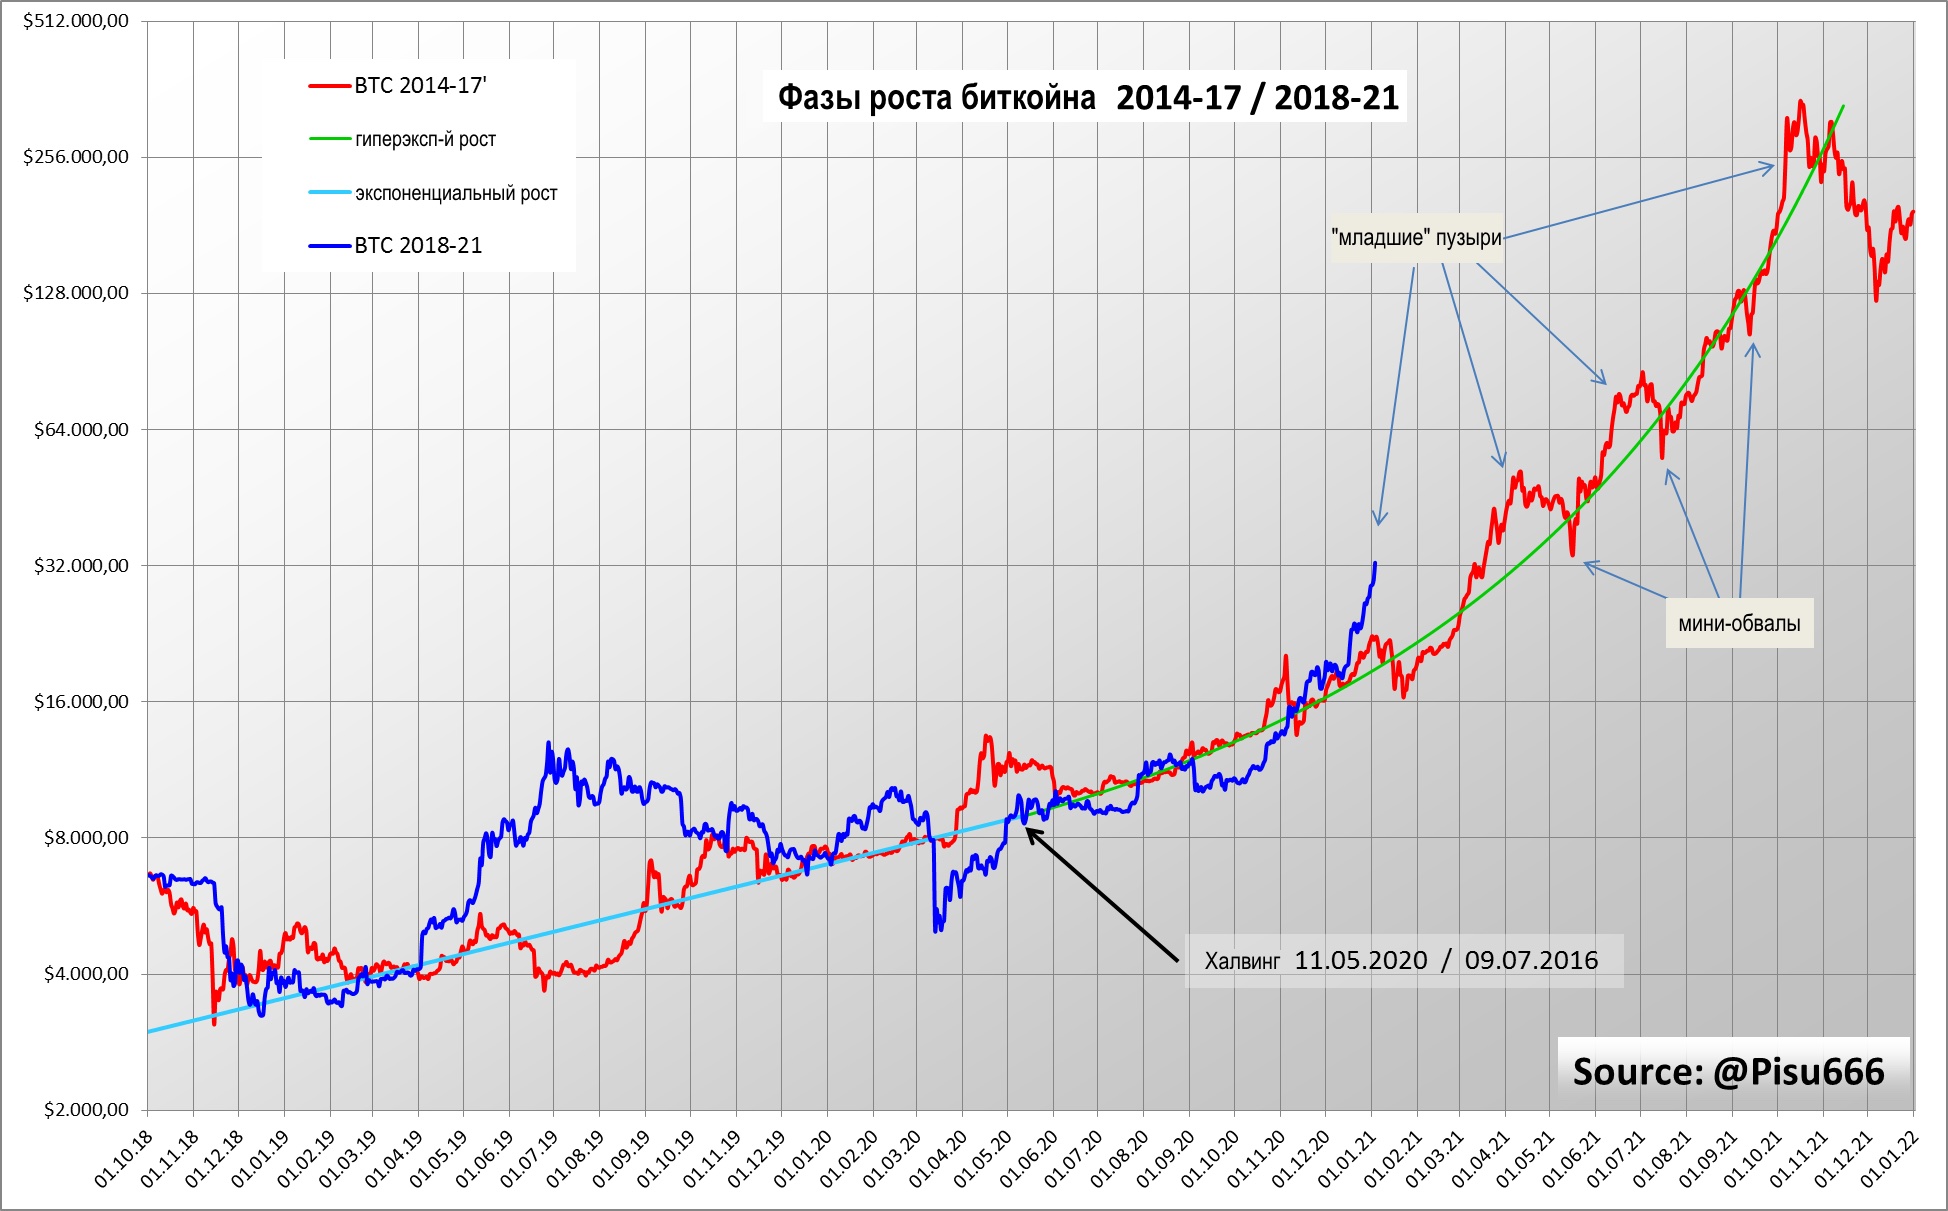
Comparison of Bitcoin growth phases in the 2014-2017 and 2018-2021 cycles.
The result amazed me myself.The similarities between the two cycles are quite obvious. Although the price of BTC in 2019 remained highly inflated for almost the entire year. And, as if it were natural, both trends merge again, as if deliberately moving towards a common target result.
Although it should be noted here that comparing these two trends, I do not pursue the goal of equating them to each other. I am only interested in finding similarities and patterns.
Bitcoin formula
In the above graph, two different phases can be recognized. The first with a more even price rate before halving and the second after it, in which the price rises rapidly.
After several trials and attempts, the situationcleared up. The phase before halving corresponds to constant exponential growth. On a logarithmic plot, this gives a straight line. Bitcoin's value roughly doubles every year. You can see how the graphs of both cycles (red and blue) follow a parallel course with this straight line, even though they often move quite far from it.
It was much more difficult to drive the phase after the halving into the mathematical formula. Exponential growth is not enough here. Only doubled exponential growth was able to produce the desired result.
To better understand this growth, one can imagineits like an interest rate. One exponential growth corresponds to a constant interest rate, while double exponential growth corresponds to an exponentially growing interest rate.
The general equation is as follows:
$ / BTC = $ / BTC (at the time of halving) * e ^ (ln (a) t * (ln (b) t + 1))
Where:
but— this is the growth rate at halving (1.059 per month in 2020);
b— growth coefficient for growth;
t— time (t=1 — time interval for the growth coefficients used).
Parameterbutis a constant growth factor before halving, and the parameterbassociated with changes in the level of shortages and market conditions. So this value seems to be related to the new S2F value, trading volumes and the level of euphoria in the market.
Thus, the post-halving growth formula is easily explained through the original growth that existed before the halving.
Changing the market by increasing the Bitcoin deficit,you create a second exponential growth function applied to an existing one. Without the initial growth, the result would be simple exponential growth, but now we have double exponential growth.
Through trial and error, I adjusted the parametersin such a way as to get such a green curve on the graph. It's impressive how closely the actual bitcoin price in 2017 matched this formula.
Bubble
Initially I used as targetvalues for its price formula maximum on December 17, 2017 (about $20,000 at that time). However, it didn't work. The slope of the values just before the highest maximum was too large and the values did not fit into any formula. I later realized that the “true” peak was not made by Bitcoin until a month later, and the higher value before that was simply a temporary “inflection point.”
In such short-term exitsexpected calculated values are not unusual. For University of Zurich professor Didier Sornett, growth that is stronger than exponential is usually a clear sign of a financial bubble.
This growth is also called hyperexponential. In this phase, many small “daughter” bubbles and mini-landslides can be observed.
These fluctuations between mini-bubbles and drops are happening faster and faster. As a result, this leads to the rupture of the main bubble and, as a consequence, to a significant price drop.
This phase is also characterized by growing euphoria among investors. It is interesting that it begins immediately after the halving and most of the time the achieved values do not exceed the expected ones.
But if the price of bitcoin is significantly higher than the calculated values of S2F, this is, of course, a bubble that must burst sooner or later. And after a while, the cost returns to normal values.
Fortunately, for bitcoin, this time is minimal due to the 4-year cycle length. However, as PlanB already mentioned, the price may drop by 80% at the moment.
I wasn't sure if this formula would be with everyoneparameters is valid for current bitcoin prices or there is some difference. So I tried to create a second set of parameters to match the current bitcoin curve. This continuation is indicated by a dotted line in the chart below. There is still too little data to support this progression. But over time, of course, I will correct the calculation and update the schedule.
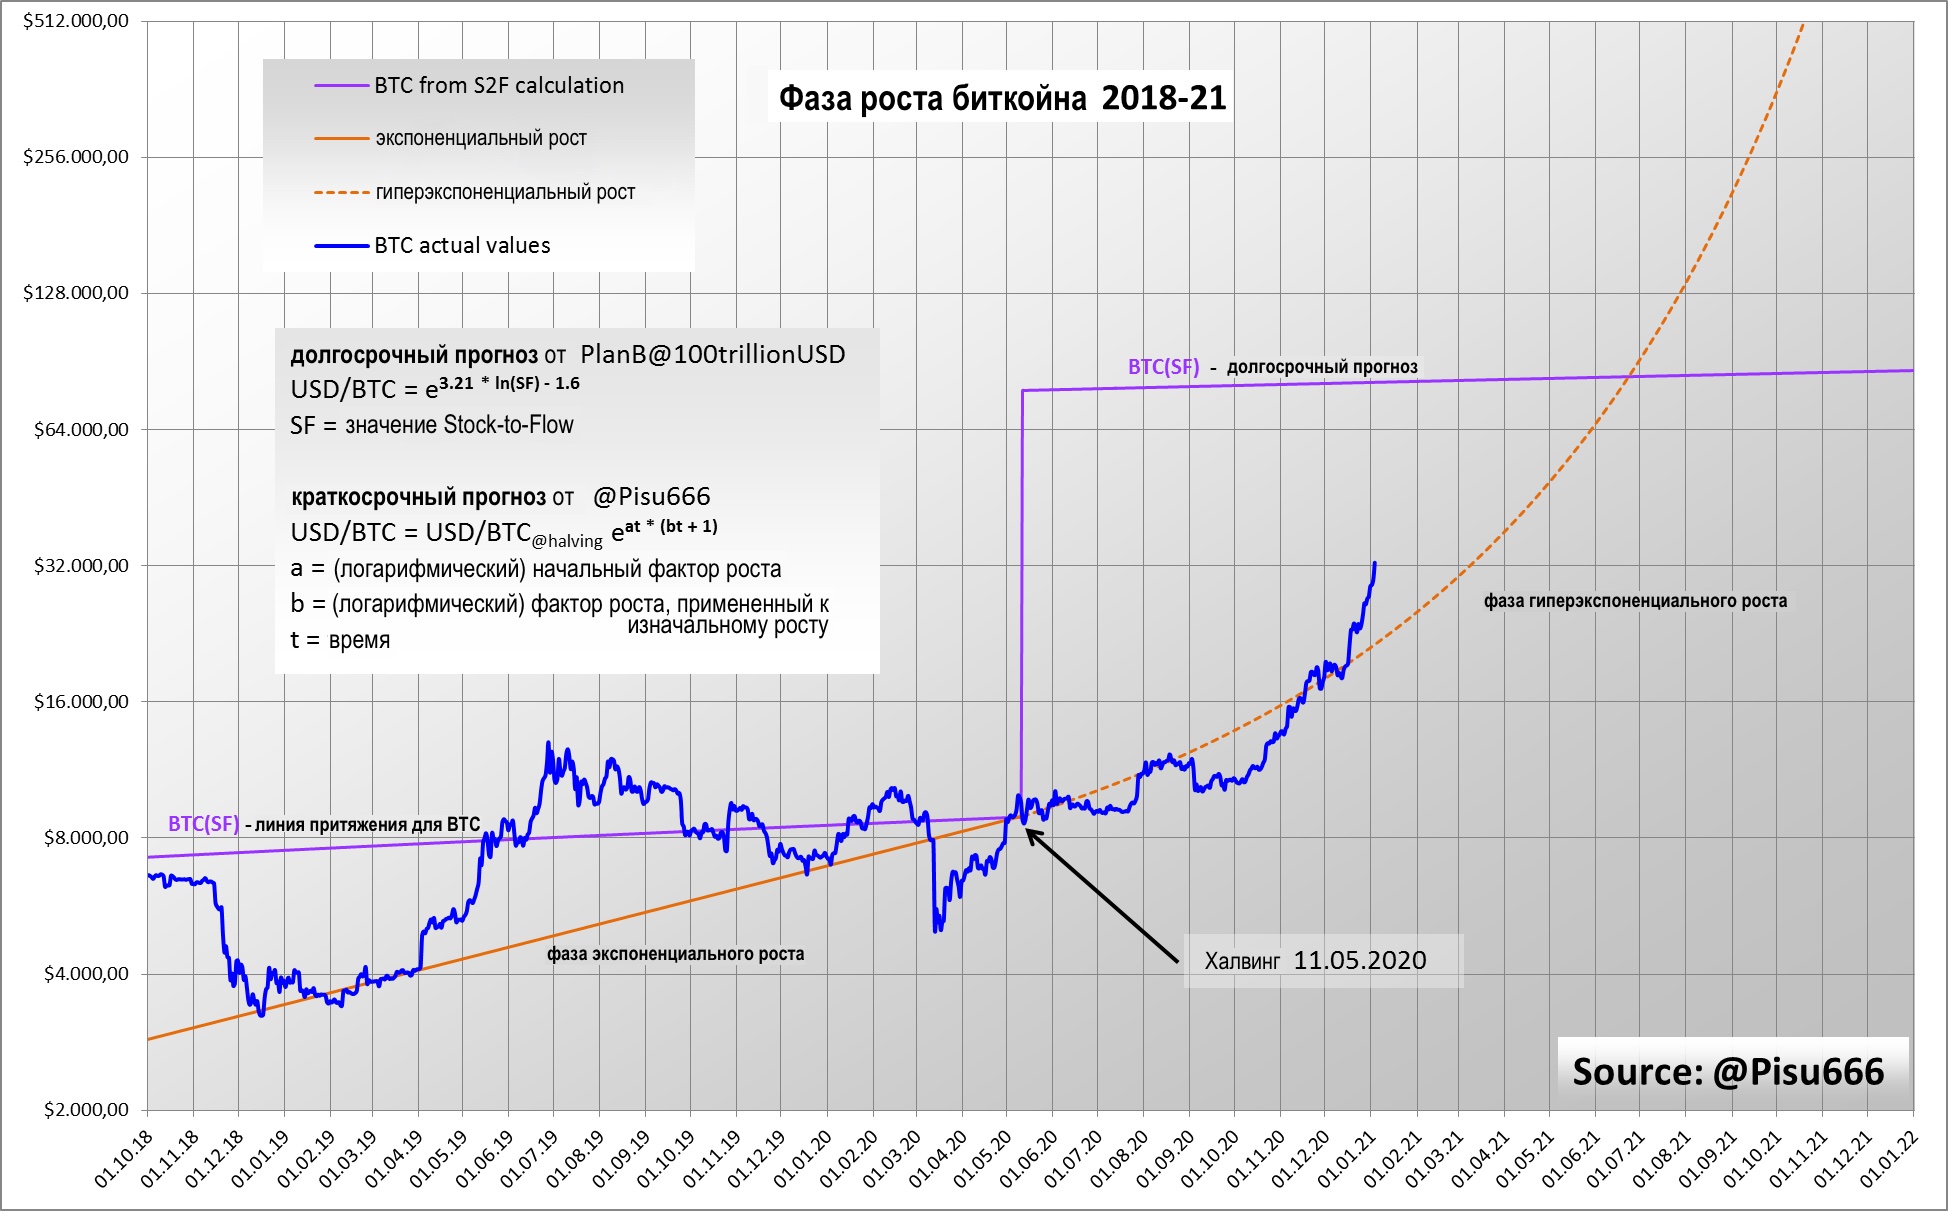
Bitcoin price prediction for the current growth phase
The graph also shows that PlanB's forecast inwithin the framework of his new S2FX model, apparently, is not so wrong. According to this model, the price target for Bitcoin is $288,000/BTC. At least my calculations show that this value can be achieved without any special effort.
Conclusion
Of course, these calculations can cause manyquestions. However, the biggest question for me, and for many other Bitcoin enthusiasts, is when exactly the maximum price will be reached.
According to S2F theory, intrinsic valueBitcoin will be between $85,000 and $100,000 by the end of 2021. But how high can its actual price go before another market panic triggers a massive drop? Every investor should be aware that when the price of BTC is above certain values, the likelihood of a crash increases day by day.
There are also indicators native to cryptocurrencies that can be useful in identifying such price peaks: MVRV and MVRV-z, HODL waves, NVT / NVT-signal, etc.
If you miss this big crash, only patiently waiting for the next growth phase will help restore your money. It could probably start in 2023.
The article does not contain investment recommendations,all the opinions expressed express exclusively the personal opinions of the author and the respondents. Any activity related to investing and trading in the markets carries risks. Make your own decisions responsibly and independently.
</p>
Read this:
 Tom Lee: Bitcoin needs a consolidation period
 Google Trends Records Falling Interest in Bitcoin and DeFi
Alistair Milne, Altana Digital: “I Won't Let Bitcoin Fall to 0”
Michael Novogratz: “Bitcoin needs to return above $ 7,500”
Michael Novogratz Confirmed His Forecast for Bitcoin at $ 20,000
Mark Yusko: “The crisis of fiat currencies plays into the hands of Bitcoin”
Google Trends Records Falling Interest in Bitcoin and DeFi
Alistair Milne, Altana Digital: “I Won't Let Bitcoin Fall to 0”
Michael Novogratz: “Bitcoin needs to return above $ 7,500”
Michael Novogratz Confirmed His Forecast for Bitcoin at $ 20,000
Mark Yusko: “The crisis of fiat currencies plays into the hands of Bitcoin”