06/12/2020
Guest Materials


Disclaimer
Predictionsfinancial markets are private opinion theirauthors. Current analysis is not a guide to trade. ForkLog is not responsible for the results of work that may arise when using trading recommendations from the submitted reviews.
Trader Ilya Meshcheryakov talks about the current situation on the market.
After a long lull in the market againvolatility is observed. On the night of June 10-11, Bitcoin made another unsuccessful attempt to rise above $ 10,000, and then fell by almost a thousand dollars. Market uncertainty
is saved.
Consider the BTC picture from the point of view of the interests of big capital, as well as global and local accumulation zones.
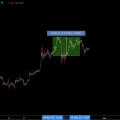
Let's start with the local one - since May 28, Bitcoin is inrange of $ 9350-9900, periodically making false exits up or down. Yesterday's attempt to gain a foothold below $ 9,350 was unsuccessful. This may indicate that trading in the local area of BTC accumulation can be traded for a long time.
The proximity of this zone to the upper border of the more global zone (more on it later) may indicate that BTC is gathering strength to break through $ 10,000.

Local accumulation zone on the fifteen minute BTC / USDT chart of Binance exchange by TradingView
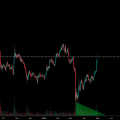
Let's move on to a broader consolidation, the exit from which will indicate the direction of the further BTC trend for several months ahead. It is presented below.
For convenience, I left the previously considered zoneon the graph (it is darker). We see that this zone has been forming since April 29, and its width is about $ 1500. The lower limit is around $ 8,500, and the upper one is around $ 10,000.
With the help of this data and history, we can roughly estimate how much fuel will be enough to drive after exiting the accumulation zone.

Binance Hourly BTC / USDT Chart by TradingView
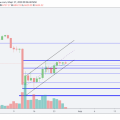
The most similar area in terms of characteristicsaccumulation was formed from November 20, 2019 to January 6, 2020 and had a width of $ 1200 (borders $ 6500- $ 7700). After leaving it, the movement was $ 2800 (from $ 7700 to $ 10,500).
Based on this, we can assume two potential BTC marks after exiting the current zone - $ 12,800 in case of a breakdown upward and $ 5700 in a breakdown downward.

A visual comparison of two accumulation zones in different historical periods on the Binance 4-hour BTC / USDT chart by TradingView
As for the work within the price channel, thenthere shouldn't be much difficulty here. Besides the channel boundaries, we have a strong intermediate zone around $ 9000. It is there that partial profit fixing and work on a retest during a breakout can occur.
Read this:
 Trader spoke about the alarm for the price of bitcoin in the futures market
 The trader spoke about the factors in favor of a further drop in the price of bitcoin
 Trader spoke about the positive technical picture for the rise in the price of bitcoin
 Trader named the reason for the growth of bitcoin and told what to expect
 A trader said what he is doing in a bitcoin collapse
 Trader told what to expect from the price of bitcoin