Assessment of the situation on the BTC and ETH markets and a forecast for them from Willie Wu.
Ten days ago I expected price movementsin the range of $39-47 thousand.But instead, BTC rose to $55 thousand due to strong speculative purchases on exchanges. This occurred against the backdrop of relatively moderate investor activity observed in on-chain metrics. However, the net effect is that the modest price discount relative to the fundamental supply/demand relationship observed on-chain is now closed.
Brief summary as of the beginning of October 9, 2021:
- Macro perspective:Long-term savings are at peak levels. Structurally, this points to a strong rally in the coming months and a bull market in 2022. The coming weeks are a good time to save.
- Medium term:signs of moderate accumulation by whales.The level of purchases from strong holders returned to neutral. Structurally, this points to a multi-month phase of bullish re-accumulation, but the situation could change quickly.
- Short term:The latest price rally has brought the price toconsistency with the supply and demand relationship observed from on-chain indicators. There is some profit taking on the part of short-term investors, while the level of purchases from “strong hands” remains neutral. The overall picture is neutral and on-chain data does not provide many signals.
- Speculation:volume of speculation on derivatives exchanges quicklygrowing. This comes ahead of the likely imminent approval of the first Bitcoin ETF by the SEC, expected within the next three weeks. Speculation around this event will easily outweigh the impact of short-term on-chain supply and demand (which is also fairly neutral at the moment).
- Expectations regarding price movement:sideways/bearish consolidation in a range$48-58k over the next ~2 weeks. This is my conclusion based on on-chain and technical analysis. If the ETF is approved, the forecast becomes invalid and the price becomes clearly bullish.
- Confidence in price movement:low. This is a time of increased speculation around ETF approval while on-chain indicators remain neutral.
Macro Perspective: Peak Accumulation by Long-Term Holders
Long term holders are at their peakaccumulation. Based on past market performance, we have perhaps two months or more before the effect of the resulting supply shock takes effect and sends prices into a multi-month rally. Thus, the market is structurally poised for a continuation of the bull cycle in Q1 2022 and beyond.
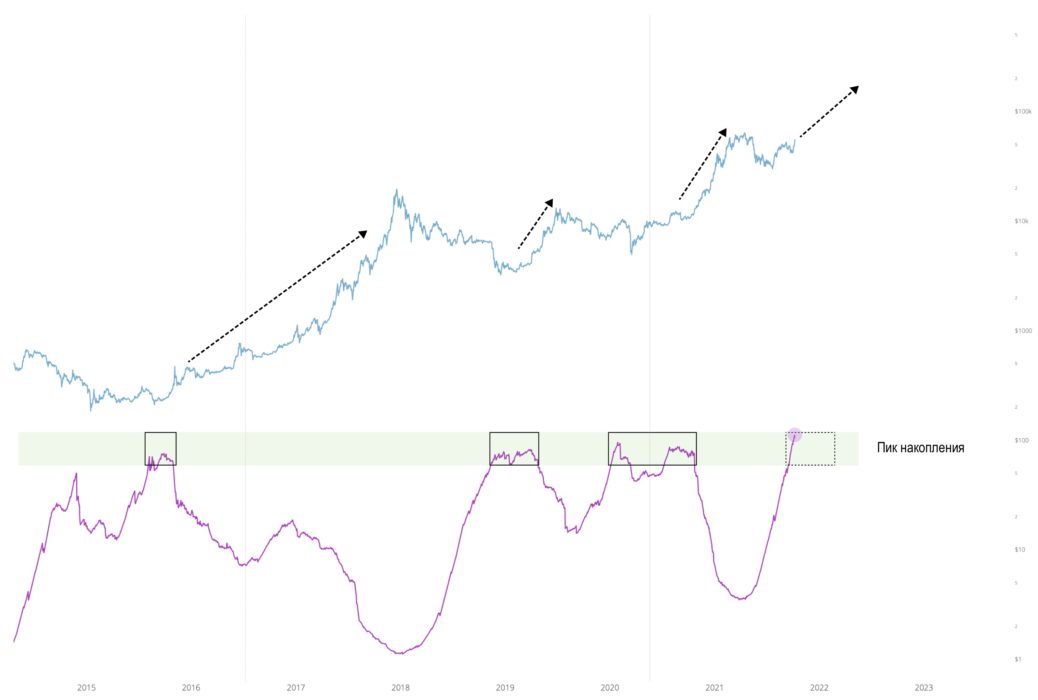
Supply Shock Ratio for Long Termholders monitors the ratio of coins that have not moved on-chain for more than 5 months to the rest of the supply of more active coins. Five months is the estimated threshold period after which the probability of movement (sale) of coins begins to decrease. (Chart: charts.woobull.com)
Summary: Macro outlook is bullish with growth prospects in Q1 2022.
Medium term
Strong hands are neutral
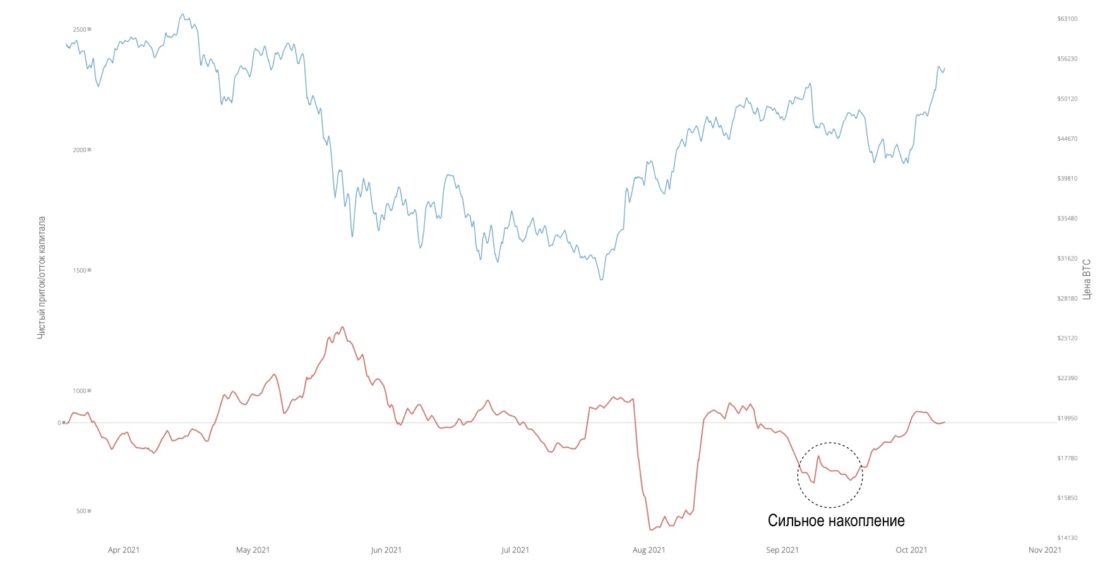
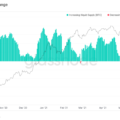
The chart below reflects the 90-daycapital inflows / outflows at addresses with a strong tendency to accumulate and hold coins. I like this visualization as an indicator of medium-term demand from investors. This indicator is currently in the neutral zone - neither bullish nor bearish.
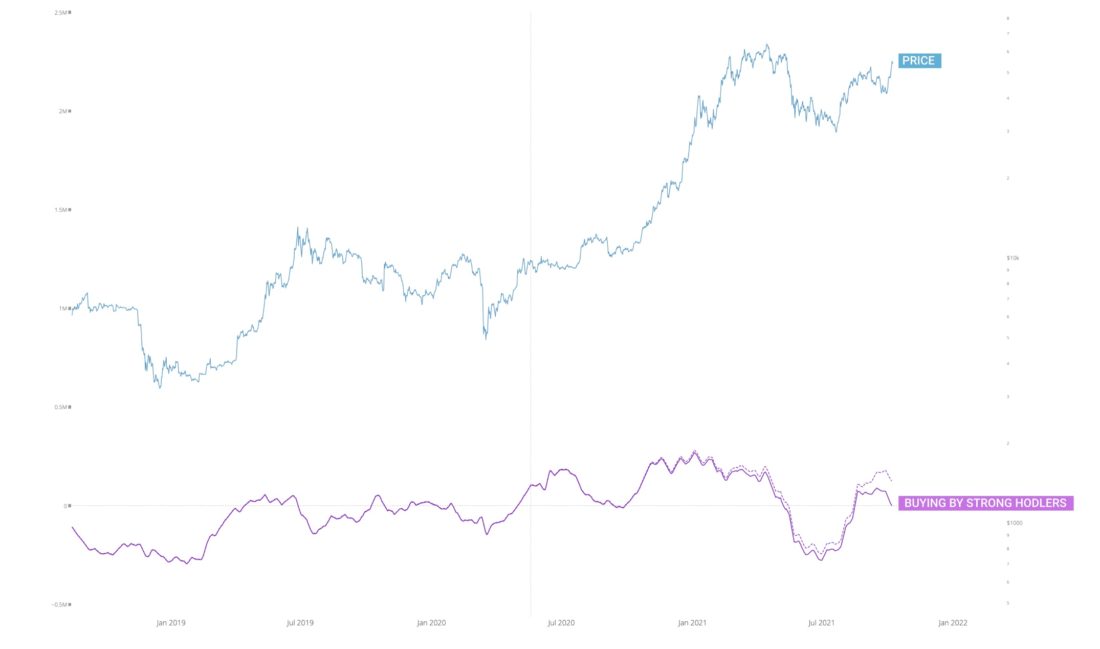
Bitcoin: moving into strong hands.90-day capital inflow / outflow at the addresses of investors with a purchase history, but a limited sales history. The metric is based on the analysis of the on-chain activity of network subjects, and its values may change, including retrospectively, based on more recent data. The solid line takes into account the drift correction, the dashed line reflects the original values. (Chart: charts.woobull.com)
Summary: Medium-term forecast of neutral / lateral movement.
Moderate accumulation by whales
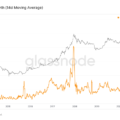
For more mid-termperspectives we use the buying habits of bitcoin "whales". They tend to sell coins gradually over time in a growing market, but there are areas where they take advantage of buying opportunities, and these periods tend to signal growth prospects in the coming months.
The chart below shows an oscillator that helpsvisualize the buying power of the whales against the background of their usual gradual selling. At present, the behavior of whales ranges from neutral to moderate accumulation.
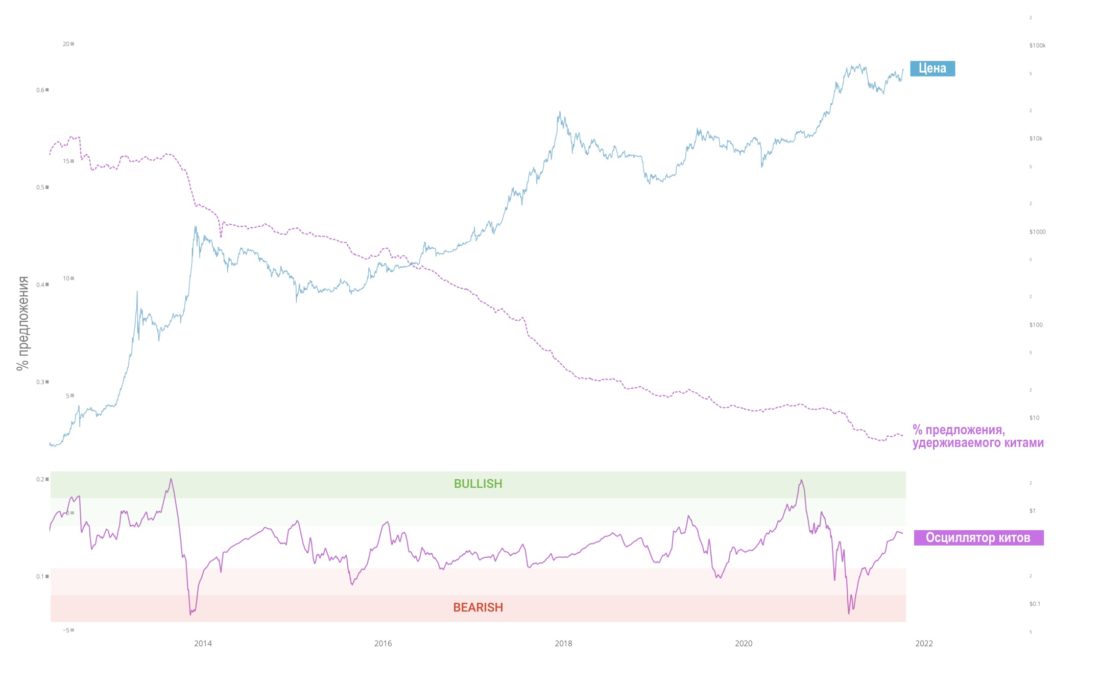
Oscillator of accumulation from the side of whales. (Chart: charts.woobull.com)
Summary: Medium-term forecast of neutral / lateral movement.
Short-term outlook: neutral investor activity
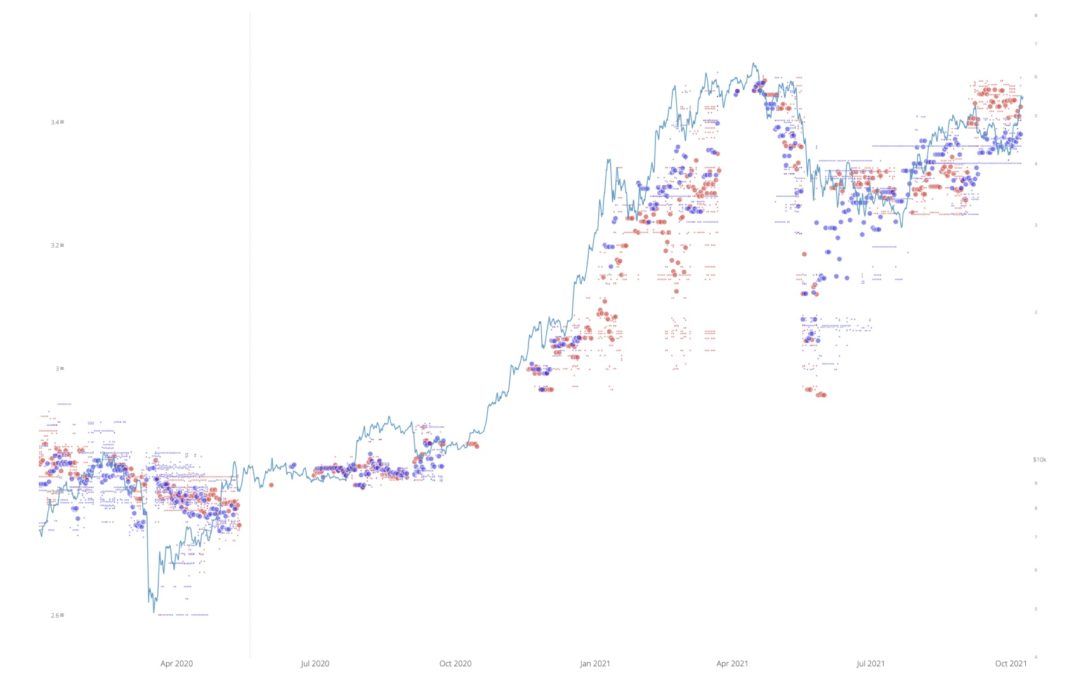
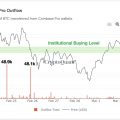
The price chart below is aligned with the heatmap,reflecting the daily purchases and sales of BTC by investors. It can be seen that activity was mostly neutral, but this latest rally removes the imbalance that emerged in September, when investors were actively buying but the price has declined.
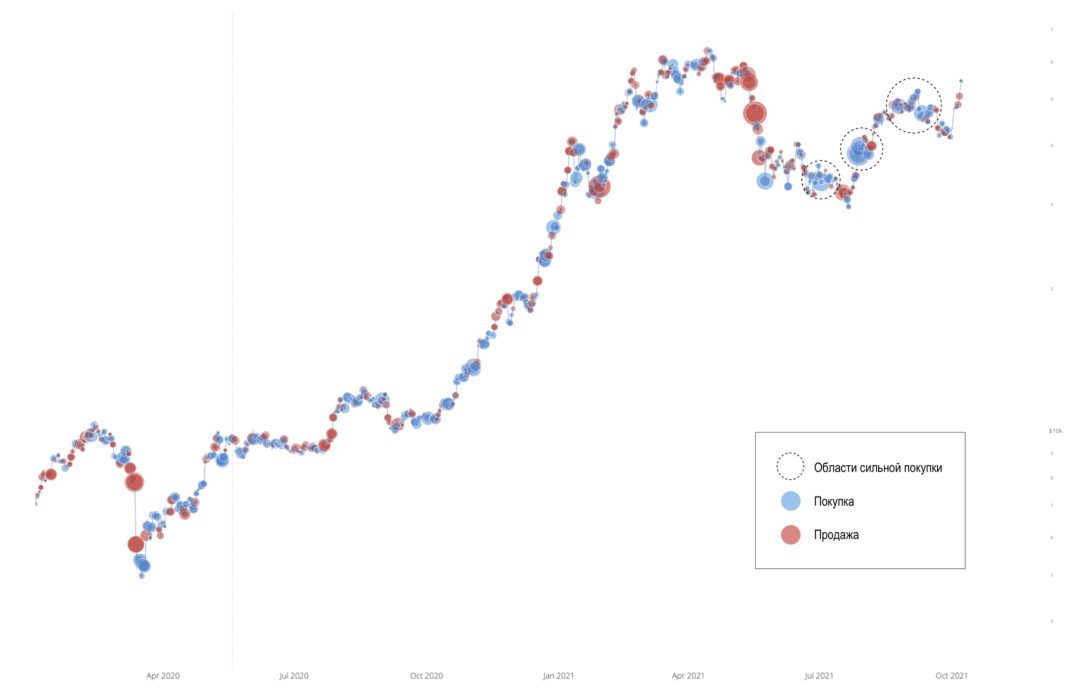
Heatmap of net sales / purchases by long-term investors. (Chart: charts.woobull.com)
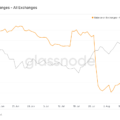
The graph below shows the same data in a slightly different way. Most of the purchases took place in September. But it took the market until October to react with a price rally.
Net capital inflows / outflows on spot exchanges. (Chart: charts.woobull.com)
The Supply Shock Ratio chart below showsthat speculative investors fix some profits, while investors in the process of long-term accumulation remain neutral.
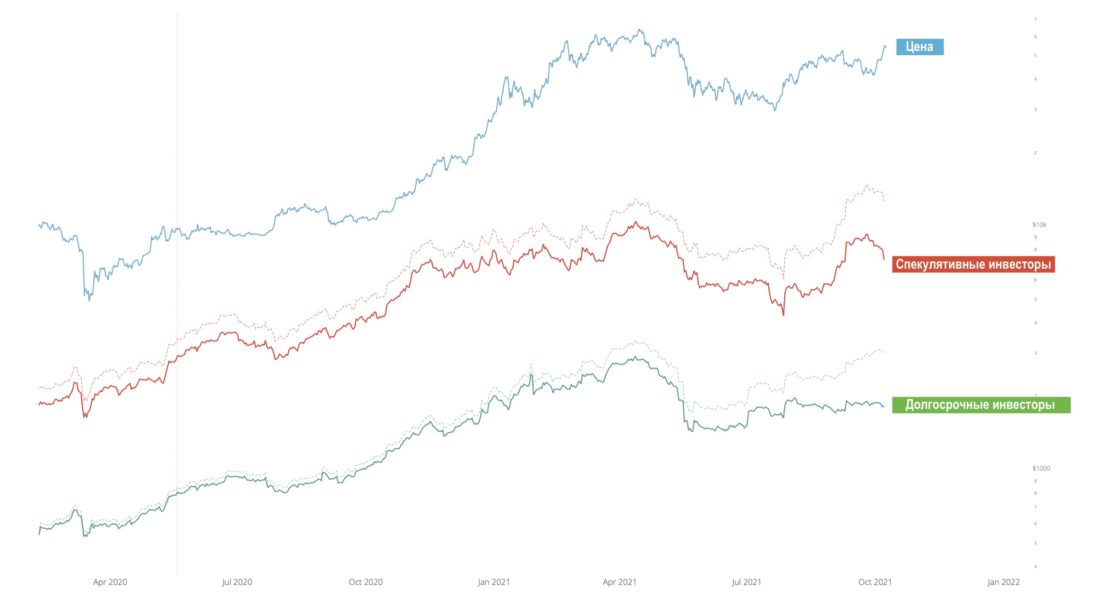
Supply Shock Ratio. (Chart: charts.woobull.com)
Using our Supply Shock model todetermining a fair price based on the short-term supply and demand exhibited by the on-chain, it can be seen that bitcoin is trading in approximately the "correct" zone.
Model for estimating the fair price of BTC based on the Supply Shock ratio. (Chart: charts.woobull.com)
Bitcoin ETF may be just around the corner
Although this does not apply to the area of quantitativeof measurable on-chain indicators, I think it would be right to mention a number of Bitcoin ETF applications pending with the SEC and which may be approved in the next 3 weeks. If any of them are approved, the market can be expected to react with an immediate speculative rally.
Possible approval dates are as follows (we wrote more about this here):
- October 18 - ProShares Bitcoin Strategy ETF;
- October 19 - Invesco Bitcoin Strategy ETF;
- October 25 - VanEck Bitcoin Strategy ETF;
- October 25 - Calkyrie Bitcoin Strategy ETF;
- November 1 - Galaxy Bitcoin Strategy ETF.
Comment on ETH
Basic investor demand for ETH continuessideways consolidation at record highs with no signs of new demand inflow. The price is also consolidating in a sideways trend, and therefore on-chain indicators provide few signals.
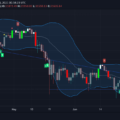
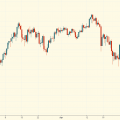
In situations like this, the importance oftechnical analysis. From a TA perspective, the price of ETH continues to consolidate for several weeks with support at $ 3200 and very strong support at $ 2800. I suspect that the market may need to retest one of these zones before rallying higher, given that the rally has just taken place, as well as the exhaustion of the trend in the TD9 indicator on the daily timeframe.
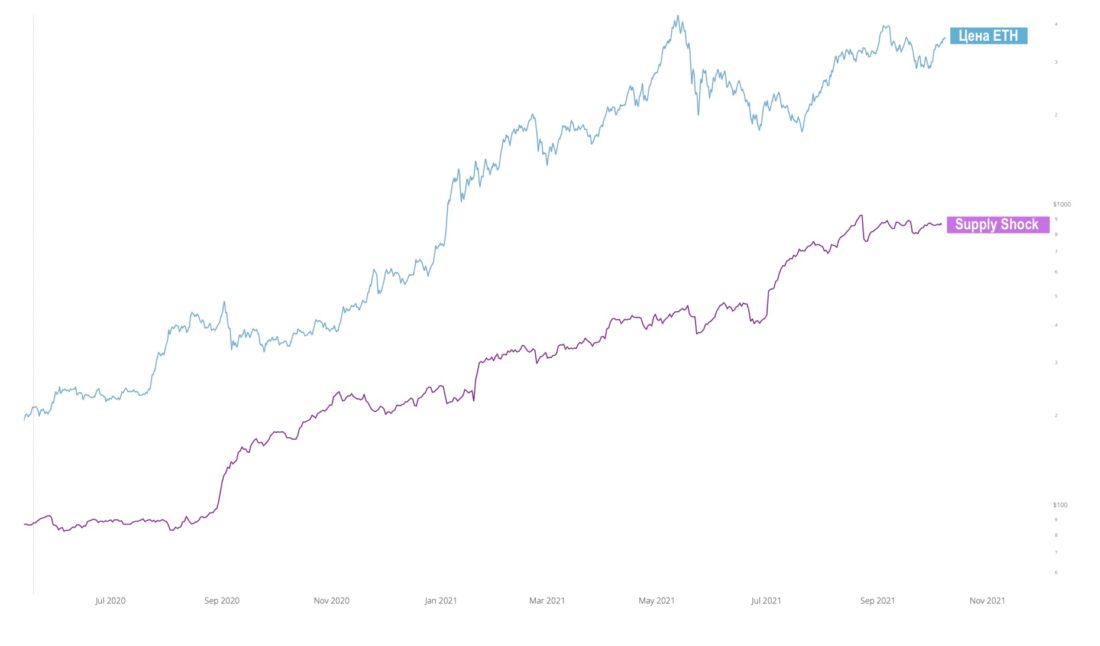
Supply Shock Ratio for Ethereum. (Chart: charts.woobull.com)
BitNews disclaims responsibility forany investment recommendations that may be contained in this article. All opinions expressed express exclusively the personal opinions of the author and respondents. Any actions related to investment and trading in crypto markets involve the risk of losing invested funds. Based on the data provided, you make investment decisions carefully, responsibly and at your own risk.
Read this:
 Strong Hands Accumulate BTC Aggressively - Onchain Pulse from June 26, 2021
 Onchain Pulse: Fast Update 25 Aug 2021
 The Calm Before the Storm - Onchain Pulse from July 17, 2021
 Light Surge from New Whales - Onchain Pulse from July 10, 2021
 Whales accumulate BTC at around $48 thousand, on-chain data shows
 Onchain Pulse | May 11, 2021