Today we will take a closer look at the BTCUSDT price movement in the TSLab terminal.
Developing the topic I would likeidentify a number of elements that we pay attention to when analyzing the situation on paper.
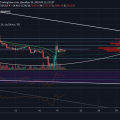
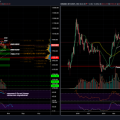
In our example, the histograms showdistribution of trading volume, but you can also look at the number of transactions by level, delta, or separately purchases and sales. In subsequent posts, the histogram modes may be switched, which we will definitely report about.

A small note: any analysis, any forecasts easily cross out the news, so we do not forget to follow the news as well.
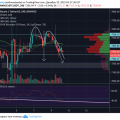
For example, price fluctuations on the screen above in the channelfrom 11300 to 11500 would be quite natural. Not with sudden movements, but with a sluggish sideways movement of the market within these limits. This is explained by the fact that a large volume was traded at this level, which means there will be an attempt to maintain the price. The level of 11350-11400 is well flooded, so it’s difficult to step over it right away. Level 11450 with smaller volumes, and the price simply shot towards it, where it was stopped. This does not mean that we will not grow or fall - no. At the moment, we can only understand for sure that the price is still fluctuating here.
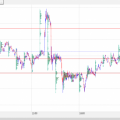
News came out today, OKEx Cryptocurrency Exchangesuspended the withdrawal of funds, and, accordingly, the price of news flies sharply. And the picture is as follows. The price has dropped sharply, but in zone 1 indicated on the screen (these are clusters with a timeframe of 1 hour), it is stopped and traded. That is, the cue ball was not allowed to immediately fall below. We returned to the level of 11350 and stopped the price again at point 2.
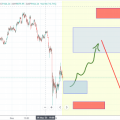
Naturally, depending on the applicantsnews, it can be assumed that at the current moment the price will fluctuate within the range from 11350 to 11200, followed by a movement to the level of 11050 (this is also the level of price penetration, but it is weaker than the others, since the price did not stay there long). This is not a forecast and not looking into the future, as the situation develops, the goals will be adjusted.
Real deals are not opened yet, as soon as there are deals, we will also designate them separately.
All analysis is based only on distributionvolumes, in the TSLab program. This is the initial level for now; then we will continue to reveal additional features that allow us to analyze price movements.
What do you use in your work when analyzing prices?
Also, write your wishes, we will try to take them into account.
For live communication we have a telegram channel.
Read this:
 TradingView Blog | While we fall
 TSLab company blog | TSLab Company Blog Presentation
 TradingView Blog | Bitcoin
 WELTRADE company blog | Peter Schiff – Bitcoin's sharp rise at the end of last week was caused by coordinated actions
 TradingView Blog | There should not be movement at the weekend
 TradingView Blog | Bitcoin Watch