06/10/2020
Guest Materials


Disclaimer
Attention!Financial market forecasts are privateopinion of their authors. Current analysis is not a guide to trade. RoboForex is not responsible for the results of work that may arise when using trading recommendations from the submitted reviews.
RoboForex lead analyst Dmitry Gurkovsky talks about further possible scenarios of the price movement of bitcoin and several popular altcoins.
</p>The volatility in the cryptocurrency market continues to be low. One should not exclude the development of a strong impulse movement in many major assets, which will replace the flat.
It is still very important for bitcointhe level of $ 10,565, a breakdown of which will indicate a movement to the level of $ 13,000 and above. However, if the bears manage to break through the nearest support levels, in this case the target of the downward impulse development will be the $ 6500 level.
At the same time, about the possible upcoming growthEthereum and TRON charts say. In particular, the ETH / USD quotes can easily test the level of $ 270 and above, subject to the breakdown of the upper border of the descending channel.
Bitcoin
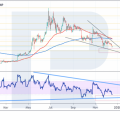
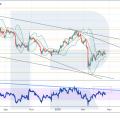
BTC / USD quotes continue to remain below the resistance level. The risk of a fall still exists.
It is important for a buyer to break through the level of $ 10,565 in order to speak of a resumption of the bullish trend. Such a scenario will also indicate a breakdown of the upper border of the descending channel.
If the price falls below $ 8545, then it is worthconsider this structure as a “Double Top” reversal pattern with the goal of working out at the level of $ 6320. This option is supported by the price rebound from the upper border of the descending channel, as well as the fact that the values of the RSI indicator could not gain a foothold above the resistance line. These factors indicate strong bearish pressure.

TradingView BTC / USD daily chart
On the four-hour chart, cryptocurrency quotessandwiched between support and resistance levels. Previously, there was a potential for the formation of a “Head and Shoulders” reversal pattern, which could poison the price downward, but at the moment the “right shoulder” of the model is noticeably higher, which can lead to the cancellation of the pattern and the continuation of the price growth.
As a short-term trading idea, one should not exclude a test of the $ 10,000 level and the beginning of a fall to the $ 9270 level. A breakdown of the latter will open the way to $ 8555.
If the bulls manage to push the price above the $ 10,055 level, in this case, it is worth considering the continuation of the rise to the $ 10,565 mark and the resumption of the upward trend on the daily chart of the asset.

Four-hour BTC / USD chart from TradingView
Ethereum
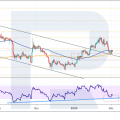
On the daily chart, the Ethereum price continuestest the upper border of the descending channel. Overall, the chart looks strong for continued growth. However, as confirmation, it is important to see a breakdown of the $ 255 level, which will indicate an exit outside the channel and the full development of a bullish trend.
If the bears manage to push the levelsupport and the price to gain a foothold below $ 221, it is worth considering the continuation of the fall to $ 175. A strong signal in favor of this option will be a rebound from the upper border of the descending channel, as well as from the trend line on the RSI indicator.

TradingView ETH / USD daily chart
At shorter time frames, the quotes are stuck within the "Triangle" model, which indicates uncertainty before the price goes beyond the model.
There is also a high probability of a breakdown of the upperboundaries of the model and continued growth to the level of $ 270. A strong signal in favor of such a scenario is a rebound from the support line on the RSI indicator. However, it is important to overcome the level of $ 250, which will indicate a breakdown of the upper border of the "Triangle" model.
Cancellation of the option will be the price drop and consolidation below the $ 230 level. In this case, it is worth moving to the scenario with the continuation of the development of the downward movement to the level of $ 175.

Four-hour ETH / USD chart from TradingView
Litecoin
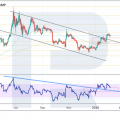
LTC quotes on the daily chart continuecorrective movement. We can assume that the “Head and Shoulders” has moved into the “Triangle” pattern. However, here, too, a breakdown of the lower boundary of the model can provoke a continuation of the fall to the $ 24 level. An additional signal in favor of this option is a rebound from the resistance line on the RSI indicator. It remains to wait for confirmation in the form of a breakdown of the $ 38 level.
In case of strong growth and the price fixing above the $ 51 level, we should expect a renewed upward momentum and continued growth to the $ 68 mark.

TradingView LTC / USD daily chart
On the four-hour chart, the LTC / USD quotes alsoclamped within the "Triangle" model. However, already here the indicator values are repelled from the support line, which indicates a probable upward rebound to the $ 48 level. A breakdown of the latter will indicate continued growth and resumption of the bullish trend on the daily chart of the asset. With strong selling pressure and the price fixing below the $ 44 level, we should expect a continuation of the fall to the $ 41 level and further to $ 38.

TradingView LTC / USD four hour chart
Bitcoin cash
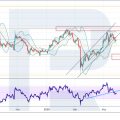
Market participants never managed to push the rateBitcoin Cash outside of the "Triangle" model. Despite the crossing of the moving averages, there is no upward movement yet. Moreover, there is a rebound from the resistance line on the RSI indicator, indicating a potential continuation of the price decline towards the $ 136 level. This idea will be confirmed by the breakdown of the lower boundary of the model with the price fixing below the $ 243 level.
If buyers succeed in pushing the price beyond the $ 280 level, it is worth moving to the option with the price continuing to rise to the $ 356 mark.

TradingView BCH / USD daily chart
On the four-hour chart, Bitcoin Cash alsoclamped within the "Triangle" model within the ascending channel. There is a rebound from the support line on the RSI indicator, so an attempt to rise to the $ 264 level should not be ruled out, the breakdown of which will indicate a continued rise to the $ 280 level.
In case of a breakdown of the lower border of the ascending channel with the price fixing below the $ 235 level, it is worth moving to the option with the continuation of the fall.

Four-hour BCH / USD chart from TradingView
TRON
On the daily chart, TRON quotes continuegrow uncertainly. To confirm the development of the upward momentum, it is important to see the breakdown of the upper border of the descending channel and the price fixing above the $ 0.021 level. In this case, you can go to the option with an increase to the level of $ 0.027.
However, there is a rebound from the resistance line atindicator RSI, which indicates a high probability of continuation of the fall to the level of $ 0.11. Therefore, with the breakdown of the lower border of the channel, we should expect movement to the nearest support and further to the level of $ 0.006.

TRON / USD Daily Chart by TradingView
At shorter time intervals, quotesgrowing within the ascending channel. There is a potential for a test of the lower boundary of the channel at $ 0.016 and continued growth to the levels of $ 0.018 and $ 0.02. An additional signal in favor of this option will be a rebound from the support line at the RSI initiator.

TRON / USD 4 Hour Chart by TradingView
A breakdown of the channel's lower border will act as a cancellation of the variant. In this case, it is worth considering the continuation of the decline to the level of $ 0.012.
Read this:
 Cryptocurrency price analysis: buyers can still seize the initiative
 Cryptocurrency price analysis: bear pressure remains
 Cryptocurrency price analysis: Bitcoin tuned to new local highs
 Cryptocurrency price analysis: another strong market decline cannot be ruled out
 XRP owners are increasingly considering hibernation in anticipation of the rise in token prices
 Cryptocurrency Price Analysis: Potential for Reduction Remains